Military Training Aircraft Market Size and Share
Market Overview
| Study Period | 2020 - 2031 |
|---|---|
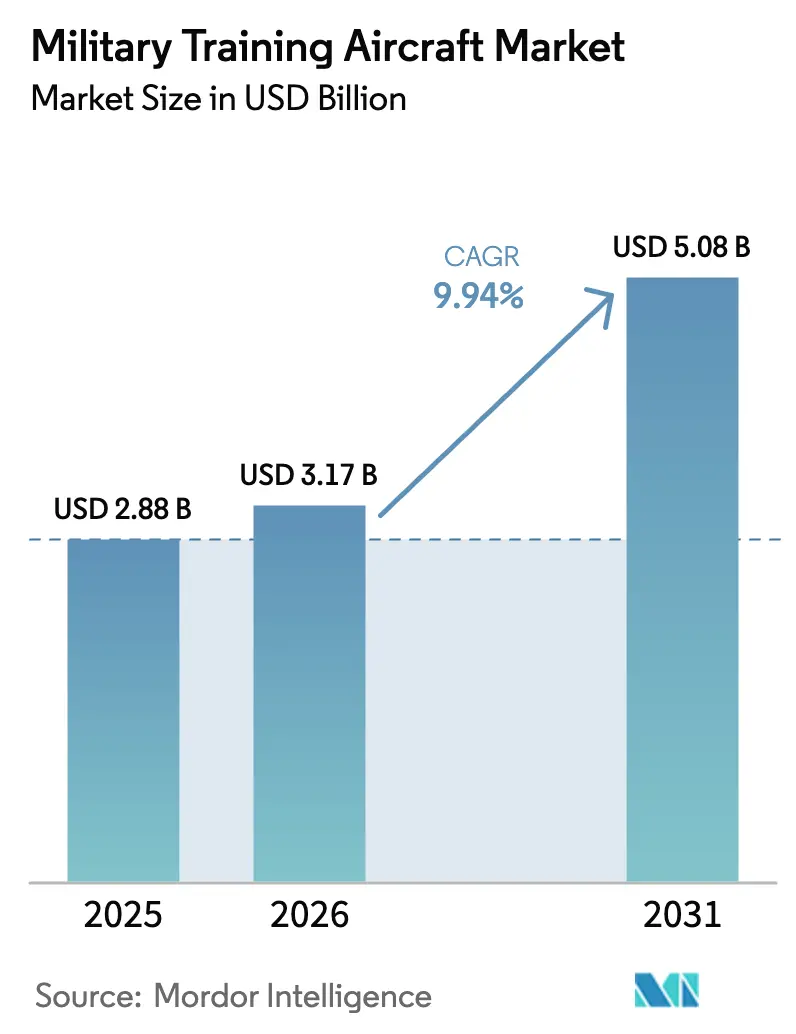
| Market Size (2026) | USD 3.17 Billion |
| Market Size (2031) | USD 5.08 Billion |
| Growth Rate (2026 - 2031) | 9.94% CAGR |
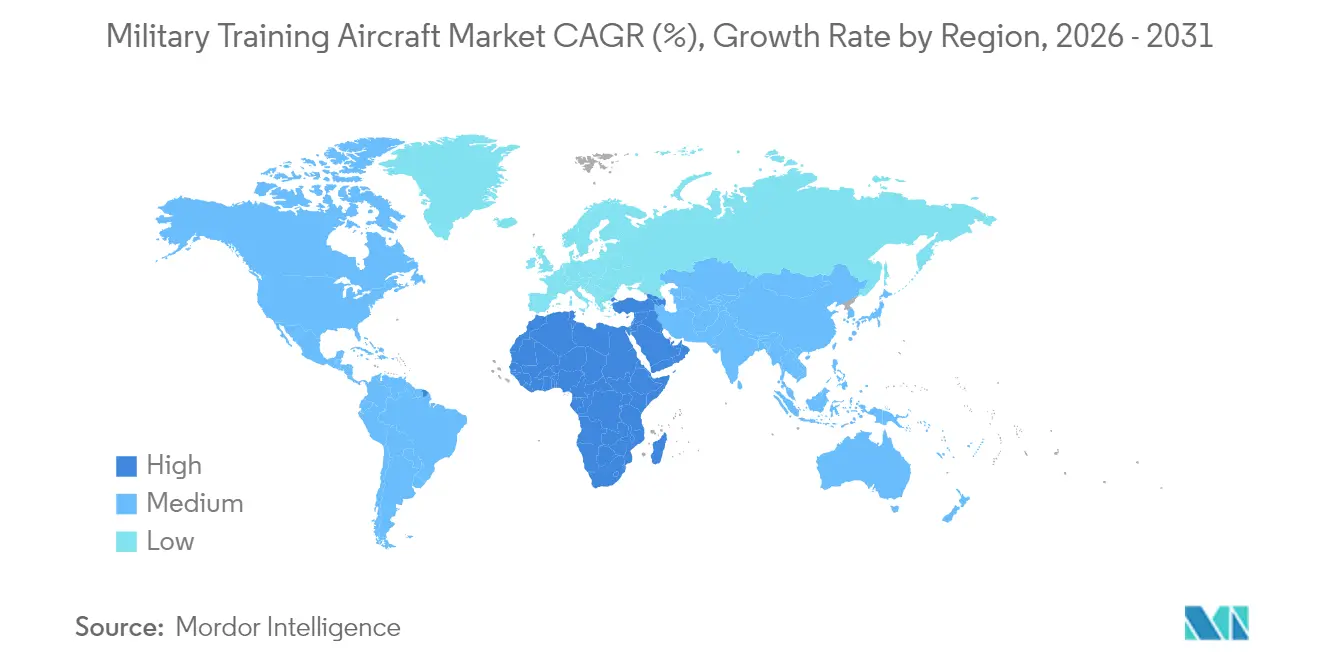
| Fastest Growing Market | Middle East |
| Largest Market | Asia Pacific |
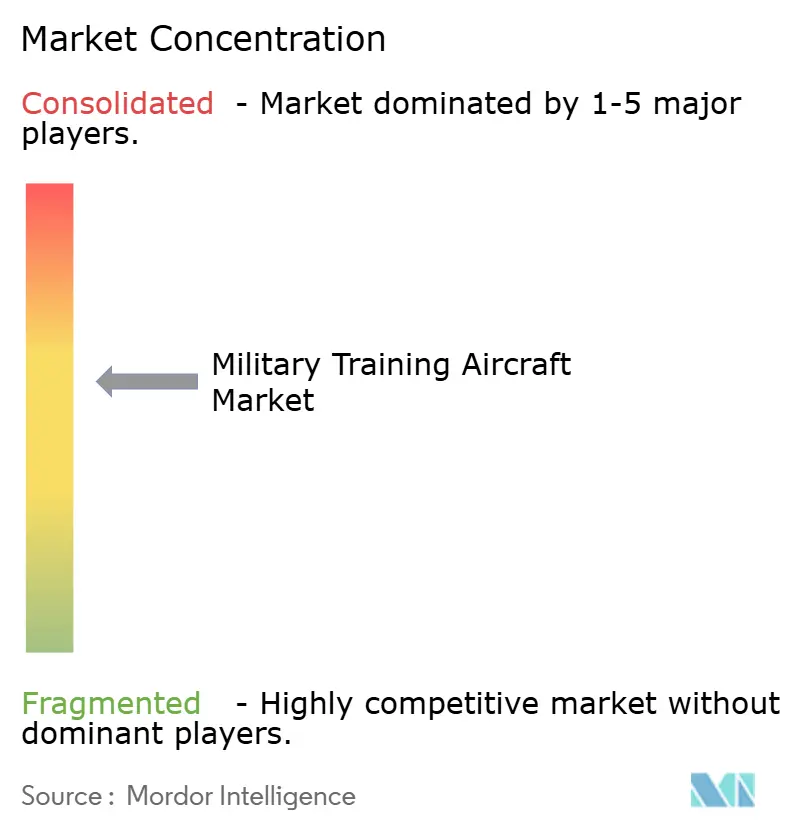
| Market Concentration | Medium |
Major Players
*Disclaimer: Major Players sorted in no particular order Image © Mordor Intelligence. Reuse requires attribution under CC BY 4.0. |
|
Military Training Aircraft Market Analysis by Mordor Intelligence
The military training aircraft market size in 2026 is estimated at USD 3.17 billion, growing from 2025 value of USD 2.88 billion with 2031 projections showing USD 5.08 billion, growing at 9.94% CAGR over 2026-2031. Rapid fleet modernization programs, surging pilot demand, and the imperative to prepare aviators for fifth-generation combat environments catalyze this expansion. Nations are replacing aging T-37 and T-38 platforms with digitally native trainers, and sustained defense spending growth in Asia-Pacific and the Middle East keeps procurement pipelines active. Operators increasingly seek systems that integrate live-virtual-constructive (LVC) capabilities, marry high-fidelity cockpits with adaptive software, and comply with emerging sustainability mandates. Competitive dynamics center on securing long-term service contracts, embedding open-architecture avionics, and forging local industrial partnerships that align with sovereign capability goals.
Key Report Takeaways
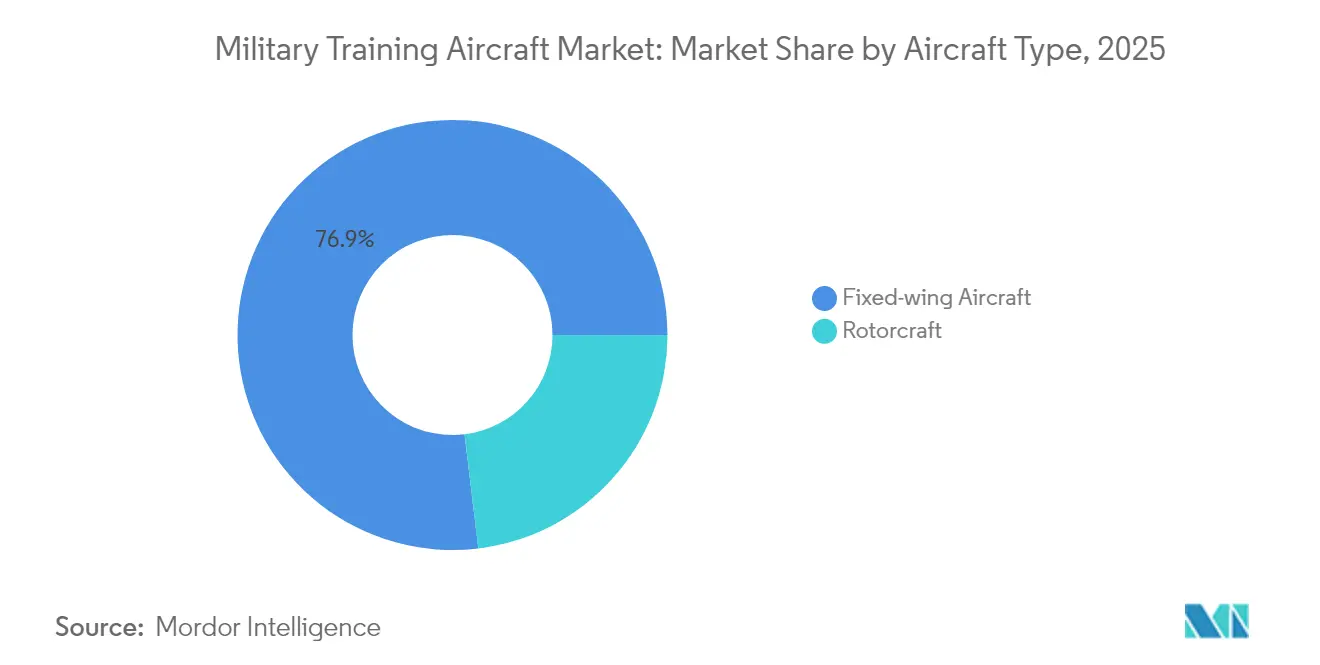
- By aircraft type, fixed-wing platforms led with 76.92% of the military training aircraft market share in 2025, while rotorcraft are projected to be the fastest-growing category from 2026-2031, registering 11.09% CAGR.
- By end-user service, air force operations commanded 51.32% share of the military training aircraft market size in 2025, whereas joint/special operations is forecasted to expand at a 8.74% CAGR through 2031.
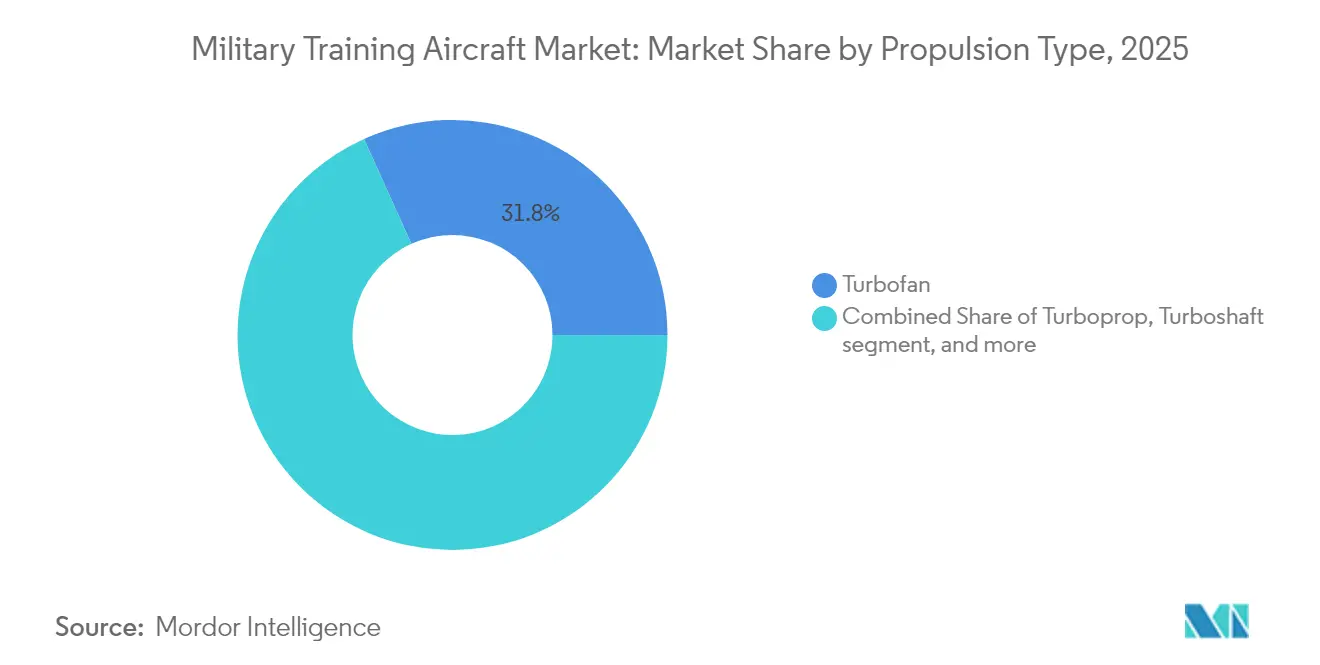
- By propulsion, traditional turbofan and turboprop engines jointly dominated in 2025, while fully electric/hybrid-electric concepts are advancing at an 7.88% CAGR between 2026 and 2031.
- By geography, the Asia-Pacific region accounted for 37.85% of the military training aircraft market in 2025, while the Middle East is expected to expand at a 10.21% CAGR through 2031.
Note: Market size and forecast figures in this report are generated using Mordor Intelligence’s proprietary estimation framework, updated with the latest available data and insights as of 2026.
Global Military Training Aircraft Market Trends and Insights
Drivers Impact Analysis*
| Driver | (~) % Impact on CAGR Forecast | Geographic Relevance | Impact Timeline |
|---|---|---|---|
| Fleet recapitalization of ageing trainers | +3.2% | Global, with concentration in North America and Europe | Medium term (2-4 years) |
| Rising defense budgets in Asia and the Middle East | +2.8% | Asia-Pacific core, spill-over to Middle East and Africa | Short term (≤ 2 years) |
| Demand for 5th-gen compatible lift platforms | +2.1% | North America and Europe, expanding to Asia-Pacific | Long term (≥ 4 years) |
| Growth of outsourced pilot-training contracts | +1.7% | Global, early adoption in North America and Australia | Medium term (2-4 years) |
| Emerging optionally-manned trainer demand | +1.4% | North America and Europe, pilot programs in Asia-Pacific | Long term (≥ 4 years) |
| Extended Reality (XR)/Artificial Intelligence (AI)-based adaptive training boosting aircraft sales | +1.1% | Global, with advanced markets leading adoption | Medium term (2-4 years) |
| Source: Mordor Intelligence | |||


Fleet Recapitalization of Ageing Trainers
Dozens of legacy aircraft, such as the T-37 Tweet and T-38 Talon, are nearing structural life limits, prompting wholesale replacement programs. The US is fielding the T-7A Red Hawk to replace 351 T-38Cs and embed embedded training systems that reduce syllabus length.[1]Air Force Magazine, "T-7A Red Hawk Program Advances Despite Challenges," AIRFORCEMAG.COM Canada’s USD 8.3 billion Future Aircrew Training initiative mirrors this push by bundling new fleets, simulators, and courseware under the SkyAlyne consortium.[2]Red 6, "Red 6 Advances AR Training Technology for Military Applications," REDSIX.COM European operators weigh M-346 and T-50 procurements, while emerging economies favor domestic programs to foster industrial depth. Replacement cycles consequently anchor the military training aircraft market, ensuring baseline demand even when frontline fighter budgets tighten.
Rising Defense Budgets in Asia and the Middle East
Saudi Arabia, the UAE, India, and China are channeling record defense allocations into indigenizing pilot pipelines. Riyadh earmarked USD 7.68 billion for modernization in 2024, prioritizing turnkey training ecosystems that avoid reliance on foreign bases.[3]Jane's Defence Weekly, "Saudi Arabia Increases Defense Spending Focus on Training," JANES.COM The UAE pairs F-35 ambitions with local trainer assembly lines, while India bankrolls the HTT-40 to build self-sufficiency.[4]Hindustan Aeronautics Limited, "HTT-40 Basic Trainer Aircraft Program Advances," HAL-INDIA.CO.IN Each initiative boosts regional orders, amplifying the Asia-Pacific and Middle Eastern military training aircraft market share.
Demand for 5th-gen Compatible Lift Platforms
As F-35 fleets proliferate, air forces require trainers that replicate sensor fusion, data-link workflows, and low-observable handling. Boeing designed the T-7A cockpit around open-architecture software and large-area displays to shorten pilot conversion timelines. Europe’s Global Combat Air Program (GCAP) will also require adaptive trainers capable of emulating 6th-generation tactics. Even smaller F-35 customers now stipulate advanced embedded simulation, nudging procurement toward digitally native aircraft and sustaining premium-priced segments within the military training aircraft market.
Growth of Outsourced Pilot-training Contracts
Defense ministries outsource fixed-price training syllabi to private consortia that supply aircraft, instructors, and maintenance. SkyAlyne’s Canadian award and Australia’s Boeing-Lockheed partnership showcase risk-transfer models that free military staff for operational duties. Contractors continuously refresh fleets and simulators to keep curricula current, indirectly driving new-build deliveries and aftermarket support revenue across the military training aircraft market.
Restraints Impact Analysis*
| Restraint | (~) % Impact on CAGR Forecast | Geographic Relevance | Impact Timeline |
|---|---|---|---|
| Escalating development and acquisition costs | -2.3% | Global, particularly affecting smaller defense budgets | Short term (≤ 2 years) |
| Fighter program delays diverting funds | -1.8% | North America and Europe, cascading to allied nations | Medium term (2-4 years) |
| High-fidelity simulators cutting live hours | -1.2% | Global, advanced markets leading adoption | Long term (≥ 4 years) |
| Sustainability hurdles pertaining to hybrid-electric systems | -0.9% | Europe and North America, expanding globally | Long term (≥ 4 years) |
| Source: Mordor Intelligence | |||
Escalating Development and Acquisition Costs
Advanced avionics, flight-safety standards, and limited production runs elevate unit prices. Boeing’s T-7A is expected to incur USD 1.77 billion in losses by 2024, underscoring the cost risk even for prime contractors. Smaller governments must choose between premium trainers or stretched budgets, occasionally delaying buys and tempering near-term expansion of the military training aircraft market.
High-fidelity Simulators Cutting Live Hours
Regulators now accredit greater syllabus credit to Level-D devices, pushing live-flight quotas downward. The UK Royal Air Force’s (RAF's) VR-enabled curricula allow pilots to finish early phases on the ground, curbing annual flying hour demand. Although most buyers still procure aircraft, the shift compresses fleet sizes and elongates replacement intervals, placing a mild brake on military training aircraft market growth.
*Our forecasts treat driver/restraint impacts as directional, not additive. The impact forecasts reflect baseline growth, mix effects, and variable interactions.
Segment Analysis
By Aircraft Type: Fixed-wing Dominance Drives Market Leadership
Fixed-wing models held 76.92% of the military training aircraft market share in 2025, underscoring their centrality to ab-initio through lead-in fighter instruction. Turboprop basics, such as the T-6C, furnish cost-effective primary sorties, whereas supersonic jets like the T-50 and M-346 bridge the gap to frontline fighters. The Boeing T-7A and Turkish Hürjet pipeline suggests an upcoming refresh wave that could boost the military training aircraft market size for fixed-wing assets through 2031.
Rotorcraft accounts for the balance, registering 11.09% CAGR, serving the army and naval helicopter syllabi. While volume is smaller, modern twin-engine trainers equipped with glass cockpits remain vital for vertical-lift readiness, ensuring this sub-sector preserves a stable foothold within the broader military training aircraft market.


By End-User Service: Air Force Leadership Amid Special Operations Growth
Air Force schools captured 51.32% share of the military training aircraft market size in 2025, reflecting high pilot throughput and multi-type conversion needs. Fleet upgrades such as the HTT-40 for India and the PC-21 for Jordan confirm continued investment. Joint/special operations segments, however, are outpacing the forecast with a projected 8.74% CAGR, as elite units demand bespoke curricula covering ISR, light attack, and infiltration roles.
Joint/special operations is the fastest-growing end-user, advancing at a 8.74% CAGR to 2031, with each requiring specialized platforms. Helicopter trainers serve army schools, while naval aviation demands carrier-compatible jets and maritime patrol instruction. Paramilitary and coast guard operators round out the military training aircraft market with modest but stable procurement cycles focused on multi-mission platforms.
By Propulsion Type: Traditional Engines Maintain Dominance amid Electric Innovation
Conventional turbofans propel most operational trainers, and occupied 31.75% of the market share. Turbofan engines serve advanced jet trainers, while turboshafts drive rotorcraft. Despite this entrenchment, electric and hybrid-electric systems achieve an 7.88% CAGR as governments pursue carbon-reduction targets.
VerdeGo Aero's VH-4T hybrid and Swift Technology Group's all-electric demonstrator for RAF evaluation signal a gradual shift, though technical hurdles remain. Battery capacity and recharging infrastructure constraints currently limit operational deployment; yet, the segment's trajectory suggests that sustainable propulsion will reshape the military training aircraft market by the end of the decade.
Geography Analysis
Asia-Pacific captured 37.85% of the military training aircraft market in 2025, driven by comprehensive modernization programs across China, India, Japan, and South Korea. India's HTT-40 basic trainer program exemplifies the region's push for domestic manufacturing capabilities that reduce foreign dependencies while building indigenous aerospace expertise. China's expanding military aviation footprint necessitates proportionally larger training fleets. At the same time, Japan's acquisition of the T-6 Texan II and South Korea's exports of the T-50 Golden Eagle demonstrate both import and export dynamics within the region. These investments reflect broader security concerns and ambitions to establish regional leadership in aerospace.
The Middle East is expected to register the fastest growth at a 10.21% CAGR through 2031, as Gulf states channel oil revenues into achieving aviation self-sufficiency. Saudi Arabia's Vision 2030 initiative prioritizes domestic training infrastructure to support the expansion of its fighter fleet, while the UAE's F-35 aspirations necessitate compatible training systems. Qatar's defense modernization likewise emphasizes pilot development capabilities. These nations are increasingly structuring procurement deals to include technology transfer provisions and local manufacturing components, creating regional aerospace clusters that support long-term growth in the military training aircraft market.
North America maintains a significant share of the military training aircraft market through the US Air Force's T-7A Red Hawk program and Canada's Future Aircrew Training initiative. European operators pursue collaborative and national solutions, with programs like the Global Combat Air Programme (GCAP) driving requirements for next-generation training systems. South America leverages Brazil's success with the Super Tucano to address regional needs, while African nations gradually increase their investments in training aircraft to support expanding air forces. This global distribution ensures the military training aircraft market remains resilient to regional budget fluctuations.

Competitive Landscape
The military training aircraft market exhibits moderate concentration, with established aerospace primes leveraging decades-long customer relationships and proven platforms. Boeing, Leonardo, Textron, Korea Aerospace Industries, and Pilatus Aircraft lead the way with comprehensive portfolios spanning basic to advanced trainers, while regional challengers like Hindustan Aeronautics Limited gain market share through cost-competitive offerings and technology transfer arrangements. Strategic patterns emphasize platform modernization with digital cockpits, embedded training systems, and service-life extension programs that maximize customer value while creating recurring revenue streams.
White-space opportunities emerge in sustainable propulsion and augmented reality training, with traditional OEMs facing competition from technology-focused entrants. Red 6's augmented reality system overlays synthetic threats onto live training sorties, creating differentiation potential for airframers that integrate such capabilities. Electric and hybrid-electric propulsion attracts new entrants, although certification pathways tend to favor established manufacturers with regulatory experience. Successful platforms benefit from network effects as allied nations seek interoperable training systems that facilitate joint operations and pilot exchange programs.
Competitive intensity increases as training aircraft prices approach fighter costs, forcing vendors to demonstrate clear value propositions. Companies that package aircraft, simulators, and support services into integrated solutions gain an advantage by reducing customer procurement complexity. International partnerships proliferate as prime contractors seek local manufacturing arrangements that satisfy offset requirements while accessing emerging markets. These dynamics suggest the military training aircraft market will maintain its current structure while gradually accommodating new entrants in specialized technology niches.
Military Training Aircraft Industry Leaders
-
Pilatus Aircraft Ltd.
-
The Boeing Company
-
Korea Aerospace Industries Ltd.
-
Textron Inc.
-
Leonardo S.p.A.
- *Disclaimer: Major Players sorted in no particular order

Recent Industry Developments
- October 2025: Boeing and Leonardo announced their collaboration to compete for the US Army's Flight School Next contractor-owned, contractor-operated (COCO) service contract.
- October 2025: Hindustan Aeronautics Limited commissioned its second production line for the HTT-40 basic trainer aircraft, marking a significant milestone in India's indigenous aerospace manufacturing efforts.
- July 2025: Acron Aviation signed an Educational Service Agreement (ESA) with the US Air Force to provide initial pilot training for officers selected for the Undergraduate Pilot Training program.


Global Military Training Aircraft Market Report Scope
| Fixed-wing Aircraft |
| Rotorcraft |
| Air Force |
| Army Aviation |
| Naval/Marine Corps Aviation |
| Joint/Special Operations |
| Paramilitary and Coast Guard |
| Turbojet |
| Turboprop |
| Turboshaft |
| Fully Electric/Hybrid-Electric |
| North America | United States | |
| Canada | ||
| Mexico | ||
| Europe | United Kingdom | |
| France | ||
| Germany | ||
| Spain | ||
| Italy | ||
| Russia | ||
| Rest of Europe | ||
| Asia-Pacific | China | |
| India | ||
| Japan | ||
| South Korea | ||
| Indonesia | ||
| Australia | ||
| Rest of Asia-Pacific | ||
| South America | Brazil | |
| Rest of South America | ||
| Middle East and Africa | Middle East | Saudi Arabia |
| United Arab Emirates | ||
| Qatar | ||
| Rest of Middle East | ||
| Africa | South Africa | |
| Nigeria | ||
| Rest of Africa | ||
| By Aircraft Type | Fixed-wing Aircraft | ||
| Rotorcraft | |||
| By End-User Service | Air Force | ||
| Army Aviation | |||
| Naval/Marine Corps Aviation | |||
| Joint/Special Operations | |||
| Paramilitary and Coast Guard | |||
| By Propulsion Type | Turbojet | ||
| Turboprop | |||
| Turboshaft | |||
| Fully Electric/Hybrid-Electric | |||
| By Geography | North America | United States | |
| Canada | |||
| Mexico | |||
| Europe | United Kingdom | ||
| France | |||
| Germany | |||
| Spain | |||
| Italy | |||
| Russia | |||
| Rest of Europe | |||
| Asia-Pacific | China | ||
| India | |||
| Japan | |||
| South Korea | |||
| Indonesia | |||
| Australia | |||
| Rest of Asia-Pacific | |||
| South America | Brazil | ||
| Rest of South America | |||
| Middle East and Africa | Middle East | Saudi Arabia | |
| United Arab Emirates | |||
| Qatar | |||
| Rest of Middle East | |||
| Africa | South Africa | ||
| Nigeria | |||
| Rest of Africa | |||


Market Definition
- Aircraft Type - All the military aircraft which are used for various applications are included under military aviation market.
- Sub-Aircraft Type - For this study, all the military fixed-wing transport aircraft which are used for troops and cargo carrying are considered.
- Body Type - Various models of fixed-wing transport aircraft are considered in this study.
| Keyword | Definition |
|---|---|
| IATA | IATA stands for the International Air Transport Association, a trade organization composed of airlines around the world that has an influence over the commercial aspects of flight. |
| ICAO | ICAO stands for International Civil Aviation Organization, a specialized agency of the United Nations that supports aviation and navigation around the globe. |
| Air Operator Certificate (AOC) | A certificate granted by a National Aviation Authority permitting the conduct of commercial flying activities. |
| Certificate Of Airworthiness (CoA) | A Certificate Of Airworthiness (CoA) is issued for an aircraft by the civil aviation authority in the state in which the aircraft is registered. |
| Gross Domestic Product (GDP) | Gross domestic product (GDP) is a monetary measure of the market value of all the final goods and services produced in a specific time period by countries. |
| RPK (Revenue Passenger Kilometres) | The RPK of an airline is the sum of the products obtained by multiplying the number of revenue passengers carried on each flight stage by the stage distance - it is the total number of kilometers traveled by all revenue passengers. |
| Load Factor | The load factor is a metric used in the airline industry that measures the percentage of available seating capacity that has been filled with passengers. |
| Original Equipment Manufacturer (OEM) | An original equipment manufacturer (OEM) traditionally is defined as a company whose goods are used as components in the products of another company, which then sells the finished item to users. |
| International Transportation Safety Association (ITSA) | International Transportation Safety Association (ITSA) is an international network of heads of independent safety investigation authorities (SIA). |
| Available Seats Kilometre (ASK) | This metric is calculated by multiplying Available Seats (AS) in one flight, defined above, multiplied by the distance flown. |
| Gross Weight | The fully-loaded weight of an aircraft, also known as “takeoff weight,” which includes the combined weight of passengers, cargo, and fuel. |
| Airworthiness | The ability of an aircraft, or other airborne equipment or system, to operate in flight and on the ground without significant hazard to aircrew, ground crew, passengers or to other third parties. |
| Airworthiness Standards | Detailed and comprehensive design and safety criteria applicable to the category of aeronautical product (aircraft, engine or propeller). |
| Fixed Base Operator (FBO) | A business or organization that operates at an airport. An FBO provides aircraft operating services like maintenance, fueling, flight training, charter services, hangaring, and parking. |
| High Net worth Individuals (HNWIs) | High Net worth Individuals (HNWIs) are individuals with over USD 1 million in liquid financial assets. |
| Ultra High Net worth Individuals (UHNWIs) | Ultra High Net worth Individuals (UHNWIs) are individuals with over USD 30 million in liquid financial assets. |
| Federal Aviation Administration (FAA) | The division of the Department of Transportation is concerned with aviation. It operates Air Traffic Control and regulates everything from aircraft manufacturing to pilot training to airport operations in the United States. |
| EASA (European Aviation Safety Agency) | The European Aviation Safety Agency is a European Union agency established in 2002 with the task of overseeing civil aviation safety and regulation. |
| Airborne Warning and Control System (AW&C) aircraft | Airborne Warning and Control System (AEW&C) aircraft is equipped with a powerful radar and on-board command and control center to direct the armed forces. |
| The North Atlantic Treaty Organization (NATO) | The North Atlantic Treaty Organization (NATO), also called the North Atlantic Alliance, is an intergovernmental military alliance between 30 member states – 28 European and two North American. |
| Joint Strike Fighter (JSF) | Joint Strike Fighter (JSF) is a development and acquisition program intended to replace a wide range of existing fighter, strike, and ground attack aircraft for the United States, the United Kingdom, Italy, Canada, Australia, the Netherlands, Denmark, Norway, and formerly Turkey. |
| Light Combat Aircraft (LCA) | A light combat aircraft (LCA) is a light, multirole jet/turboprop military aircraft, commonly derived from advanced trainer designs, designed for engaging in light combat. |
| Stockholm International Peace Research Institute (SIPRI) | Stockholm International Peace Research Institute (SIPRI) is an international institute that provides data, analysis, and recommendations for armed conflict, military expenditure, and arms trade as well as disarmament and arms control. |
| Maritime Patrol Aircraft (MPA) | A maritime patrol aircraft (MPA), also known as maritime reconnaissance aircraft is a fixed-wing aircraft designed to operate for long durations over water in maritime patrol roles, in particular, anti-submarine warfare (ASW), anti-ship warfare (AShW), and search and rescue (SAR). |
| Mach Number | The Mach number is defined as the ratio of true airspeed to the speed of sound at the altitude of a given aircraft. |
| Stealth Aircraft | Stealth is a Common term applied to low observable (LO) technology and doctrine, that makes an aircraft near invisible to radar, infrared or visual detection. |


Research Methodology
Mordor Intelligence follows a four-step methodology in all our reports.
- Step-1: Identify Key Variables: In order to build a robust forecasting methodology, the variables and factors identified in Step-1 are tested against available historical market numbers. Through an iterative process, the variables required for market forecast are set and the model is built on the basis of these variables.
- Step-2: Build a Market Model: Market-size estimations for the historical and forecast years have been provided in revenue and volume terms. For sales conversion to volume, the average selling price (ASP) is kept constant throughout the forecast period for each country, and inflation is not a part of the pricing.
- Step-3: Validate and Finalize: In this important step, all market numbers, variables and analyst calls are validated through an extensive network of primary research experts from the market studied. The respondents are selected across levels and functions to generate a holistic picture of the market studied.
- Step-4: Research Outputs: Syndicated Reports, Custom Consulting Assignments, Databases & Subscription Platforms


