Military Battery Market Size and Share
Market Overview
| Study Period | 2019 - 2030 |
|---|---|
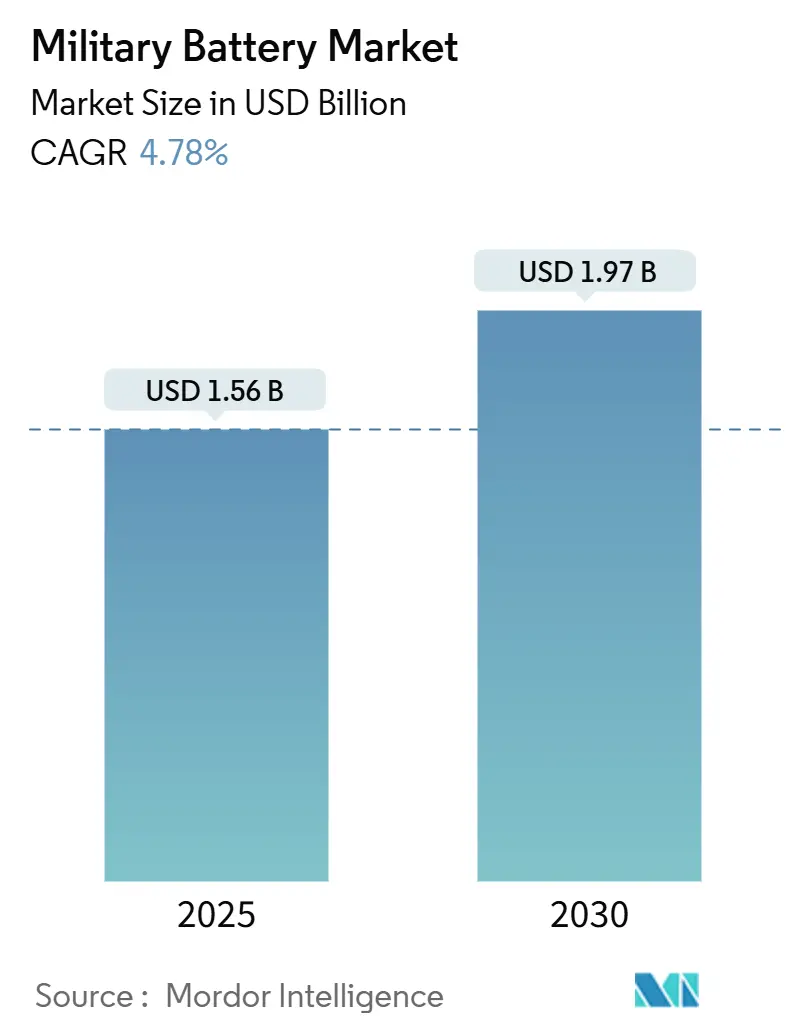
| Market Size (2025) | USD 1.56 Billion |
| Market Size (2030) | USD 1.97 Billion |
| Growth Rate (2025 - 2030) | 4.78% CAGR |
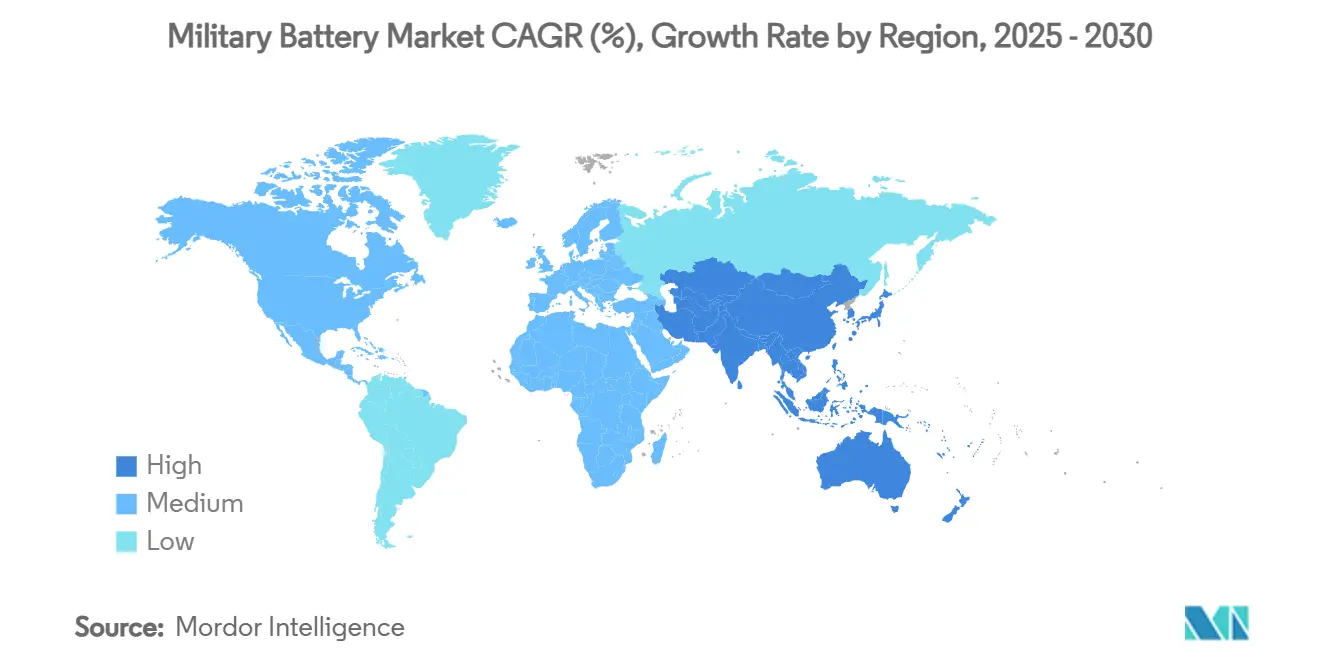
| Fastest Growing Market | Asia Pacific |
| Largest Market | North America |
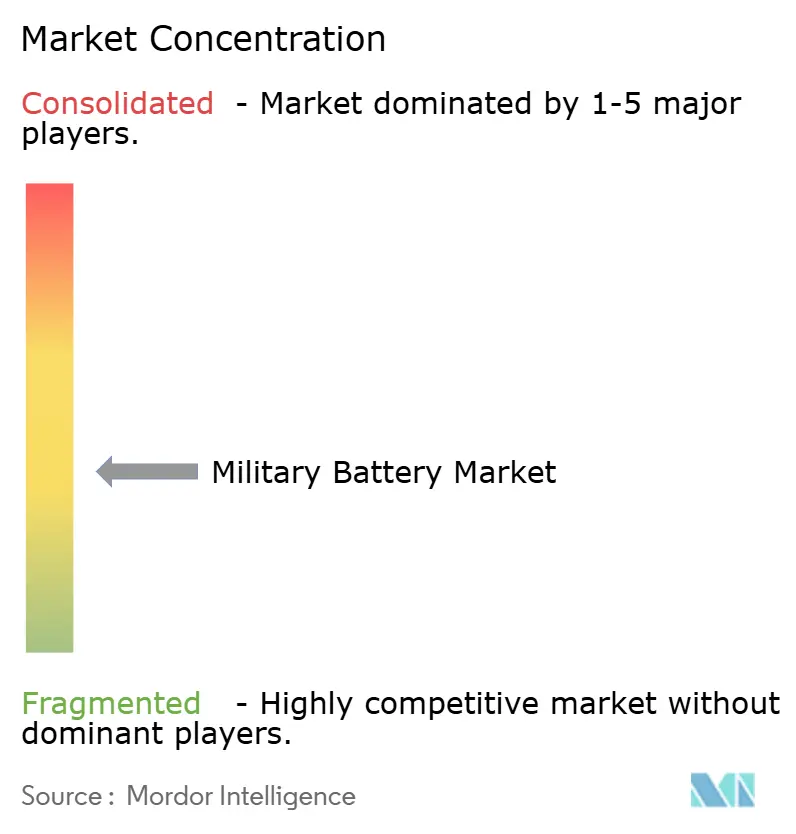
| Market Concentration | Medium |
Major Players *Disclaimer: Major Players sorted in no particular order Image © Mordor Intelligence. Reuse requires attribution under CC BY 4.0. | |
Military Battery Market Analysis by Mordor Intelligence
The military battery market size reached USD 1.56 billion in 2025 and is forecasted to expand at a 4.78% CAGR, attaining USD 1.97 billion by 2030. Growth is propelled by the rapid electrification of next-generation combat platforms, surging deployments of unmanned assets, and rising demand for soldier-worn power solutions. North America commands the most significant slice of the military battery market, buoyed by record US defense budgets and federal incentives for on-shore cell production. Asia-Pacific delivers the fastest expansion on the back of multi-billion-dollar fleet modernization initiatives in Japan, South Korea, and Australia. Lithium-based chemistries remain the workhorse technology due to superior energy density, while solid-state cells and advanced silicon-anode packs headline the innovation pipeline. Ongoing consolidation among established suppliers is expected to streamline certification cycles and deepen vertical integration, yet critical-mineral dependencies and stringent safety protocols continue to temper near-term upside.
Key Report Takeaways
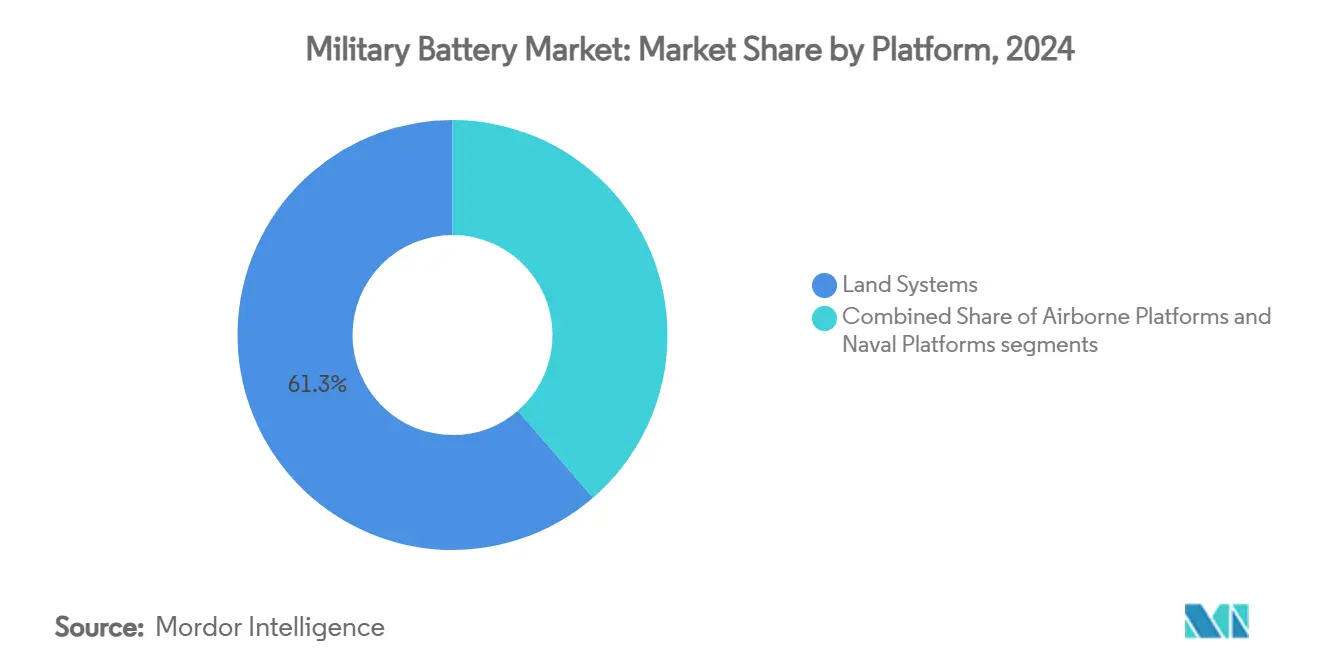
- By platform, land systems led the military battery market with 61.34% of the share in 2024, whereas airborne systems are projected to register the fastest 6.12% CAGR through 2030.
- By battery type, rechargeable solutions accounted for 57.89% of the military battery market size in 2024 and are poised for a 5.67% CAGR to 2030.
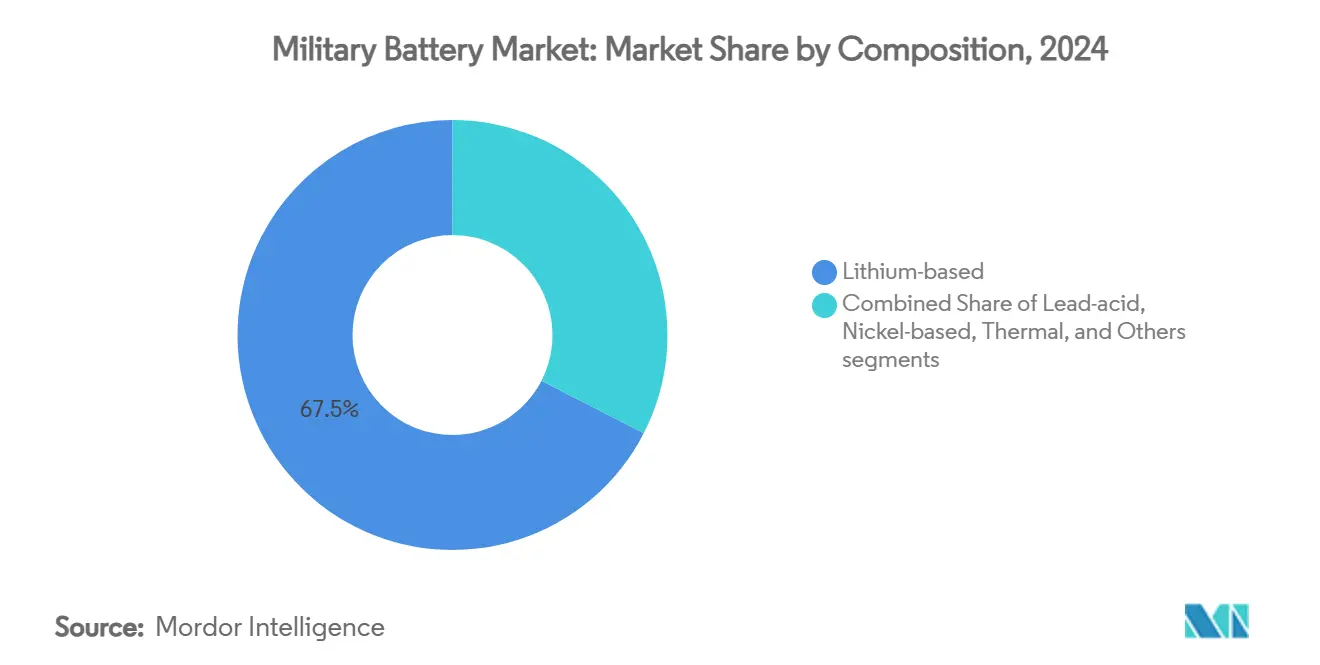
- By composition, lithium-based cells captured a 67.45% share in 2024, and the segment advanced at a 5.12% CAGR over the forecast horizon.
- By power density, the 100-200 Wh/kg category retained 46.56% of the military battery market size in 2024, while packs exceeding 200 Wh/kg are projected to grow at a 6.21% CAGR.
- By end user, OEMs commanded 72.34% share in 2024 and are on track for a 5.10% CAGR through 2030, reflecting the complexity of platform-level integration.
- By geography, North America commanded a 36.67% share in 2024; Asia-Pacific is the fastest-growing region with a 6.41% CAGR through 2030.
Global Military Battery Market Trends and Insights
Drivers Impact Analysis*
| Driver | (~) % Impact on CAGR Forecast | Geographic Relevance | Impact Timeline |
|---|---|---|---|
| Accelerated electrification of next-generation military platforms | +0.7% | Global, led by North America | Medium term (2-4 years) |
| Growing energy demands from expanding unmanned systems fleets | +0.6% | APAC and North America | Short term (≤ 2 years) |
| Rising adoption of wearable technologies in soldier modernization programs | +0.5% | North America and EU, expanding in APAC | Medium term (2-4 years) |
| Increased need for high-performance thermal batteries in extreme environments | +0.4% | Global, Arctic and desert theaters | Long term (≥ 4 years) |
| Implementation of unified military battery standards and cross-service acquisition frameworks | +0.3% | North America, NATO members | Medium term (2-4 years) |
| Emergence of closed-loop recycling programs for military-grade Li-ion batteries | +0.2% | North America and EU | Long term (≥ 4 years) |
| Source: Mordor Intelligence | |||
Accelerated Electrification of Next-Generation Military Platforms
The migration toward hybrid-electric combat and naval assets remains paramount to the military battery market. The US Army’s M1E3 Abrams tank demonstrates up to 50% fuel savings and lower thermal signatures, necessitating high-capacity propulsion packs with battlefield resilience.[1]Army Recognition, “Next Generation Abrams M1E3 Tank,” armyrecognition.com Parallel endeavors by the US Navy to electrify carriers and destroyers require robust modular batteries to stabilize power-dense radar, propulsion, and directed-energy loads. Commercial partners such as GM Defense are field-testing twelve-module packs that enable both Silent Drive and Silent Watch, signaling stronger civil-mil collaboration. The Defense Innovation Unit’s Jumpstart for Advanced Battery Standardization program further compresses qualification timelines by cross-leveraging electric-vehicle form factors. As energy-independent microgrids proliferate forward bases, demand intensifies for rugged batteries that bridge mobile and fixed operations without logistical penalties.
Growing Energy Demands from Expanding Unmanned Systems Fleets
The US military’s intention to field 48,750 UAVs within two years illustrates the unprecedented power curve facing battery suppliers. Each airframe integrates heavier payloads—directed-energy modules, multi-spectral sensors, and AI processors—that magnify endurance requirements. A DoD study shows that equipping 2 million drones with 300 Wh packs would exceed total annual battery consumption across all services. Land robots like General Dynamics’ TRX use hybrid-electric drivetrains, marrying torque with silent mobility and straining current power densities. As artificial-intelligence autonomy grows, continuous edge computing amplifies battery draw. Consequently, the military battery market favors high-energy lithium chemistries that sustain mission profiles without mid-sortie swaps, underlining the strategic value of cell innovations.
Rising Adoption of Wearable Technologies in Soldier Modernization Programs
Modern infantry carry integrated communications, displays, and sensors weighing 20 pounds in batteries for a 72-hour patrol. The Conformal Wearable Battery now uses silicon-anode cells that double energy while preserving form factor.[2]National Defense Magazine, “Army’s Wearable Battery Pack Gets Energized,” nationaldefensemagazine.org Inventus Power has delivered 150,000 units, with its 200 Wh CWB 3.6.2 offering 33% more output than the prior model while meeting ballistic test thresholds. BAE Systems’ Broadsword Spine fabric replaces bulky wiring, cutting harness weight by 40% and allowing modular placement. The US Army’s USD 1.3 billion multivendor contract to advance wearable energy underscores how frontline lethality is now tethered to power management. As a result, the military battery market continues to pivot toward flexible, high-density, and soldier-safe packs.
Increased Need for High-Performance Thermal Batteries in Extreme Environments
Thermal batteries remain irreplaceable for instantaneous, high-current bursts in missiles and space systems. EaglePicher's USD 20 million order for Minuteman III cells highlights the enduring relevance of molten-salt electrochemistry with a 20-year shelf life. Advances in cobalt-disulfide and nickel-sulfide cathodes extend discharge performance for next-generation glide weapons. Lithium-aluminum systems under Air Force development raise energy density for upper-stage rockets. Arctic and desert theaters mandate cells that activate from –32°C to 63°C without thermal runaway, driving innovation in electrolyte compositions and ceramic separators. As directed-energy interceptors mature, instantaneous high-amp pulses will further broaden thermal technologies' military battery market opportunity.
Restraints Impact Analysis*
| Restraint | (~) % Impact on CAGR Forecast | Geographic Relevance | Impact Timeline |
|---|---|---|---|
| Stringent safety and thermal stability certification requirements | -0.4% | Global | Medium term (2-4 years) |
| High dependency on vulnerable critical mineral supply chains | -0.3% | Regions reliant on Chinese processing | Short term (≤ 2 years) |
| Limited technology transfer due to classified intellectual property restrictions | -0.2% | Global | Long term (≥ 4 years) |
| Rising tariffs and trade barriers on battery components from key suppliers | -0.2% | US–China and EU trade spheres | Short term (≤ 2 years) |
| Source: Mordor Intelligence | |||
Stringent Safety and Thermal Stability Certification Requirements
The Navy’s Lithium Battery Safety Program obliges suppliers to conduct exhaustive MIL-STD-810 environmental, ballistic, and electromagnetic trials before operational release.[3]NAVSEA, “Navy Lithium Battery Safety Program,” navsea.navy.mil New chemistries such as solid-state or silicon-anode cells endure heightened scrutiny due to limited field history, adding several years to time-to-fleet and inflating non-recurring test costs. Domestic-production mandates further complicate the pipeline, as fresh US plants must pass the same battery-by-battery validation hierarchy. Battery-management systems incorporating artificial-intelligence prognostics also need cybersecurity accreditation under DoD A-risk frameworks. Collectively, these gatekeepers slow adoption despite clear performance advantages, constraining the near-term military battery market.
High Dependency on Vulnerable Critical Mineral Supply Chains
China processes 87% of the world’s refined rare-earths and dominates lithium, cobalt, and graphite mid-stream conversion, exposing allied producers to embargo risk. The 2024 National Defense Authorization Act now prohibits Pentagon procurements from leading Chinese battery giants CATL and BYD, squeezing an already tight vendor pool. The US National Defense Stockpile lacks enough cobalt and manganese to sustain six months of high-tempo operations, forcing urgent exploration of domestic mining and recycling initiatives. New extraction projects face multi-year permitting cycles, an obstacle the military battery market must navigate until closed-loop recycling and alternate chemistries offset the deficit.
*Our forecasts treat driver/restraint impacts as directional, not additive. The impact forecasts reflect baseline growth, mix effects, and variable interactions.
Segment Analysis
By Platform: Land Systems Drive Current Demand
Land vehicles dominated the military battery market with 61.34% share in 2024 as hybrid-electric propulsion, silent watch, and soldier-portable electronics converged on the battlefield. Propulsion packs now supply hotel loads for command-and-control suites, electronic countermeasures, and future high-energy lasers. The M1E3 Abrams points to a doctrine shift where batteries augment or replace auxiliary power units. In parallel, tactical microgrids distribute stored energy among forward operating bases, reinforcing continuous demand across wheeled and tracked fleets. The airborne segment, though smaller, posts a robust 6.12% CAGR as unmanned combat aerial vehicles (UCAVs) and directed-energy pods necessitate lightweight, power-dense cells that survive high-g maneuvers. Compatibility with MIL-STD-704 electrical standards ensures cross-platform interchangeability, amplifying economies of scale. Naval programs adopt a similar hybrid architecture, although growth remains steady rather than explosive. Collectively, platforms continue to anchor the military battery market trajectory toward integrated, versatile energy ecosystems.
Land systems further solidified their edge during 2025 procurement cycles as the US Army allocated funds for Next Generation Tactical Vehicle-Hybrid prototypes. European armies followed suit, issuing RfIs for silent-mobility reconnaissance vehicles. These orders scale factory runs, lowering unit cost per kWh and reinforcing land dominance. However, the airborne community benefits from technology spill-over: silicon-rich anodes and high-rate solid electrolytes, validated under armored stress, migrate to Group 4-5 UAVs. Naval combatants close the loop by requiring the same battery module footprints for embarked drones, landing craft, and high-power radar buffers. This cross-domain adaptability keeps the military battery market resilient against cyclical budget swings in any platform group.


By Battery Type: Rechargeable Solutions Dominate Operations
Rechargeables commanded 57.89% of the military battery market size during 2024 and are on pace for a 5.67% CAGR through 2030, mirroring DoD policy to cut single-use logistic weight. The Family of Advanced Standard Batteries initiative harmonizes form factors so that one cell model can power radios, drones, and night-vision gear, trimming SKUs by 30%. Life-cycle cost advantages multiply in remote theaters where resupply is contested. Non-rechargeables remain indispensable for munitions and emergency beacons; thermal batteries in particular guarantee arming sequences after decades of dormancy. Their share, however, contracts gradually as rechargeable energy density climbs and on-site chargers proliferate.
Rechargeable adoption surged once field chargers gained ruggedization approvals for austere weather ranges from –40°C to 50°C. Solar and fuel-cell hybrids replenish packs during daylight contingencies, extending mission dwell time. Concurrently, generational leaps in silicon-anode and LFP+LMFP chemistries lift cycle counts above 3,000. Despite advances, the military battery market keeps a niche for primary cells where absolute reliability outweighs long-term cost, especially in strategic deterrent missiles that cannot risk self-discharge. Over the forecast period, steady RDT&E funding aims to erase the remaining energy-density gap, reinforcing rechargeable primacy.
By Composition: Lithium-Based Technologies Lead Innovation
Lithium chemistries occupied 67.45% of the military battery market share in 2024 and pursued a 5.12% CAGR due to an unmatched gravimetric energy density.[4]NanoGraf Corporation, “Army Contract to Advance Lithium-ion Production,” nanograf.com Silicon-dominant anodes, championed by NanoGraf and Amprius, double capacity without bulk penalties, while solid electrolytes eliminate flammable solvents and raise operating-temperature ceilings. Lithium iron phosphate variants balance cost, cycle life, and thermal resilience for combat-vehicle hotel loads. Lead-acid persists where cold-cranking and cost overrule weight, notably in stationary backup arrays. Nickel-hydrogen and silver-zinc options fill deep-space or deep-sea roles where extreme pressure or vacuum mitigate lithium strengths.
Research labs focus on lithium-sulfur (LiS) and lithium-metal systems, promising 400+ Wh/kg. Yet cathode dissolution, dendritic growth, and swell management prolong their qualification by the US Department of Defense (DoD). Meanwhile, thermal-battery compositions evolve via lithium-silicon anodes and cobalt-disulfide cathodes for missile-borne acceleration. Non-flammable electrolytes such as LiGas advance naval safety by containing runaway within ventable chambers. Therefore, the military battery market maintains diversity; lithium’s versatile performance curve remains the mainstay across tactical, strategic, and installation-level obligations.
By Power Density: High-Density Solutions Drive Performance
Cells in the 100-200 Wh/kg bracket controlled 46.56% of the military battery market size during 2024, representing today’s sweet spot between endurance and safety for handheld radios, ground sensors, and hybrid drives. Packs surpassing 200 Wh/kg exhibit the briskest 6.21% CAGR because soldier-borne and UAV payloads crave more extended sorties without mass penalties. Amprius prototypes at 400 Wh/kg hint at radical cuts in logistic footprint for airborne swarms. Low-density offerings below 100 Wh/kg persist for stationary racks where volumetric constraints are lenient and cost per kilowatt-hour dictates procurement.
The march to higher density faces thermal runaway risk. Consequently, defense projects pair energy gains with new venting hardware, predictive BMS algorithms, and ceramic separators. Solid-state designs charging in minutes yet lasting 6,000 cycles have cleared initial lab milestones, though whole MIL-STD-810 vibration and ballistic validation remain pending. Continuous miniaturization of sensors, radios, and onboard AI offloads part of the mass savings to electronics, reinforcing the value of each incremental Wh/kg. Thus, the military battery market ascends the energy curve while erecting safety countermeasures in parallel.
By End User: OEM Dominance Reflects Integration Complexity
OEMs captured 72.34% of the military battery market share in 2024 due to the intricacy of embedding cells within propulsion, avionics, and power-distribution subsystems. Platform build partners such as BAE Systems plc, Lockheed Martin Corporation, and Northrop Grumman Corporation integrate bespoke packs that navigate space, weight, cooling, and electromagnetic compatibility constraints. Aftermarket providers fill critical sustainment gaps, yet their influence trails OEMs because retrofit timelines hinge on airworthiness or safety-release approvals.
EnerSys’s USD 208 million acquisition of Bren-Tronics exemplifies vertical integration, blending high-rate lithium cells with legacy supply-chain heft. Similarly, Defense Innovation Unit pilot contracts lured EV brands into ruggedized defense builds, encouraging dual-use economies. Over time, the military battery market’s OEM segment is expected to expand its testing labs, AI-enabled BMS stacks, and recycling corridors, suppressing total-ownership cost and elevating integration value. Aftermarket players remain essential for legacy system upgrades, but will increasingly adopt OEM-grade quality systems to stay competitive.
Geography Analysis
North America retained a 36.67% share of the military battery market in 2024, buttressed by a USD 997 billion US defense budget prioritizing power-centric modernization. Federal grants totaling USD 199 million for an EnerSys lithium-ion gigafactory and USD 144 million for recycling infrastructure illustrate Washington’s resolve to insulate supply chains from overseas shocks. Canada bolsters regional demand through NORAD radar upgrades that require high-capacity standby batteries resilient to Arctic temperatures.
Asia-Pacific generates the fastest 6.41% CAGR as Japan, Australia, South Korea, and India ratchet defense outlays in response to regional tensions. Japan’s USD 10 billion frigate program with Australia embeds sophisticated naval battery systems. China’s USD 314 billion expenditure pressures neighbors to accelerate directed-energy deployments, amplifying cell requirements. Taiwanese, Philippine, and South Korean procurements for counter-UAS and missile-defense networks add incremental demand across portable and fixed batteries.
Europe and the Middle East together represent a sizable opportunity pool. European military budgets jumped 17% to USD 693 billion in 2024 amid the Ukraine war, spurring joint procurement programs that standardize battery specifications across NATO. Rheinmetall’s sustainable forward operating base project under the European Defence Fund highlights rising appetite for grid-scale military energy storage. The Middle East allocated USD 243 billion in 2024, with Saudi Arabia alone budgeting USD 78 billion for 2025, sustaining procurement of ruggedized power packs for desert operations.

Competitive Landscape
The military battery market remains moderately fragmented, yet consolidation momentum strengthens. EnerSys’s Bren-Tronics takeover and Tuthill’s move on EaglePicher fold niche thermal-battery expertise into diversified conglomerates, broadening product portfolios and accelerating R&D amortization. Traditional defense primes retain advantage in classified applications but increasingly partner with agile startups for rapid prototyping.
Silicon-anode pioneer Amprius supplies double-density cells for wearable programs. At the same time, Eonix Energy develops non-flammable electrolytes targeting shipboard safety. Ion Storage Systems commissioned one of the largest solid-state pilot lines in the United States, aiming for multi-layer ceramic separators that curtail runaway risk. Patent activity intensifies around high-voltage cathodes, nano-engineered current collectors, and AI-driven battery-management firmware.
Supply security shapes competition as well. Firms with domestic mining partnerships or proprietary recycling paths wield contracting advantages under Buy American clauses. At the same time, China’s July 2025 export controls on LFP and LMFP know-how incentivize Western firms to fast-track in-house cathode research. Companies that certify complete home-grown value chains are expected to capture premium share in sensitive programs, underscoring how geopolitics and technology now intertwine across the military battery market.
Military Battery Industry Leaders
Saft Groupe SAS
EnerSys
Arotech Corporation
GS Yuasa Corporation
EaglePicher Technologies, LLC
- *Disclaimer: Major Players sorted in no particular order

Recent Industry Developments
- March 2025: EaglePicher Technologies received a USD 20 million contract from the US Air Force to manufacture batteries for the Minuteman III intercontinental ballistic missile guidance systems.
- July 2024: EnerSys acquired Bren-Tronics, marking a significant milestone in its strategic growth and expansion initiatives.


Global Military Battery Market Report Scope
| Land Systems |
| Airborne Platforms |
| Naval Platforms |
| Rechargeable |
| Non-rechargeable |
| Lithium-based |
| Lead-acid |
| Nickel-based |
| Thermal |
| Others |
| Less than 100 Wh/kg |
| 100 to 200 Wh/kg |
| More than 200 Wh/kg |
| Original Equipment Manufacturer (OEM) |
| Aftermarket |
| North America | United States | |
| Canada | ||
| Mexico | ||
| Europe | United Kingdom | |
| France | ||
| Germany | ||
| Italy | ||
| Rest of Europe | ||
| Asia-Pacific | China | |
| India | ||
| Japan | ||
| South Korea | ||
| Australia | ||
| Rest of Asia-Pacific | ||
| South America | Brazil | |
| Rest of South America | ||
| Middle East and Africa | Middle East | Saudi Arabia |
| United Arab Emirates | ||
| Rest of Middle East | ||
| Africa | South Africa | |
| Rest of Africa | ||
| By Platform | Land Systems | ||
| Airborne Platforms | |||
| Naval Platforms | |||
| By Battery Type | Rechargeable | ||
| Non-rechargeable | |||
| By Composition | Lithium-based | ||
| Lead-acid | |||
| Nickel-based | |||
| Thermal | |||
| Others | |||
| By Power Density | Less than 100 Wh/kg | ||
| 100 to 200 Wh/kg | |||
| More than 200 Wh/kg | |||
| By End User | Original Equipment Manufacturer (OEM) | ||
| Aftermarket | |||
| By Geography | North America | United States | |
| Canada | |||
| Mexico | |||
| Europe | United Kingdom | ||
| France | |||
| Germany | |||
| Italy | |||
| Rest of Europe | |||
| Asia-Pacific | China | ||
| India | |||
| Japan | |||
| South Korea | |||
| Australia | |||
| Rest of Asia-Pacific | |||
| South America | Brazil | ||
| Rest of South America | |||
| Middle East and Africa | Middle East | Saudi Arabia | |
| United Arab Emirates | |||
| Rest of Middle East | |||
| Africa | South Africa | ||
| Rest of Africa | |||


Key Questions Answered in the Report
What is the current value of the military battery market?
The military battery market size stood at USD 1.56 billion in 2025 and is projected to hit USD 1.97 billion by 2030.
Which region leads demand for defense-grade batteries?
North America holds the largest share at 36.67%, driven by sizeable US procurement budgets and new domestic gigafactories.
Which platform category contributes the most to battery consumption?
Land systems account for 61.34% of demand as armies field hybrid-electric combat vehicles and soldier-worn electronics.
What technology trend offers the biggest performance leap?
Silicon-anode and emerging solid-state lithium cells promise energy densities above 400 Wh/kg while enhancing safety.
How are supply-chain risks being mitigated?
The Pentagon funds domestic mining, recycling, and Buy American–compliant production, while mandating multi-source contracts to limit exposure to foreign bottlenecks.
Why are thermal batteries still relevant?
Thermal batteries provide instant, high-current power with 20-year shelf life, making them indispensable for strategic missiles and space systems.
Page last updated on:


