Low Voltage MLCC Market Size and Share
Market Overview
| Study Period | 2020 - 2031 |
|---|---|
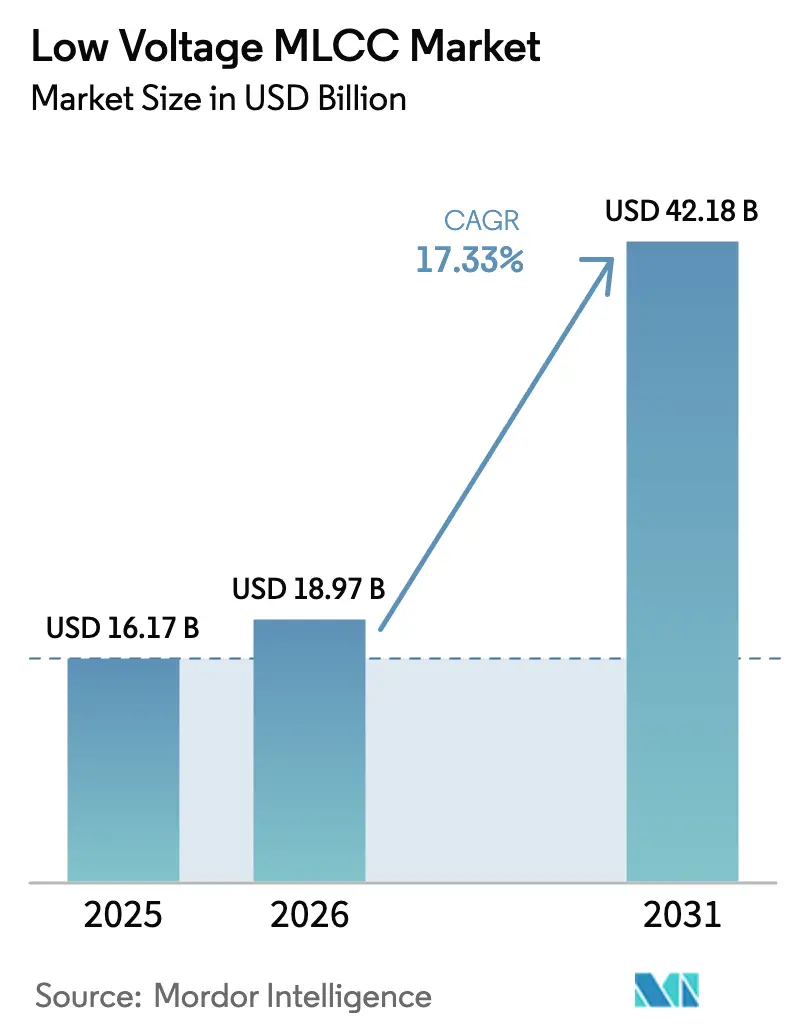
| Market Size (2026) | USD 18.97 Billion |
| Market Size (2031) | USD 42.18 Billion |
| Growth Rate (2026 - 2031) | 17.33% CAGR |
| Fastest Growing Market | North America |
| Largest Market | Asia-Pacific |
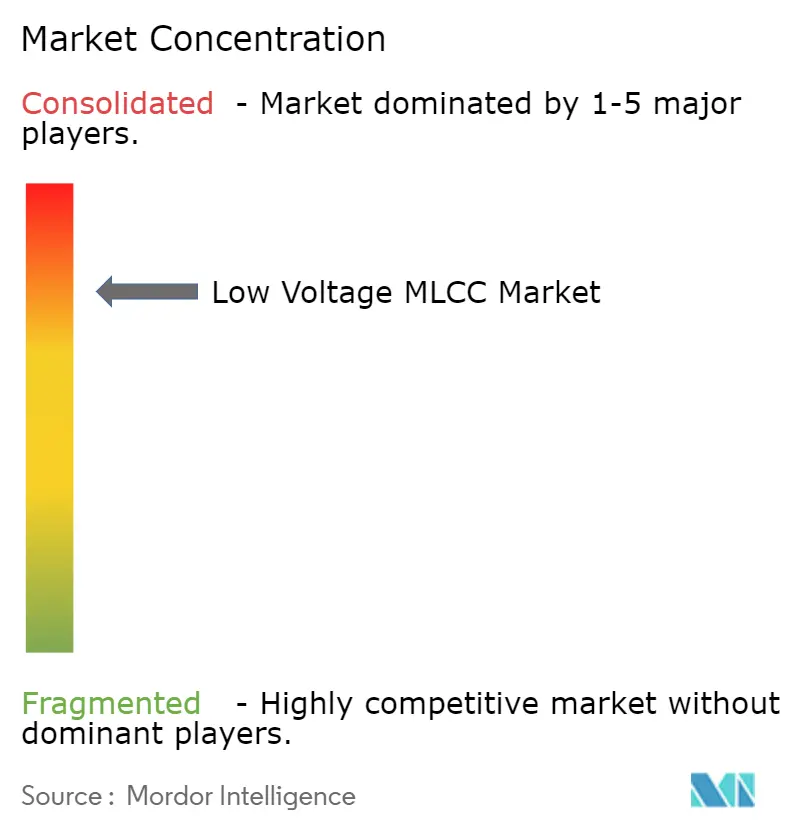
| Market Concentration | Medium |
Major Players*Disclaimer: Major Players sorted in no particular order Image © Mordor Intelligence. Reuse requires attribution under CC BY 4.0. | |
Low Voltage MLCC Market Analysis by Mordor Intelligence
The Low Voltage MLCC Market size was valued at USD 16.17 billion in 2025 and estimated to grow from USD 18.97 billion in 2026 to reach USD 42.18 billion by 2031, at a CAGR of 17.33% during the forecast period (2026-2031). Demand accelerates as 5G handsets, AI servers and electrified vehicles require ultra-compact, low-loss capacitors that can be mounted in ever-tighter spaces while delivering higher capacitance per volume. The Asia-Pacific region retains its manufacturing and consumption lead, but near-shoring and semiconductor stimulus programs are pushing new capacity closer to end customers in North America. Tier-1 manufacturers expand sub-0.3 µm layer technology to sustain miniaturization without sacrificing reliability. Meanwhile, price fluctuations in nickel and palladium complicate cost forecasting, prompting recycling initiatives and innovations in materials. Competitive intensity remains high as the three largest suppliers continue to invest in both brownfield debottlenecking and greenfield plants to shorten lead times and secure long-term automotive and server design slots.
Key Report Takeaways
- By dielectric type, Class 1 captured 61.88% of the Low Voltage MLCC Market share in 2025. By dielectric type, Class 1 products are forecast to log an 18.12% CAGR to 2031.
- By case size, the 201 format accounted for a 55.12% share of the low-voltage MLCC market size in 2025. By case size, the 402 format is on track to post an 17.85% CAGR through 2031.
- By mounting format, surface-mount parts held 40.21% share in 2025 in the Low Voltage MLCC Market, whereas metal-cap/stacked variants register the fastest CAGR at 17.69% thanks to superior vibration tolerance.
- By end-user application, consumer electronics held 50.84% revenue share in 2025 in the Low Voltage MLCC Market; automotive applications are projected to advance at an 18.45% CAGR between 2026-2031.
- By Geography, Asia-Pacific accounted for 57.12% of the Low Voltage MLCC Market size in 2025, while North America is expected to grow at an 17.74% CAGR over the same horizon.
Note: Market size and forecast figures in this report are generated using Mordor Intelligence’s proprietary estimation framework, updated with the latest available data and insights as of 2026.
Global Low Voltage MLCC Market Trends and Insights
Drivers Impact Analysis*
| Driver | (~) % Impact on CAGR Forecast | Geographic Relevance | Impact Timeline |
|---|---|---|---|
| Surge in 5G smartphones and IoT edge devices | +3.2% | Global, with APAC and North America leading | Medium term (2-4 years) |
| Electrification of vehicles driving MLCC/vehicle above 10,000 pcs | +4.1% | Global, with Europe and China acceleration | Long term (≥ 4 years) |
| Miniaturisation trend (0201 and 01005 adoption) in consumer electronics | +2.8% | APAC core, spill-over to North America | Short term (≤ 2 years) |
| Asia-Pacific capacity expansions by Tier-1 suppliers | +2.3% | APAC manufacturing hubs, global supply impact | Medium term (2-4 years) |
| AI servers needing ultra-low-ESR decoupling | +3.7% | North America and Europe data centers | Medium term (2-4 years) |
| Breakthroughs in sub-0.3 μm ceramic layers enabling higher CV | +1.5% | Global technology adoption | Long term (≥ 4 years) |
| Source: Mordor Intelligence | |||


Surge in 5G Smartphones and IoT Edge Devices
Persistent rollout of standalone 5G networks increases the MLCC count in flagship smartphones to nearly 1,000 units, up from 800 in 4G models. Edge gateways need temperature-stable Class 1 capacitors with sub-1 nH ESL to satisfy high-frequency power integrity budgets. Premium pricing follows, rewarding suppliers that master thin-film electrode deposition for millimeter-wave radio modules.[1]Escatec, “Looking under the hood of multi-layer ceramic capacitors,” escatec.com Device OEMs also seek MLCCs qualified for −55 °C to +125 °C cycles so products can operate reliably outdoors. As a result, investments in advanced C0G powders and laser-trimmed termination processes accelerate across leading Japanese and Korean fabs.
Electrification of Vehicles Driving MLCC Content Above 10,000 Pieces
Battery electric cars require between 15,000-20,000 capacitors, dwarfing the 3,000-piece loadout typical of combustion platforms.[2]TDK Corporation, “Q1 FY 2024 Performance Briefing,” tdk.com The switch from 400 V to 800 V drivetrains demands high-voltage MLCCs with reinforced dielectric breakdown strength. AEC-Q200 qualification adds three-year validation cycles, granting pricing power to incumbents. Suppliers with automotive portfolios already cleared for temperatures ranging from −55 °C to +150 °C, such as TDK, expect to see double-digit growth through 2030.[3]Murata Manufacturing, “Murata and QuantumScape start to explore a collaboration for manufacturing of ceramics,” corporate.murata.com
Miniaturization Trend Accelerating 0201 and 01005 Adoption
Relentless form-factor pressure in wearables and hearables pushes demand for 0201 (0.6 mm × 0.3 mm) and even 01005 (0.4 mm × 0.2 mm) parts. Producing these sizes necessitates semiconductor-class cleanrooms and in-line X-ray inspection to control defect density. Ceramic layers have thinned below 0.5 µm, nearing material permittivity limits and forcing experimentation with new dopants that stabilize grain growth. Height-restricted system-in-package modules also require less than or equal to 0.2 mm profiles, prompting innovations in bottom-termination geometries and low-alpha solders.
AI Servers Requiring Ultra-Low-ESR Decoupling Solutions
High-density GPU trays draw step currents above 1,000 A and need voltage settling within ±1%. That forces decoupling networks built from thousands of MLCCs exhibiting less than 0.1 mΩ ESR at several hundred kilohertz. Chiplet architectures further distribute capacitance, increasing per-server demand. Reliability expectations rise as data-center operators target server uptimes above 99.999%. Hence, suppliers focus on thermo-mechanical robustness, adopting copper-alloy terminations that curb solder joint fatigue during rapid thermal cycling.
Restraints Impact Analysis*
| Restraint | (~) % Impact on CAGR Forecast | Geographic Relevance | Impact Timeline |
|---|---|---|---|
| Price volatility of nickel and palladium upstream | -2.1% | Global supply chains, Asia-Pacific manufacturing | Short term (≤ 2 years) |
| Prolonged supply-chain lead times and allocation risk | -1.8% | Global, with North America and Europe most affected | Medium term (2-4 years) |
| Sustainability pressure on BaTiO3 mining and processing | -1.2% | Global, with stricter enforcement in Europe and North America | Long term (≥ 4 years) |
| Nanoparticle agglomeration limiting further layer stacking | -0.9% | Global technology development, APAC manufacturing impact | Long term (≥ 4 years) |
| Source: Mordor Intelligence | |||
Price Volatility of Nickel and Palladium Upstream
Nickel and palladium account for nearly half of MLCC material cost, and both metals experienced double-digit price swings in 2024-2025 due to geopolitical tensions. Spot volatility compresses gross margins unless suppliers hedge or shift to recycled feedstock. Recovery volumes from electronic waste are set to hit 3.5 million oz by 2027, up 52% from 2022, providing partial relief. R&D programs explore nickel-free internal electrodes but have yet to meet conductivity targets for high-CV parts.
Prolonged Supply-Chain Lead Times and Allocation Risk
Lead times for high-reliability MLCCs lengthened past 26 weeks in 2025, reflecting a multi-year capacity gap. New fabrication lines need 12-18 months to install and qualify, so shortages persist even as fabs break ground in Mexico and the Philippines. Allocation favors automotive and server customers under volume-commit agreements, forcing smaller OEMs to redesign boards or carry excess inventory. Diversified footprints in North America and Eastern Europe gradually emerge to counter single-region exposure.
*Our forecasts treat driver/restraint impacts as directional, not additive. The impact forecasts reflect baseline growth, mix effects, and variable interactions.
Segment Analysis
By Dielectric Type: Class 1 Stability Drives Precision Electronics
Class 1 dielectrics held 61.88% of the Low Voltage MLCC Market share in 2025 as designers prioritized temperature-coefficient stability for RF filters, timing circuits and high-Q resonators. The segment is forecast to compound at a 18.12% annual growth rate through 2031, reflecting adoption in 5G radio heads, autonomous driving sensors, and industrial IoT gateways. AEC-Q200-qualified C0G parts command price premiums triple those of general-purpose X7R products. Research into Ho-doped ceramics shows promise in enhancing permittivity while maintaining a near-zero drift across the temperature range of −55 °C to +125 °C.
Class 2 units offer higher volumetric efficiency but lose share in precision workloads due to dielectric relaxation at elevated bias. Suppliers nevertheless target Class 2 for space-constrained wearables, where a smaller footprint outweighs capacitance change. Continuous innovation in thin-film deposition and defect-mapping analytics reduces early-life failures, cementing Class 1 as the benchmark for mission-critical electronics that cannot tolerate impedance drift.


By Case Size: 402 Format Gains in High-Power Designs
The 201 footprint remained the workhorse in 2025 with 55.12% market share, balancing automated placement yields with board real estate savings. Yet the 402 variant is on pace for an 17.85% CAGR to 2031, buoyed by higher capacitance density and better thermal dissipation demanded in EV traction inverters and industrial drives. Automakers prefer larger bodies to mitigate board flexing and to simplify solder fillet inspection under IPC-610 Class 3 rules, supporting the Low Voltage MLCC Market shift toward ruggedized formats.
Manufacturing the 01005 class requires optical-glass masks and sub-15 µm screen-print alignment, limiting production to a handful of high-precision fabs. Conversely, 603 and 1005 parts stay relevant in power distribution networks where ripple current ratings, not size, dictate component selection. Overall, case-size diversity underpins supplier strategy, enabling high-mix portfolios that serve both smartphone OEMs and harsh-duty industrial integrators.
By MLCC Mounting Type: Metal-Cap Assemblies Accelerate
Surface-mount configurations captured 40.21% of 2025 revenues thanks to SMT line ubiquity in smartphones and laptops. Nonetheless, metal-cap packages will outpace the field with an 17.69% CAGR as they dissipate heat more efficiently in 800 V EV buses. Copper-flange terminations spread joule heat and counteract board-level vibration, tailoring them to under-hood environments.
Radial-lead and stacked packages persist in high-voltage grid gear, where creepage requirements dictate larger pin-to-pin spacing. Surface-mount technology continues to innovate via sintered-silver attach and epoxy-reinforced fillets that raise thermal cycle endurance. Hybrid board stacks combine metal-cap MLCCs close to hot power devices with low-profile 0201 parts under shielding cans, a configuration that optimizes both electrical and mechanical performance.

By End-User Application: Automotive Takes Growth Crown
Consumer electronics represented 50.84% of 2025 sales, underpinned by the annual refresh of handsets and tablets. Yet, automotive lines will clock an 18.45% CAGR to 2031, elevating their share of the Low Voltage MLCC Market as EV penetration increases. Each battery module incorporates high-voltage snubber networks, while Advanced Driver Assistance Systems add hundreds of high-reliability decouplers per control unit.
Industrial automation follows closely, leveraging predictive maintenance sensors and motor-drive upgrades. Telecommunications infrastructure sustains long-cycle demand with 5G massive-MIMO radios that rely on Class 1 capacitors for phase-array calibration. Emerging applications in medical implants and aerospace command the highest ASPs because devices can neither fail nor be easily serviced, favoring suppliers certified under ISO 13485 and AS9100.
Geography Analysis
Asia-Pacific generated 57.12% of 2025 shipments as China, Japan, and South Korea maintained dense clusters of MLCC fabs, ceramic powder mills, and EMS board assemblers. The region also houses the largest smartphone and PC assembly bases, securing local pull-through for passive components. Governments continue to subsidize facility upgrades in order to protect strategic electronics supply chains, cushioning the Low Voltage MLCC Market against currency and logistics shocks.
North America is projected to deliver an 17.74% CAGR through 2031, as CHIPS Act incentives, coupled with corporate near-shoring strategies, foster the development of new capacitor lines in Mexico and the United States. Auto OEMs in Michigan and battery plants in the Southeastern corridor secure shorter supply chains for AEC-Q200 parts, reducing in-transit inventory and tariff exposure. Multiple Tier-1 vendors have already allotted capex for brown-field conversions to serve this captive demand.
Europe remains the center of premium automotive electronics, leveraging stringent CO₂ and safety mandates that stimulate the development of advanced power-train control units loaded with MLCC content. Market share gains are steady rather than spectacular, reflecting slower smartphone churn and limited indigenous fab capacity. Nevertheless, the region’s focus on circular-economy directives drives higher rates of capacitor recycling and RoHS compliance, traits that appeal to ESG-oriented investors.
The Rest-of-World cluster, dominated by Southeast Asia and Latin America, benefits from rising contract-manufacturing footprints. Vietnam and Thailand assemble mid-range smartphones and home appliances, guaranteeing baseline MLCC consumption. Brazil’s push into telecom network equipment also underpins incremental orders. Although currency volatility and political risk still deter large capex, regional governments pitch tax incentives that could tip future fab-site selections.


Competitive Landscape
Murata, Samsung Electro-Mechanics and TDK jointly held a significant share of the 2024 Low Voltage MLCC Market. Each maintains proprietary ceramic powders, vertically integrated electrode plating and multi-site qualification footprints that deter new entrants. All three ramp sub-0.3 µm dielectric stacks, aiming for above 30 µF in 0603 packages. Murata partnered with QuantumScape to adapt thin ceramic films for solid-state batteries, underscoring strategic diversification.
Chinese challengers such as Guangdong Viiyong push commodity X5R and X7R devices at aggressive price points, capturing share in white goods and low-tier handsets. They funnel state incentives into 0201 lines but still trail leaders on automotive and aerospace reliability credentials. Taiwanese group Yageo deepens its portfolio through acquisitions of Anpec and Shibaura, knitting IC power-management and sensor know-how into passives-centric platforms.
Strategic moves in 2025 revolve around footprint expansion and material self-sufficiency. Samsung Electro-Mechanics commissioned new Philippines capacity targeting 1 trillion KRW in automotive MLCC revenues. TDK earmarked 30% of its three-year capex for passive-component scale-ups, prioritizing AI data-center decoupling and EV inverters. Meanwhile, niche U.S. suppliers such as Quantic Electronics focus on MIL-STD-790 certified parts for space and defense, insulating them from mainstream price wars.
Low Voltage MLCC Industry Leaders
Taiyo Yuden Co., Ltd
TDK Corporation
Walsin Technology Corporation
Murata Manufacturing Co., Ltd.
Samsung Electro-Mechanics Co., Ltd.
- *Disclaimer: Major Players sorted in no particular order

Recent Industry Developments
- September 2025: Yageo launched a NTD 4.8 billion offer for up to 28.5% of Anpec to bolster analog power IC depth.
- September 2025: Yageo secured Shibaura board support for its JPY 7,130-per-share takeover proposal.
- August 2025: Samsung Electro-Mechanics executives inspected its Calamba, Philippines plant as automotive-grade MLCC lines ramp.
- April 2025: Murata and QuantumScape began collaborating on high-volume production of ceramic films for solid-state batteries.


Global Low Voltage MLCC Market Report Scope
The Low Voltage MLCC Market Report is Segmented by Dielectric Type (Class 1, Class 2), Case Size (201, 402, 603, 1005, 1210, Other Case Sizes), Mounting Type (Surface Mount, Radial Lead, Metal Cap), End-User Application (Aerospace and Defence, Automotive, Consumer Electronics, Industrial, Medical Devices, Power and Utilities, Telecommunication, Other End-User Applications), and Geography. The Market Forecasts are Provided in Terms of Value (USD).
| Class 1 |
| Class 2 |
| 201 |
| 402 |
| 603 |
| 1005 |
| 1210 |
| Other Case Sizes |
| Metal Cap |
| Radial Lead |
| Surface Mount |
| Aerospace and Defence |
| Automotive |
| Consumer Electronics |
| Industrial |
| Medical Devices |
| Power and Utilities |
| Telecommunication |
| Other End-User Applications |
| North America | United States |
| Rest of North America | |
| Europe | Germany |
| United Kingdom | |
| Rest of Europe | |
| Asia-Pacific | China |
| India | |
| Japan | |
| South Korea | |
| Rest of Asia-Pacific | |
| Rest of the World |
| By Dielectric Type | Class 1 | |
| Class 2 | ||
| By Case Size | 201 | |
| 402 | ||
| 603 | ||
| 1005 | ||
| 1210 | ||
| Other Case Sizes | ||
| By MLCC Mounting Type | Metal Cap | |
| Radial Lead | ||
| Surface Mount | ||
| By End-User Application | Aerospace and Defence | |
| Automotive | ||
| Consumer Electronics | ||
| Industrial | ||
| Medical Devices | ||
| Power and Utilities | ||
| Telecommunication | ||
| Other End-User Applications | ||
| By Geography | North America | United States |
| Rest of North America | ||
| Europe | Germany | |
| United Kingdom | ||
| Rest of Europe | ||
| Asia-Pacific | China | |
| India | ||
| Japan | ||
| South Korea | ||
| Rest of Asia-Pacific | ||
| Rest of the World | ||


Market Definition
- MLCC (Multilayer Ceramic Capacitor) - A type of capacitor that consists of multiple layers of ceramic material, alternating with conductive layers, used for energy storage and filtering in electronic circuits.
- Voltage - The maximum voltage that a capacitor can safely withstand without experiencing breakdown or failure. It is typically expressed in volts (V)
- Capacitance - The measure of a capacitor's ability to store electrical charge, expressed in farads (F). It determines the amount of energy that can be stored in the capacitor
- Case Size - The physical dimensions of an MLCC, typically expressed in codes or millimeters, indicating its length, width, and height
| Keyword | Definition |
|---|---|
| MLCC (Multilayer Ceramic Capacitor) | A type of capacitor that consists of multiple layers of ceramic material, alternating with conductive layers, used for energy storage and filtering in electronic circuits. |
| Capacitance | The measure of a capacitor's ability to store electrical charge, expressed in farads (F). It determines the amount of energy that can be stored in the capacitor |
| Voltage Rating | The maximum voltage that a capacitor can safely withstand without experiencing breakdown or failure. It is typically expressed in volts (V) |
| ESR (Equivalent Series Resistance) | The total resistance of a capacitor, including its internal resistance and parasitic resistances. It affects the capacitor's ability to filter high-frequency noise and maintain stability in a circuit. |
| Dielectric Material | The insulating material used between the conductive layers of a capacitor. In MLCCs, commonly used dielectric materials include ceramic materials like barium titanate and ferroelectric materials |
| SMT (Surface Mount Technology) | A method of electronic component assembly that involves mounting components directly onto the surface of a printed circuit board (PCB) instead of through-hole mounting. |
| Solderability | The ability of a component, such as an MLCC, to form a reliable and durable solder joint when subjected to soldering processes. Good solderability is crucial for proper assembly and functionality of MLCCs on PCBs. |
| RoHS (Restriction of Hazardous Substances) | A directive that restricts the use of certain hazardous materials, such as lead, mercury, and cadmium, in electrical and electronic equipment. Compliance with RoHS is essential for automotive MLCCs due to environmental regulations |
| Case Size | The physical dimensions of an MLCC, typically expressed in codes or millimeters, indicating its length, width, and height |
| Flex Cracking | A phenomenon where MLCCs can develop cracks or fractures due to mechanical stress caused by bending or flexing of the PCB. Flex cracking can lead to electrical failures and should be avoided during PCB assembly and handling. |
| Aging | MLCCs can experience changes in their electrical properties over time due to factors like temperature, humidity, and applied voltage. Aging refers to the gradual alteration of MLCC characteristics, which can impact the performance of electronic circuits. |
| ASPs (Average Selling Prices) | The average price at which MLCCs are sold in the market, expressed in USD million. It reflects the average price per unit |
| Voltage | The electrical potential difference across an MLCC, often categorized into low-range voltage, mid-range voltage, and high-range voltage, indicating different voltage levels |
| MLCC RoHS Compliance | Compliance with the Restriction of Hazardous Substances (RoHS) directive, which restricts the use of certain hazardous substances, such as lead, mercury, cadmium, and others, in the manufacturing of MLCCs, promoting environmental protection and safety |
| Mounting Type | The method used to attach MLCCs to a circuit board, such as surface mount, metal cap, and radial lead, which indicates the different mounting configurations |
| Dielectric Type | The type of dielectric material used in MLCCs, often categorized into Class 1 and Class 2, representing different dielectric characteristics and performance |
| Low-Range Voltage | MLCCs designed for applications that require lower voltage levels, typically in the low voltage range |
| Mid-Range Voltage | MLCCs designed for applications that require moderate voltage levels, typically in the middle range of voltage requirements |
| High-Range Voltage | MLCCs designed for applications that require higher voltage levels, typically in the high voltage range |
| Low-Range Capacitance | MLCCs with lower capacitance values, suitable for applications that require smaller energy storage |
| Mid-Range Capacitance | MLCCs with moderate capacitance values, suitable for applications that require intermediate energy storage |
| High-Range Capacitance | MLCCs with higher capacitance values, suitable for applications that require larger energy storage |
| Surface Mount | MLCCs designed for direct surface mounting onto a printed circuit board (PCB), allowing for efficient space utilization and automated assembly |
| Class 1 Dielectric | MLCCs with Class 1 dielectric material, characterized by a high level of stability, low dissipation factor, and low capacitance change over temperature. They are suitable for applications requiring precise capacitance values and stability |
| Class 2 Dielectric | MLCCs with Class 2 dielectric material, characterized by a high capacitance value, high volumetric efficiency, and moderate stability. They are suitable for applications that require higher capacitance values and are less sensitive to capacitance changes over temperature |
| RF (Radio Frequency) | It refers to the range of electromagnetic frequencies used in wireless communication and other applications, typically from 3 kHz to 300 GHz, enabling the transmission and reception of radio signals for various wireless devices and systems. |
| Metal Cap | A protective metal cover used in certain MLCCs (Multilayer Ceramic Capacitors) to enhance durability and shield against external factors like moisture and mechanical stress |
| Radial Lead | A terminal configuration in specific MLCCs where electrical leads extend radially from the ceramic body, facilitating easy insertion and soldering in through-hole mounting applications. |
| Temperature Stability | The ability of MLCCs to maintain their capacitance values and performance characteristics across a range of temperatures, ensuring reliable operation in varying environmental conditions. |
| Low ESR (Equivalent Series Resistance) | MLCCs with low ESR values have minimal resistance to the flow of AC signals, allowing for efficient energy transfer and reduced power losses in high-frequency applications. |


Research Methodology
Mordor Intelligence has followed the following methodology in all our MLCC reports.
- Step 1: Identify Data Points: In this step, we identified key data points crucial for comprehending the MLCC market. This included historical and current production figures, as well as critical device metrics such as attachment rate, sales, production volume, and average selling price. Additionally, we estimated future production volumes and attachment rates for MLCCs in each device category. Lead times were also determined, aiding in forecasting market dynamics by understanding the time required for production and delivery, thereby enhancing the accuracy of our projections.
- Step 2: Identify Key Variables: In this step, we focused on identifying crucial variables essential for constructing a robust forecasting model for the MLCC market. These variables include lead times, trends in raw material prices used in MLCC manufacturing, automotive sales data, consumer electronics sales figures, and electric vehicle (EV) sales statistics. Through an iterative process, we determined the necessary variables for accurate market forecasting and proceeded to develop the forecasting model based on these identified variables.
- Step 3: Build a Market Model: In this step, we utilized production data and key industry trend variables, such as average pricing, attachment rate, and forecasted production data, to construct a comprehensive market estimation model. By integrating these critical variables, we developed a robust framework for accurately forecasting market trends and dynamics, thereby facilitating informed decision-making within the MLCC market landscape.
- Step 4: Validate and Finalize: In this crucial step, all market numbers and variables derived through an internal mathematical model were validated through an extensive network of primary research experts from all the markets studied. The respondents are selected across levels and functions to generate a holistic picture of the market studied.
- Step 5: Research Outputs: Syndicated Reports, Custom Consulting Assignments, Databases, and Subscription Platform


