High Voltage MLCC Market Size and Share
Market Overview
| Study Period | 2020 - 2031 |
|---|---|
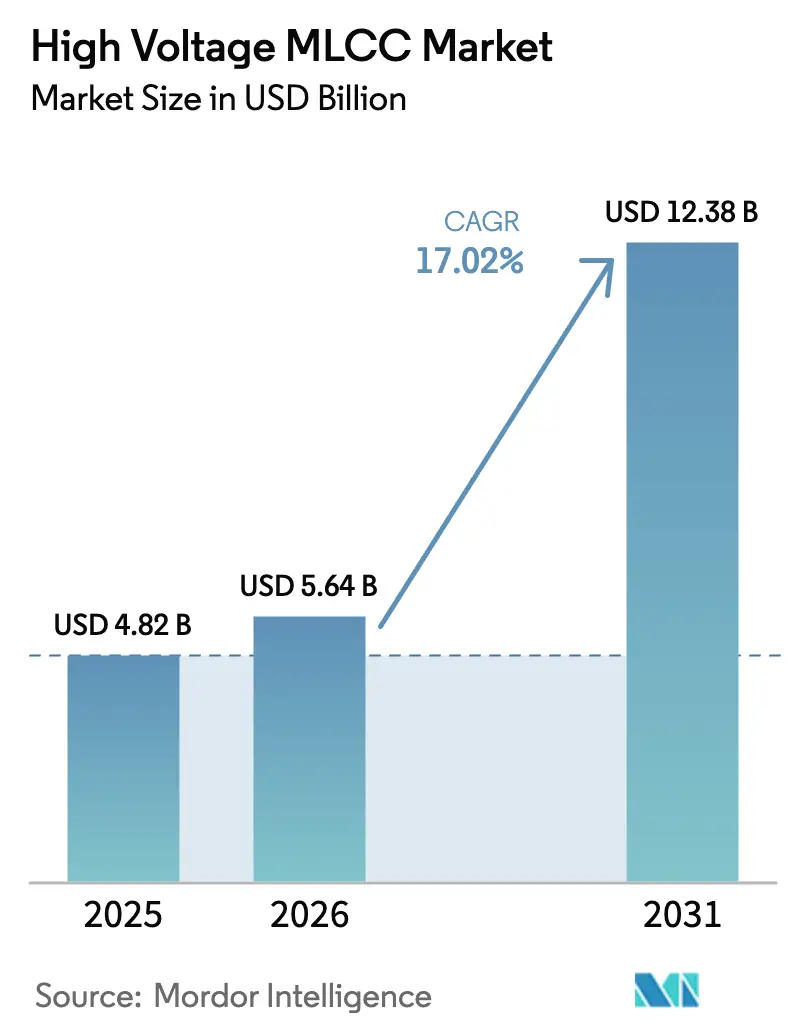
| Market Size (2026) | USD 5.64 Billion |
| Market Size (2031) | USD 12.38 Billion |
| Growth Rate (2026 - 2031) | 17.02% CAGR |
| Fastest Growing Market | Asia Pacific |
| Largest Market | North America |
| Market Concentration | High |
Major Players*Disclaimer: Major Players sorted in no particular order Image © Mordor Intelligence. Reuse requires attribution under CC BY 4.0. | |
High Voltage MLCC Market Analysis by Mordor Intelligence
High Voltage MLCC market size in 2026 is estimated at USD 5.64 billion, growing from 2025 value of USD 4.82 billion with 2031 projections showing USD 12.38 billion, growing at 17.02% CAGR over 2026-2031. Rising electrification of vehicle powertrains, dense 5G roll-outs, and AI-edge servers drive sustained demand for compact, high-reliability capacitors that tolerate 800 V+ operating environments. Suppliers are pushing dielectric layers below 0.5 µm without sacrificing breakdown strength, enabling higher capacitance in the same footprint. Regional supply chains continue to shift, with U.S. incentives supporting local capacity and Europe tightening automotive CO₂ rules that favor electric platforms. Cost pressure from nickel and palladium volatility remains a headwind, but multilayer designs using base-metal electrodes are easing material exposure while preserving performance.
Key Report Takeaways
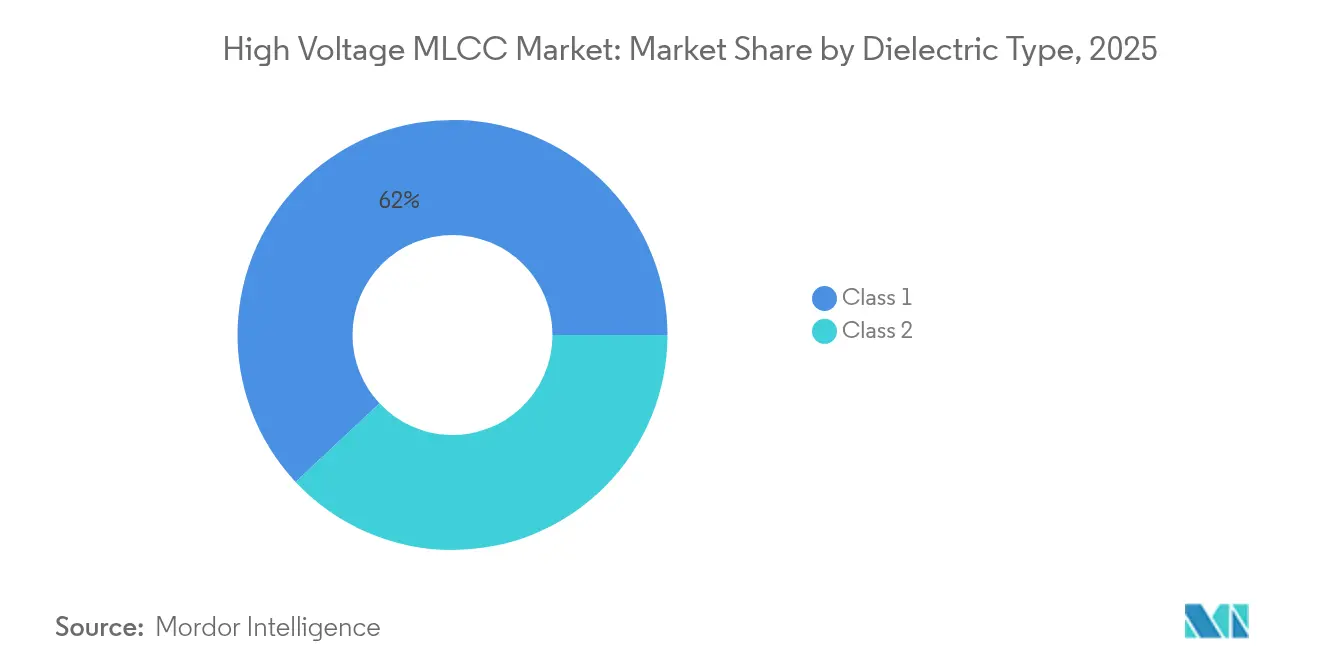
- By dielectric type, Class 1 accounted for 61.98% revenue in 2025 in the High Voltage MLCC market; Class 1 is forecast to expand at an 18.12% CAGR through 2031.
- By case size, 201 held 55.32% of the High Voltage MLCC market share in 2025; 402 is projected to register the fastest 18.05% CAGR to 2031.
- By mounting type, surface-mount devices led with 40.21% revenue in 2025 in the High Voltage MLCC market, while metal-cap variants will rise at an 18.03% CAGR to 2031.
- By end-user application, consumer electronics captured 50.88% sales in 2025 in the High Voltage MLCC market; automotive applications are set to log an 18.42% CAGR through 2031.
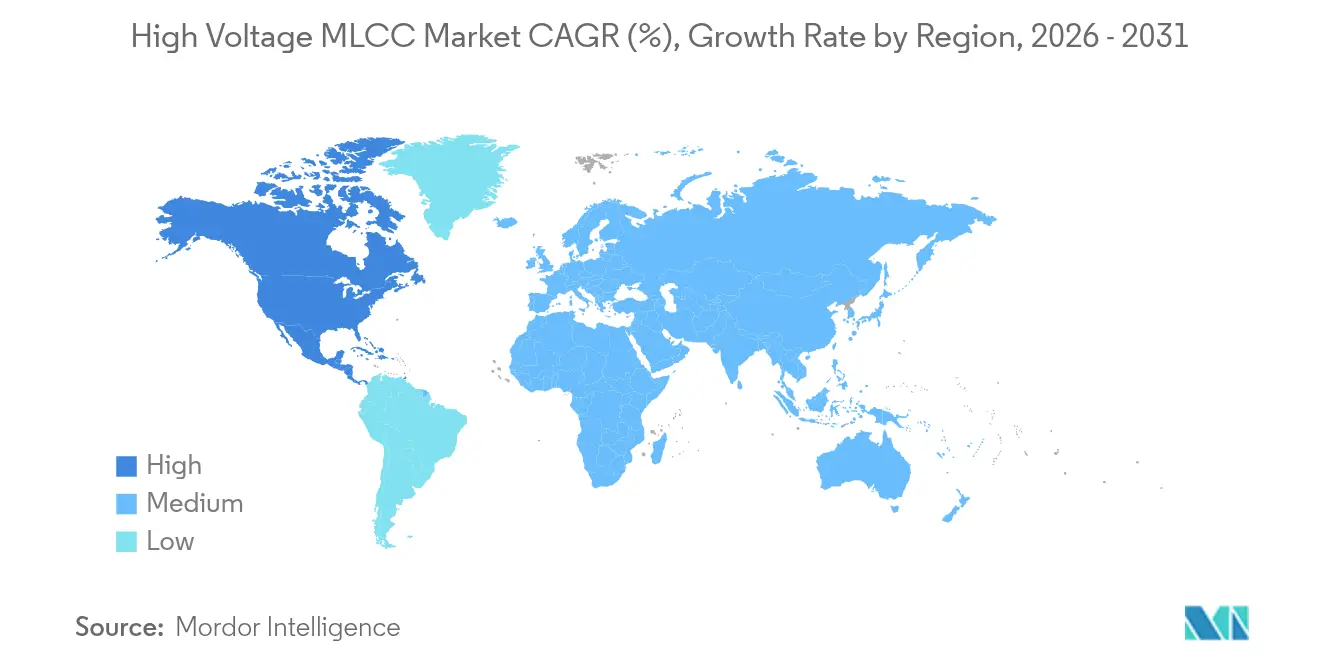
- By geography, Asia-Pacific commanded 57.11% revenue in 2025 in the High Voltage MLCC market; North America is poised for the quickest 18.06% CAGR between 2026 and 2031.
Note: Market size and forecast figures in this report are generated using Mordor Intelligence’s proprietary estimation framework, updated with the latest available data and insights as of 2026.
Global High Voltage MLCC Market Trends and Insights
Drivers Impact Analysis*
| Driver | (~) % Impact on CAGR Forecast | Geographic Relevance | Impact Timeline |
|---|---|---|---|
| EV power-train electrification surge | +4.2% | Global, with early gains in China, Europe, North America | Medium term (2-4 years) |
| 5G and AI-edge infrastructure roll-out | +3.8% | APAC core, spill-over to North America and Europe | Short term (≤ 2 years) |
| ADAS/autonomy MLCC content lift-off | +3.1% | North America and EU, expanding to Asia-Pacific | Medium term (2-4 years) |
| Miniaturised high-density consumer electronics | +2.7% | Global | Short term (≤ 2 years) |
| Grid-scale renewable inverters adoption | +2.4% | Europe, North America, with growth in Asia-Pacific | Long term (≥ 4 years) |
| Aerospace electrification (eVTOL, MEA) | +1.1% | North America and EU | Long term (≥ 4 years) |
| Source: Mordor Intelligence | |||


EV Power-train Electrification Surge
Higher-voltage 800 V architectures in premium electric cars cut charging time and cable mass, lifting demand for MLCCs rated at 1 kV and above for DC-link filtering. Silicon-carbide inverters operating past 100 kHz need capacitors with low equivalent series resistance and stable capacitance under fast dV/dt switching. Automotive AEC-Q200 mandates 2,000-hour life tests at 125 °C, limiting entry to suppliers with sophisticated automotive-grade lines. Each battery electric vehicle typically uses over twice as many MLCCs as an internal-combustion model, and advanced driver assistance systems add further content. Japanese and Korean vendors with deep process control benefit from early design wins, while Chinese newcomers accelerate capacity to capture late-cycle volume.[1]Murata Manufacturing, “Next-Generation Multilayer Ceramic Capacitors,” murata.com
5G and AI-edge Infrastructure Roll-out
Massive MIMO base stations and millimeter-wave power amplifiers require MLCCs that maintain capacitance under DC bias to ensure signal fidelity. Hyperscale data centers moving to 800 V DC distribution lower copper losses but impose stringent thermal cycling on board-mounted passives. Liquid immersion and cold-plate cooling expose devices to higher moisture and mechanical stress, favoring Class 1 dielectrics with tight temperature coefficients.[2]TDK Corporation, “Investor Day 2024 Speech,” tdk.com Edge nodes in factories and vehicles need −40 °C – +125 °C performance and electromagnetic compliance, sustaining medium-volume, high-value demand.
ADAS/Autonomy MLCC Content Lift-off
Level 3+ driving functions integrate multiple radar, LiDAR, and vision sensors, each with dedicated power domains that rely on stable decoupling networks. 77 GHz radar front-ends call for capacitors with low loss tangent at microwave frequencies, steering procurement toward specialty Class 1 formulations. Functional safety standards such as ISO 26262 mandate redundancy, raising MLCC counts per ECU. Semiconductor shortages in 2024 highlighted how missing MLCCs can idle whole vehicle lines, prompting automakers to qualify secondary sources and carry higher safety stocks.
Miniaturized High-Density Consumer Electronics
Foldable phones and ultra-thin laptops push component thickness below 0.4 mm while demanding higher capacitance per footprint. Stress from board flexing and drop tests necessitates mechanically robust electrode designs. Wearables seek ultra-low leakage to extend battery life, whereas gaming laptops employ dynamic power scaling that needs low-ESR capacitors to tame transient currents.[3]Murata Manufacturing, “Next-Generation Multilayer Ceramic Capacitors,” murata.com Flexible substrates encourage embedded MLCC concepts that eliminate discrete placement altogether.
Restraints Impact Analysis*
| Restraint | (~) % Impact on CAGR Forecast | Geographic Relevance | Impact Timeline |
|---|---|---|---|
| Raw-material price volatility (Ni, Ag, Pd) | -2.8% | Global | Short term (≤ 2 years) |
| Prolonged supply-demand lead-time imbalance | -2.1% | Global, with acute impact in North America and Europe | Medium term (2-4 years) |
| Reliability barriers beyond 1 kV miniaturised parts | -1.7% | Global, particularly affecting automotive and aerospace applications | Long term (≥ 4 years) |
| Stringent AEC-Q200 qualification hurdles | -1.4% | Global automotive markets, with emphasis on North America and Europe | Medium term (2-4 years) |
| Source: Mordor Intelligence | |||
Raw-Material Price Volatility (Ni, Ag, Pd)
Nickel and palladium cost swings directly influence 40-60% of MLCC bill-of-materials. Electric-vehicle battery demand, trade policy shifts, and geopolitical events tightened nickel supply in 2024, lifting spot prices above historical averages. Manufacturers accelerated base-metal electrode adoption to substitute precious metals but required controlled-atmosphere sintering ovens that raised capital spend. Silver migration under high humidity remains a reliability concern at voltages over 500 V, keeping nickel as the preferred electrode for high-voltage parts despite processing complexity.
Prolonged Supply-Demand Lead-Time Imbalance
High-voltage MLCCs often carry 16-24-week lead times because defect-free yield drops sharply as dielectric stacks exceed 500 layers. Automotive customers need year-long qualification and audits, delaying onboarding of alternative suppliers. Capacity is concentrated in Japan, Korea, and China; regional disruptions such as factory shutdowns trimmed global output by an estimated mid-teens percentage in 2024. Building a new MLCC fab or converting a line can take 12-18 months, out of sync with 3-6-month demand cycles, sustaining tightness and supporting premium pricing.
*Our forecasts treat driver/restraint impacts as directional, not additive. The impact forecasts reflect baseline growth, mix effects, and variable interactions.
Segment Analysis
By Dielectric Type: Class 1 Supremacy Anchored in Voltage Stability
Class 1 materials captured 61.98% of 2025 revenue as designers prize their ±30 ppm/°C stability and minimal DC-bias capacitance loss. The High Voltage MLCC market size for Class 1 products is set to climb briskly, supported by DC-link filters in 800 V inverters and renewable energy power stacks. Manufacturers continue grain-size engineering to lift permittivity without eroding breakdown strength, while loss-tangent optimization keeps dissipation below 0.001 at MHz frequencies.
Class 2 alternatives remain attractive where volumetric efficiency outweighs strict stability, notably in smartphones and telecom. Lead-free antiferroelectric chemistries promise dielectric constants above 2,000 but face scale-up hurdles. Hybrid dielectric stacks that blend Class 1 surface layers with Class 2 cores are being prototyped to combine stability and capacitance, potentially reshaping segment boundaries over the forecast horizon.


By Case Size: 201 Retains Leadership Amid Gradual Downsizing
The 201 outline held a 55.32% share in 2025, balancing dielectric thickness, thermal dissipation, and automated-placement yields. Its footprint matches legacy board layouts in power supplies and traction inverters, sustaining steady volume. The 402 format, though physically larger, exhibits the fastest 18.05% CAGR as engineers pack more power stages into compact automotive traction modules.
Sub-1 mm-thick formats such as 0603 cater to space-restricted consumer devices but hit voltage ceilings near 200 V. Embedded capacitor solutions inside package substrates may eventually erode discrete case sizes, yet high-voltage reliability screening keeps board-mounted 201/402 parts dominant through 2030. Yield economics also favor larger chips, as sub-5 µm registration errors disproportionally affect narrow bodies.
By MLCC Mounting Type: Surface-Mount Prevalence with Metal-Cap Momentum
Surface-mount devices represented 40.21% revenue in 2025 thanks to universal pick-and-place compatibility and reduced assembly cost. The High Voltage MLCC market size for metal-cap configurations is rising at an 18.03% CAGR as power stages shift to higher continuous currents where better thermal and mechanical coupling proves valuable.
Radial-lead parts persist in aerospace and defense owing to repairability and vibration tolerance. Emerging wafer-level embedded capacitors bypass discrete soldering entirely, offering sub-nH inductance for GaN power ICs. Such integration may realign the mounting-type mix beyond 2030 as board real estate becomes more constrained.

By End-User Application: Consumer Electronics Scale vs. Automotive Velocity
Consumer electronics generated 50.88% of 2025 revenue, anchored by handset and laptop production hubs in East Asia. Foldable displays, fast-charging protocols, and high-refresh-rate gaming phones uphold sizable volumes even as unit growth moderates. The automotive segment, however, is on track for an 18.42% CAGR through 2031 as EV penetration accelerates and ADAS tiers up.
Industrial automation, renewables, and telecom infrastructure round out diversified demand. Grid-connected inverters, factory drives, and small-cell radios each specify high-voltage MLCCs to filter switching noise and smooth power rails. Medical implantables and space avionics, though low volume, command premium pricing because of harsh-environment validation costs and traceability demands.
Geography Analysis
Asia-Pacific accounted for 57.11% of High Voltage MLCC market revenue in 2025, driven by integrated ceramic powder, electrode paste, and assembly ecosystems concentrated in Japan, South Korea, and China. Japan alone houses roughly 40% of global MLCC output capacity and continues to invest in sub-micron dielectric deposition tools and precision screen printing. South Korean conglomerates pair capacitors with in-house semiconductor and module lines, shortening design loops and accelerating time-to-market for next-generation powertrains. Chinese entrants benefit from government incentives and growing domestic EV demand, but many still rely on imported sintering equipment and high-purity powders sourced from Japanese suppliers.
North America is the fastest-growing region, projected to clock an 18.06% CAGR during 2026-2031. Federal incentives under the CHIPS and Inflation Reduction Acts aim to repatriate critical components, including high-voltage passives. Expansion of battery-electric vehicle assembly plants across the Midwest and Southeast directly translates into local sourcing commitments. Hyperscale data centers clustering in Virginia, Ohio, and Texas specify large volumes of automotive-grade MLCCs for rectifiers, battery backup units, and AI accelerator boards. Defense programs underscore secure supply-chain mandates, creating an addressable niche for U.S.-based niche producers.
Europe’s growth is steadier but underpinned by stringent emissions regulations and renewable energy targets. German, French, and Scandinavian automakers shift to 800 V architectures, spurring local demand for high-voltage passives qualified to ISO 26262. Utility firms investing in offshore wind and photovoltaic megaprojects rely on MLCC-equipped inverters that must pass extended damp-heat endurance tests. Eastern European contract manufacturers assemble telecom radio heads that integrate high-frequency capacitors, adding incremental volume.
The Rest of the World, Latin America, the Middle East, and Africa, remains nascent but promising. Emerging solar parks in Chile and Saudi Arabia require rugged power-conversion hardware. Rapid 5G roll-outs in Gulf states and smart-city pilots in Africa could broaden demand as supply chains mature.

Competitive Landscape
Top Companies in High Voltage MLCC Market
The High Voltage MLCC market is highly concentrated: the top five suppliers command close to 70% of global capacity, affording them significant pricing leverage and early engagement with Tier-1 automotive and industrial customers. Japanese leaders sustain an edge through proprietary dielectric chemistries and precision layering techniques that achieve sub-0.5 µm thickness without field-induced failures. Their long-standing zero-defect cultures align with stringent automotive and aerospace qualification, erecting barriers for latecomers.
Competitive tension is rising as Chinese firms transition from commodity 50 V parts to 1 kV-rated products, supported by state funding and aggressive capital expenditure. Price erosion in consumer segments pressures incumbents, prompting strategic shifts toward higher-value automotive and industrial niches. Recent capacity additions in Vietnam and the Philippines diversify geographic risk and tap lower labor costs while keeping proximity to assembly hubs.
Technology racehorses include dielectric layer thinning, base-metal electrode penetration, and integrated package capacitors. Murata is scaling vacuum-deposited ultra-thin dielectrics for next-gen EV inverters. TDK earmarked nearly one-third of its 2025-2027 capex for passive components, aiming at above 15% return on invested capital. KEMET and Kyocera AVX have launched 1 kV automotive-qualified series targeting renewable inverters and motor drives. Start-ups specializing in embedded capacitors within organic substrates or molded power modules threaten to bypass discrete MLCCs in certain high-frequency designs.
High Voltage MLCC Industry Leaders
Kyocera AVX Components Corporation (Kyocera Corporation)
Taiyo Yuden Co., Ltd
Yageo Corporation
Murata Manufacturing Co., Ltd.
Samsung Electro-Mechanics Co., Ltd.
- *Disclaimer: Major Players sorted in no particular order


Recent Industry Developments
- May 2025: Murata Manufacturing began constructing a new USD 19 million production building in Ho Chi Minh City to expand passive component output for electric vehicles and industrial drives.
- April 2025: TDK Corporation announced that 29% of FY2025-2027 capital expenditure will be directed to its Passive Components division to capture double-digit automotive demand growth.
- March 2025: Samsung Electro-Mechanics hired roughly 700 new staff for MLCC lines, signaling a two-to-three-fold workforce increase versus previous cycles as automotive orders surge.
- February 2025: KEMET rolled out AEC-Q200-compliant MLCCs rated to 1 kV with enhanced derating curves for 800 V battery systems.


Global High Voltage MLCC Market Report Scope
Class 1, Class 2 are covered as segments by Dielectric Type. 0 201, 0 402, 0 603, 0 805, 1 206, Others are covered as segments by Case Size. High-Range Capacitance, Low-Range Capacitance, Mid-Range Capacitance are covered as segments by Capacitance. Metal Cap, Radial Lead, Surface Mount are covered as segments by Mlcc Mounting Type. Aerospace and Defence, Automotive, Consumer Electronics, Industrial, Medical Devices, Power and Utilities, Telecommunication, Others are covered as segments by End User. Asia-Pacific, Europe, North America are covered as segments by Region.| Class 1 |
| Class 2 |
| 201 |
| 402 |
| 603 |
| 1005 |
| 1210 |
| Other Case Sizes |
| Metal Cap |
| Radial Lead |
| Surface Mount |
| Aerospace and Defence |
| Automotive |
| Consumer Electronics |
| Industrial |
| Medical Devices |
| Power and Utilities |
| Telecommunication |
| Other End-user Applications |
| North America | United States |
| Rest of North America | |
| Europe | Germany |
| United Kingdom | |
| Rest of Europe | |
| Asia-Pacific | China |
| India | |
| Japan | |
| South Korea | |
| Rest of Asia-Pacific | |
| Rest of the World |
| By Dielectric Type | Class 1 | |
| Class 2 | ||
| By Case Size | 201 | |
| 402 | ||
| 603 | ||
| 1005 | ||
| 1210 | ||
| Other Case Sizes | ||
| By MLCC Mounting Type | Metal Cap | |
| Radial Lead | ||
| Surface Mount | ||
| By End-user Application | Aerospace and Defence | |
| Automotive | ||
| Consumer Electronics | ||
| Industrial | ||
| Medical Devices | ||
| Power and Utilities | ||
| Telecommunication | ||
| Other End-user Applications | ||
| By Geography | North America | United States |
| Rest of North America | ||
| Europe | Germany | |
| United Kingdom | ||
| Rest of Europe | ||
| Asia-Pacific | China | |
| India | ||
| Japan | ||
| South Korea | ||
| Rest of Asia-Pacific | ||
| Rest of the World | ||


Market Definition
- MLCC (Multilayer Ceramic Capacitor) - A type of capacitor that consists of multiple layers of ceramic material, alternating with conductive layers, used for energy storage and filtering in electronic circuits.
- Voltage - The maximum voltage that a capacitor can safely withstand without experiencing breakdown or failure. It is typically expressed in volts (V)
- Capacitance - The measure of a capacitor's ability to store electrical charge, expressed in farads (F). It determines the amount of energy that can be stored in the capacitor
- Case Size - The physical dimensions of an MLCC, typically expressed in codes or millimeters, indicating its length, width, and height
| Keyword | Definition |
|---|---|
| MLCC (Multilayer Ceramic Capacitor) | A type of capacitor that consists of multiple layers of ceramic material, alternating with conductive layers, used for energy storage and filtering in electronic circuits. |
| Capacitance | The measure of a capacitor's ability to store electrical charge, expressed in farads (F). It determines the amount of energy that can be stored in the capacitor |
| Voltage Rating | The maximum voltage that a capacitor can safely withstand without experiencing breakdown or failure. It is typically expressed in volts (V) |
| ESR (Equivalent Series Resistance) | The total resistance of a capacitor, including its internal resistance and parasitic resistances. It affects the capacitor's ability to filter high-frequency noise and maintain stability in a circuit. |
| Dielectric Material | The insulating material used between the conductive layers of a capacitor. In MLCCs, commonly used dielectric materials include ceramic materials like barium titanate and ferroelectric materials |
| SMT (Surface Mount Technology) | A method of electronic component assembly that involves mounting components directly onto the surface of a printed circuit board (PCB) instead of through-hole mounting. |
| Solderability | The ability of a component, such as an MLCC, to form a reliable and durable solder joint when subjected to soldering processes. Good solderability is crucial for proper assembly and functionality of MLCCs on PCBs. |
| RoHS (Restriction of Hazardous Substances) | A directive that restricts the use of certain hazardous materials, such as lead, mercury, and cadmium, in electrical and electronic equipment. Compliance with RoHS is essential for automotive MLCCs due to environmental regulations |
| Case Size | The physical dimensions of an MLCC, typically expressed in codes or millimeters, indicating its length, width, and height |
| Flex Cracking | A phenomenon where MLCCs can develop cracks or fractures due to mechanical stress caused by bending or flexing of the PCB. Flex cracking can lead to electrical failures and should be avoided during PCB assembly and handling. |
| Aging | MLCCs can experience changes in their electrical properties over time due to factors like temperature, humidity, and applied voltage. Aging refers to the gradual alteration of MLCC characteristics, which can impact the performance of electronic circuits. |
| ASPs (Average Selling Prices) | The average price at which MLCCs are sold in the market, expressed in USD million. It reflects the average price per unit |
| Voltage | The electrical potential difference across an MLCC, often categorized into low-range voltage, mid-range voltage, and high-range voltage, indicating different voltage levels |
| MLCC RoHS Compliance | Compliance with the Restriction of Hazardous Substances (RoHS) directive, which restricts the use of certain hazardous substances, such as lead, mercury, cadmium, and others, in the manufacturing of MLCCs, promoting environmental protection and safety |
| Mounting Type | The method used to attach MLCCs to a circuit board, such as surface mount, metal cap, and radial lead, which indicates the different mounting configurations |
| Dielectric Type | The type of dielectric material used in MLCCs, often categorized into Class 1 and Class 2, representing different dielectric characteristics and performance |
| Low-Range Voltage | MLCCs designed for applications that require lower voltage levels, typically in the low voltage range |
| Mid-Range Voltage | MLCCs designed for applications that require moderate voltage levels, typically in the middle range of voltage requirements |
| High-Range Voltage | MLCCs designed for applications that require higher voltage levels, typically in the high voltage range |
| Low-Range Capacitance | MLCCs with lower capacitance values, suitable for applications that require smaller energy storage |
| Mid-Range Capacitance | MLCCs with moderate capacitance values, suitable for applications that require intermediate energy storage |
| High-Range Capacitance | MLCCs with higher capacitance values, suitable for applications that require larger energy storage |
| Surface Mount | MLCCs designed for direct surface mounting onto a printed circuit board (PCB), allowing for efficient space utilization and automated assembly |
| Class 1 Dielectric | MLCCs with Class 1 dielectric material, characterized by a high level of stability, low dissipation factor, and low capacitance change over temperature. They are suitable for applications requiring precise capacitance values and stability |
| Class 2 Dielectric | MLCCs with Class 2 dielectric material, characterized by a high capacitance value, high volumetric efficiency, and moderate stability. They are suitable for applications that require higher capacitance values and are less sensitive to capacitance changes over temperature |
| RF (Radio Frequency) | It refers to the range of electromagnetic frequencies used in wireless communication and other applications, typically from 3 kHz to 300 GHz, enabling the transmission and reception of radio signals for various wireless devices and systems. |
| Metal Cap | A protective metal cover used in certain MLCCs (Multilayer Ceramic Capacitors) to enhance durability and shield against external factors like moisture and mechanical stress |
| Radial Lead | A terminal configuration in specific MLCCs where electrical leads extend radially from the ceramic body, facilitating easy insertion and soldering in through-hole mounting applications. |
| Temperature Stability | The ability of MLCCs to maintain their capacitance values and performance characteristics across a range of temperatures, ensuring reliable operation in varying environmental conditions. |
| Low ESR (Equivalent Series Resistance) | MLCCs with low ESR values have minimal resistance to the flow of AC signals, allowing for efficient energy transfer and reduced power losses in high-frequency applications. |


Research Methodology
Mordor Intelligence has followed the following methodology in all our MLCC reports.
- Step 1: Identify Data Points: In this step, we identified key data points crucial for comprehending the MLCC market. This included historical and current production figures, as well as critical device metrics such as attachment rate, sales, production volume, and average selling price. Additionally, we estimated future production volumes and attachment rates for MLCCs in each device category. Lead times were also determined, aiding in forecasting market dynamics by understanding the time required for production and delivery, thereby enhancing the accuracy of our projections.
- Step 2: Identify Key Variables: In this step, we focused on identifying crucial variables essential for constructing a robust forecasting model for the MLCC market. These variables include lead times, trends in raw material prices used in MLCC manufacturing, automotive sales data, consumer electronics sales figures, and electric vehicle (EV) sales statistics. Through an iterative process, we determined the necessary variables for accurate market forecasting and proceeded to develop the forecasting model based on these identified variables.
- Step 3: Build a Market Model: In this step, we utilized production data and key industry trend variables, such as average pricing, attachment rate, and forecasted production data, to construct a comprehensive market estimation model. By integrating these critical variables, we developed a robust framework for accurately forecasting market trends and dynamics, thereby facilitating informed decision-making within the MLCC market landscape.
- Step 4: Validate and Finalize: In this crucial step, all market numbers and variables derived through an internal mathematical model were validated through an extensive network of primary research experts from all the markets studied. The respondents are selected across levels and functions to generate a holistic picture of the market studied.
- Step 5: Research Outputs: Syndicated Reports, Custom Consulting Assignments, Databases, and Subscription Platform


