Mechanical, Electrical And Plumbing (MEP) Services Market Size and Share
Market Overview
| Study Period | 2019 - 2030 |
|---|---|
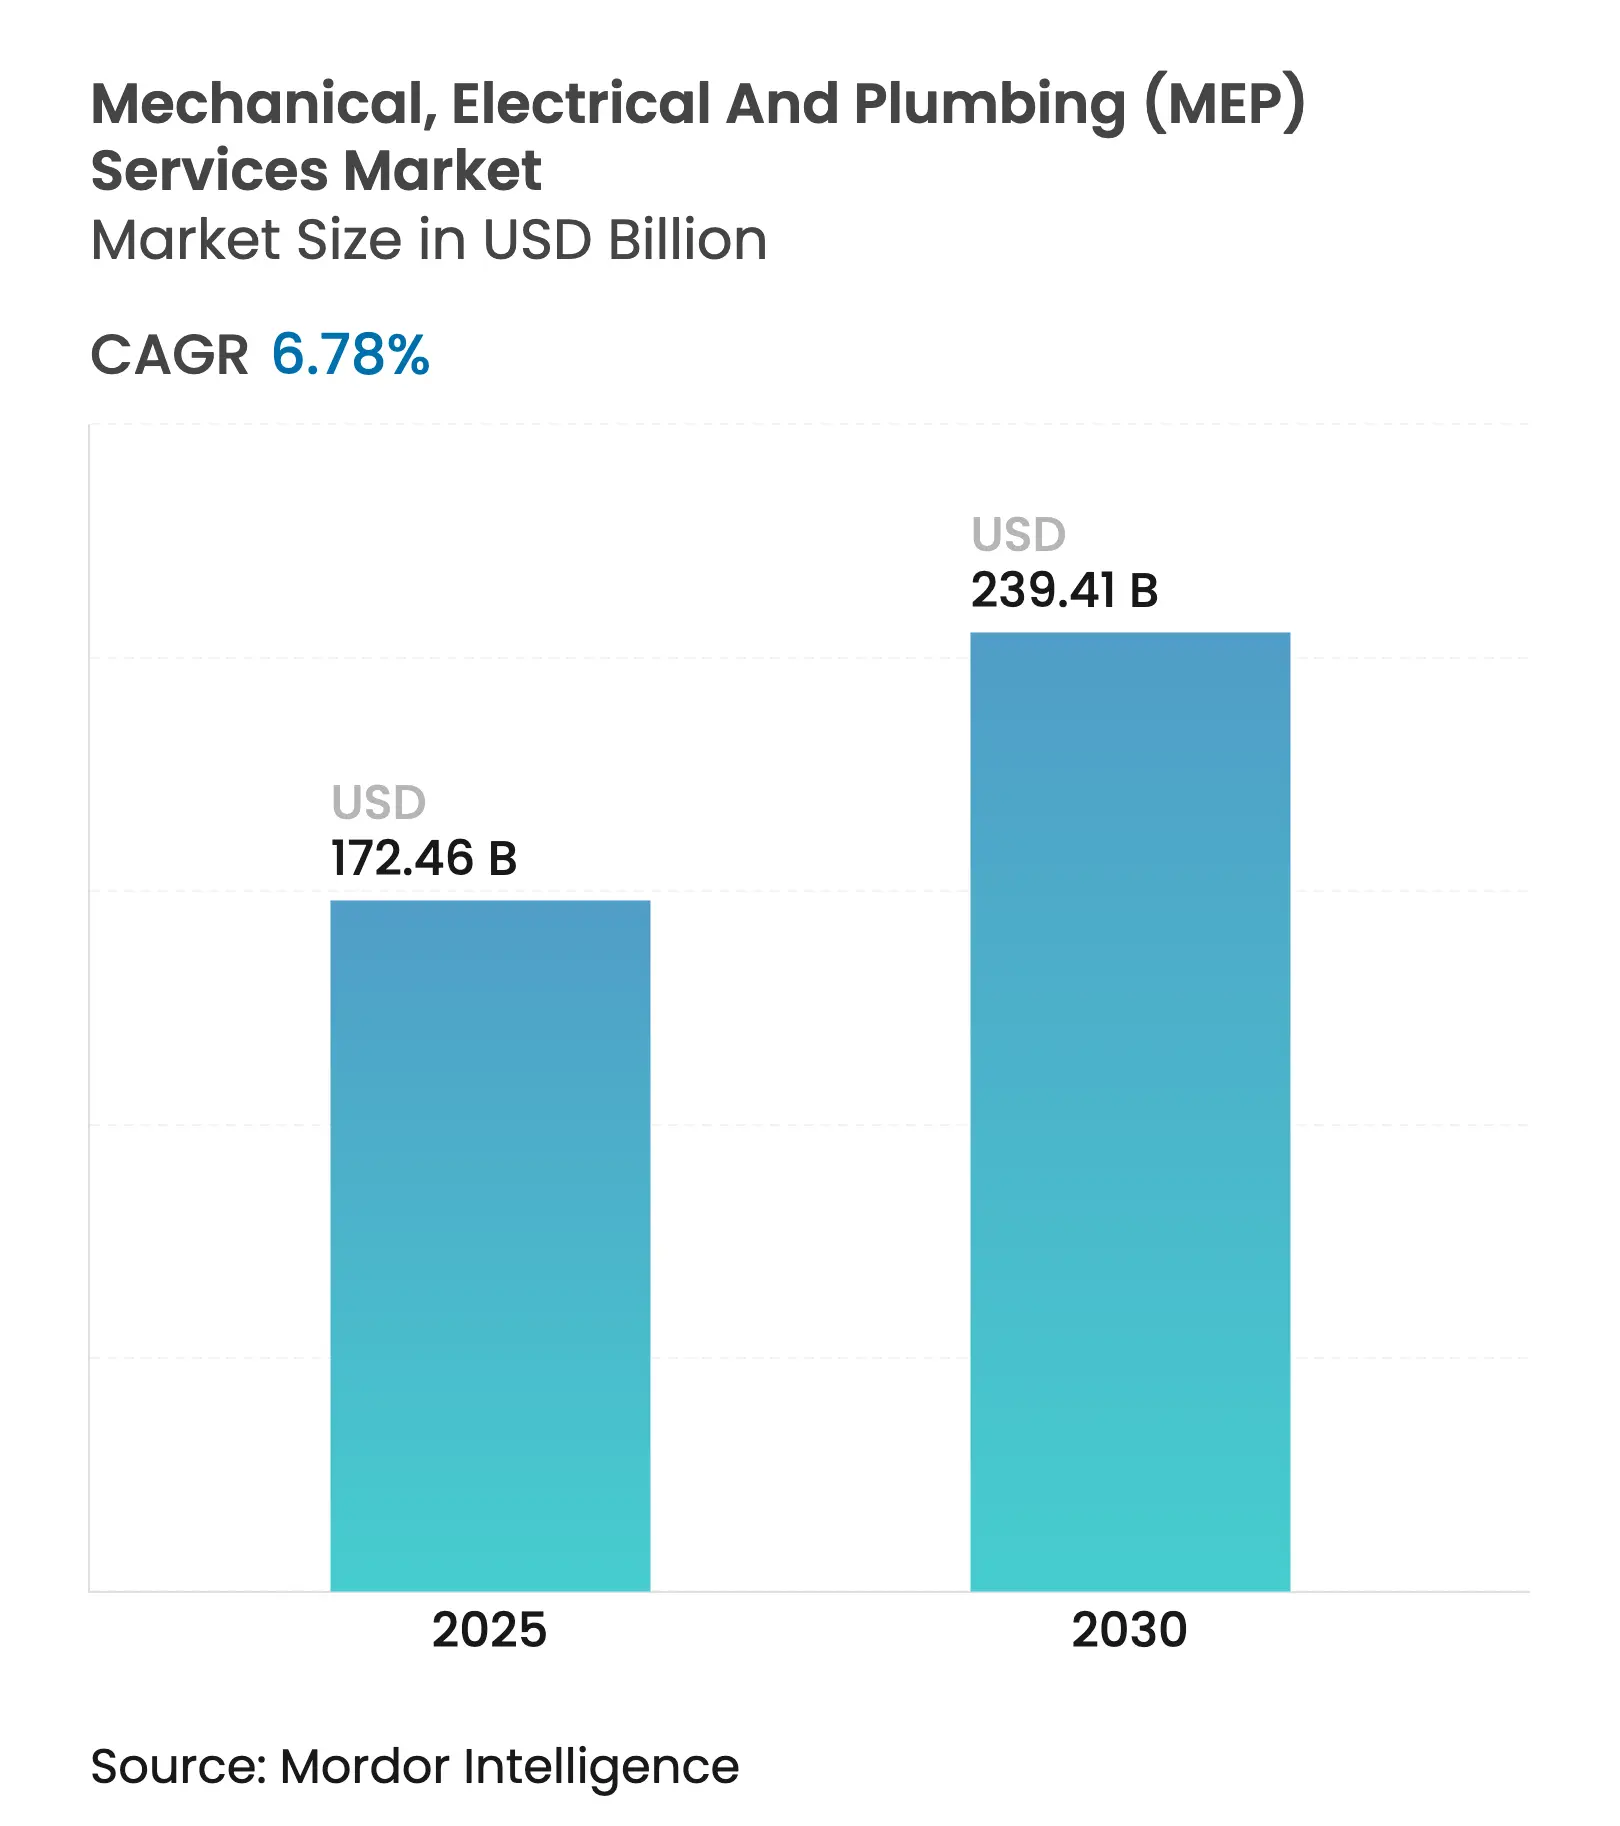
| Market Size (2025) | USD 172.46 Billion |
| Market Size (2030) | USD 239.41 Billion |
| Growth Rate (2025 - 2030) | 6.78 % CAGR |
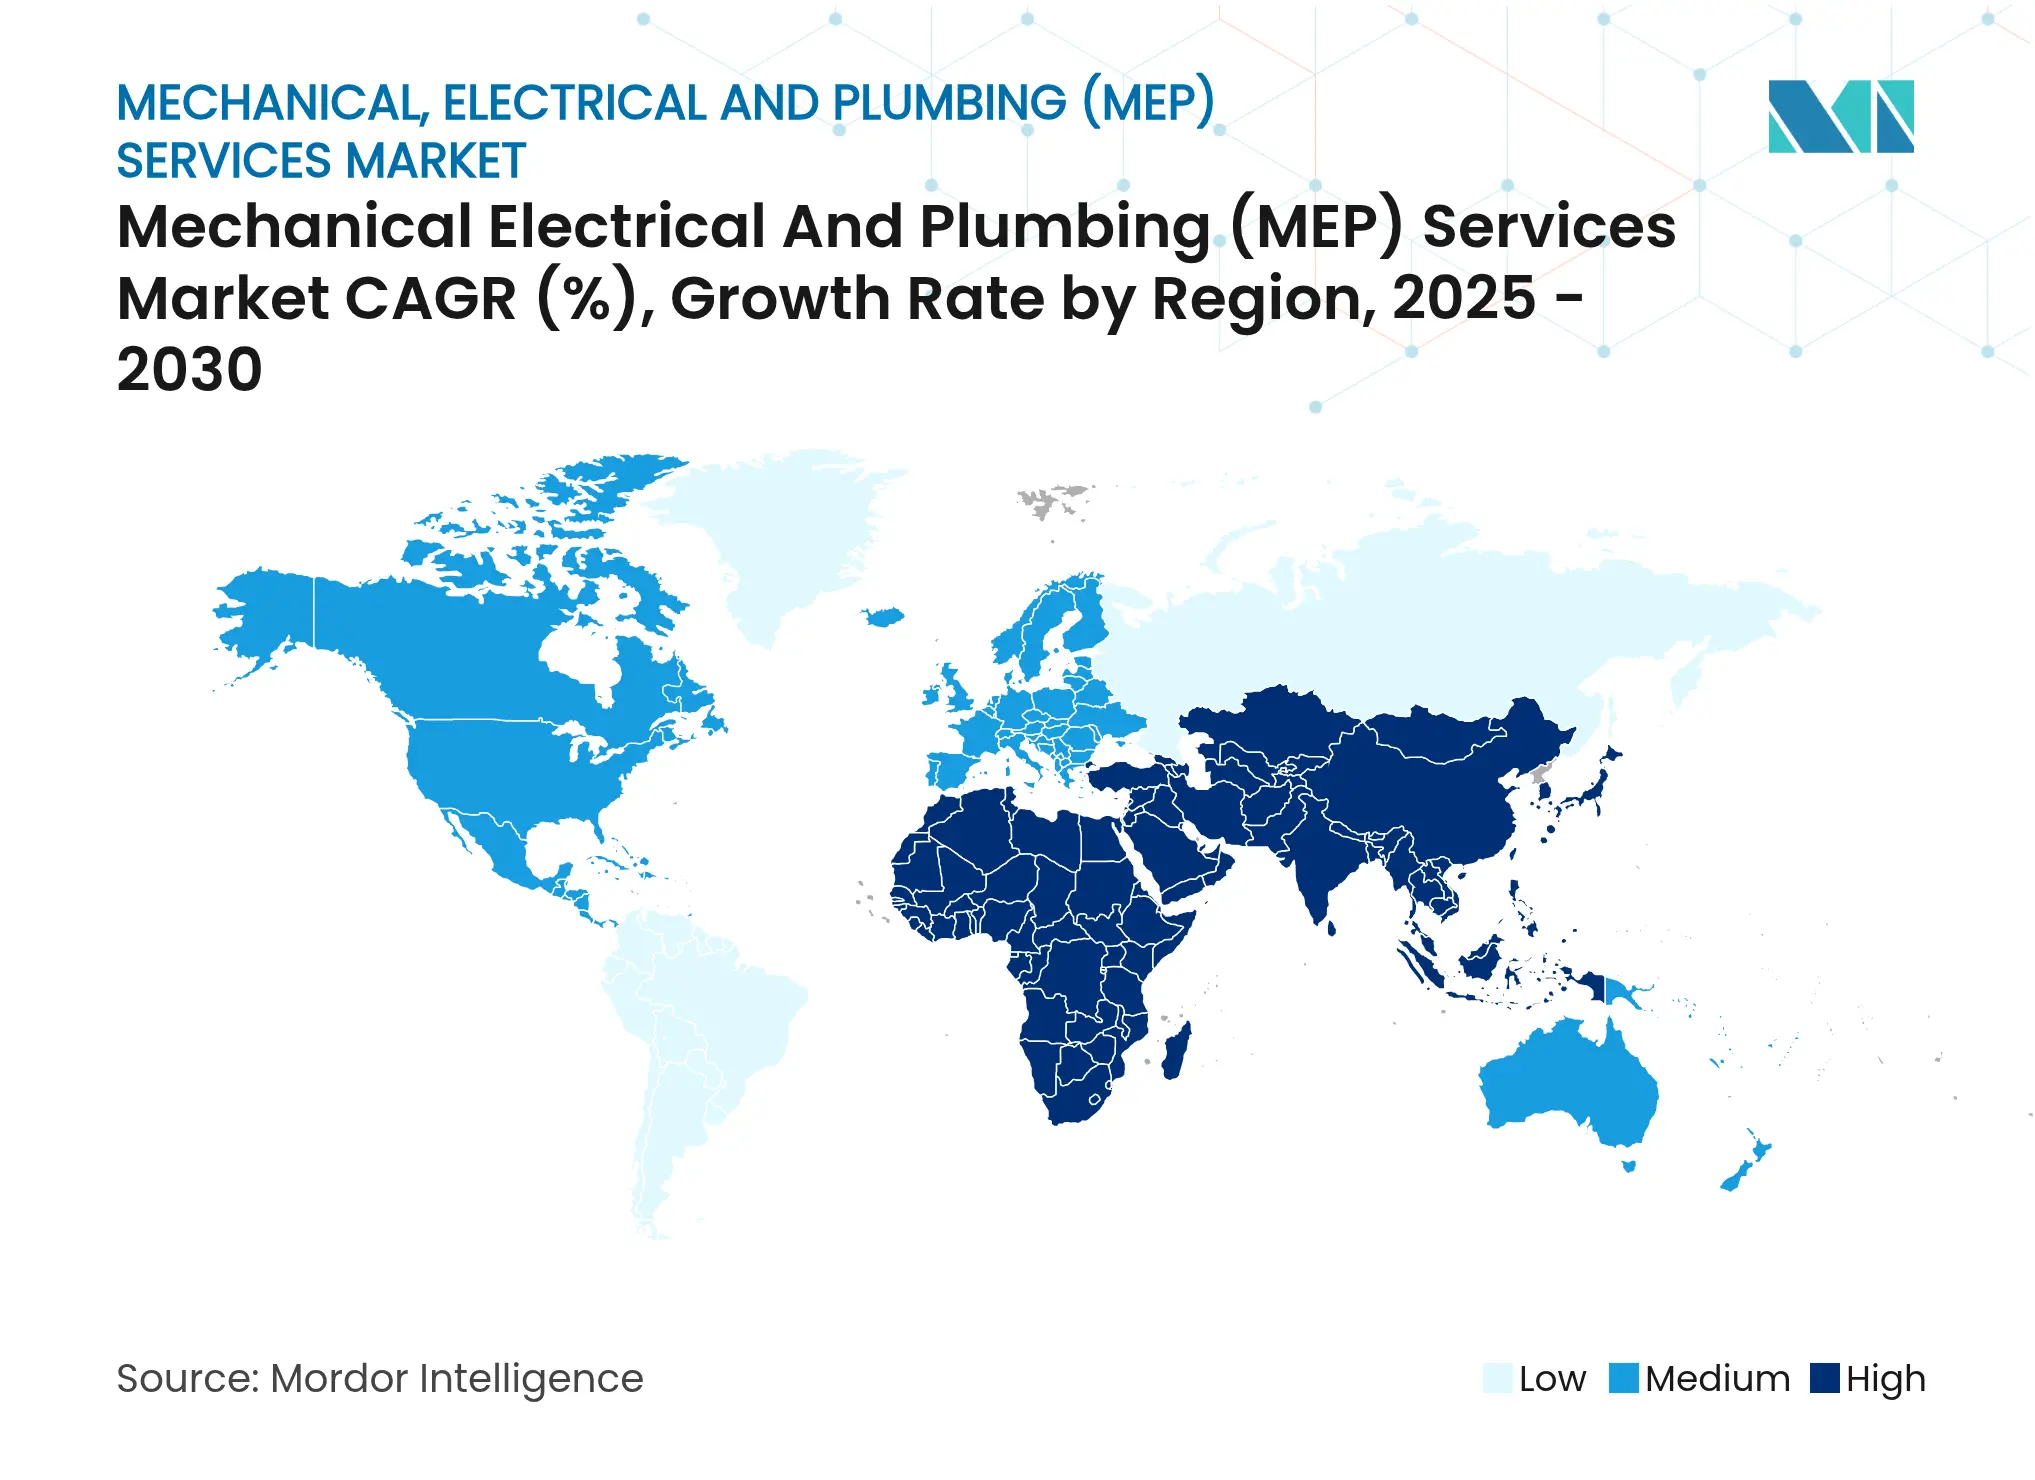
| Fastest Growing Market | Middle East and Africa |
| Largest Market | Asia-Pacific |
| Market Concentration | Medium |
Major Players *Disclaimer: Major Players sorted in no particular order. Image © Mordor Intelligence. Reuse requires attribution under CC BY 4.0. |
Mechanical, Electrical And Plumbing (MEP) Services Market Analysis by Mordor Intelligence
The Global MEP Services Market size reached USD 172.46 billion in 2025 and is on track to hit USD 239.41 billion by 2030, reflecting a 6.78% CAGR through the forecast period. This steady rise draws strength from overlapping waves of infrastructure renewal, building electrification mandates, and digitally enabled performance contracting. Heightened public-works funding in the United States and large-scale gigaprojects across the Gulf are generating sizable design-build backlogs, while Asia–Pacific’s swift urban build-out underpins baseline demand for HVAC, electrical distribution, and plumbing networks. Tightening energy-efficiency codes in California and the European Union are accelerating heat-pump, smart-panel, and building-automation retrofits that favor high-value engineering services. Contractors able to deliver prefabricated assemblies and digital twins are securing premiums as owners pursue schedule compression and lifecycle certainty. Meanwhile, outcome-based “MEP-as-a-Service” contracts are gaining traction, shifting revenues toward recurring performance fees and anchoring vendor-owner collaboration.
Key Report Takeaways
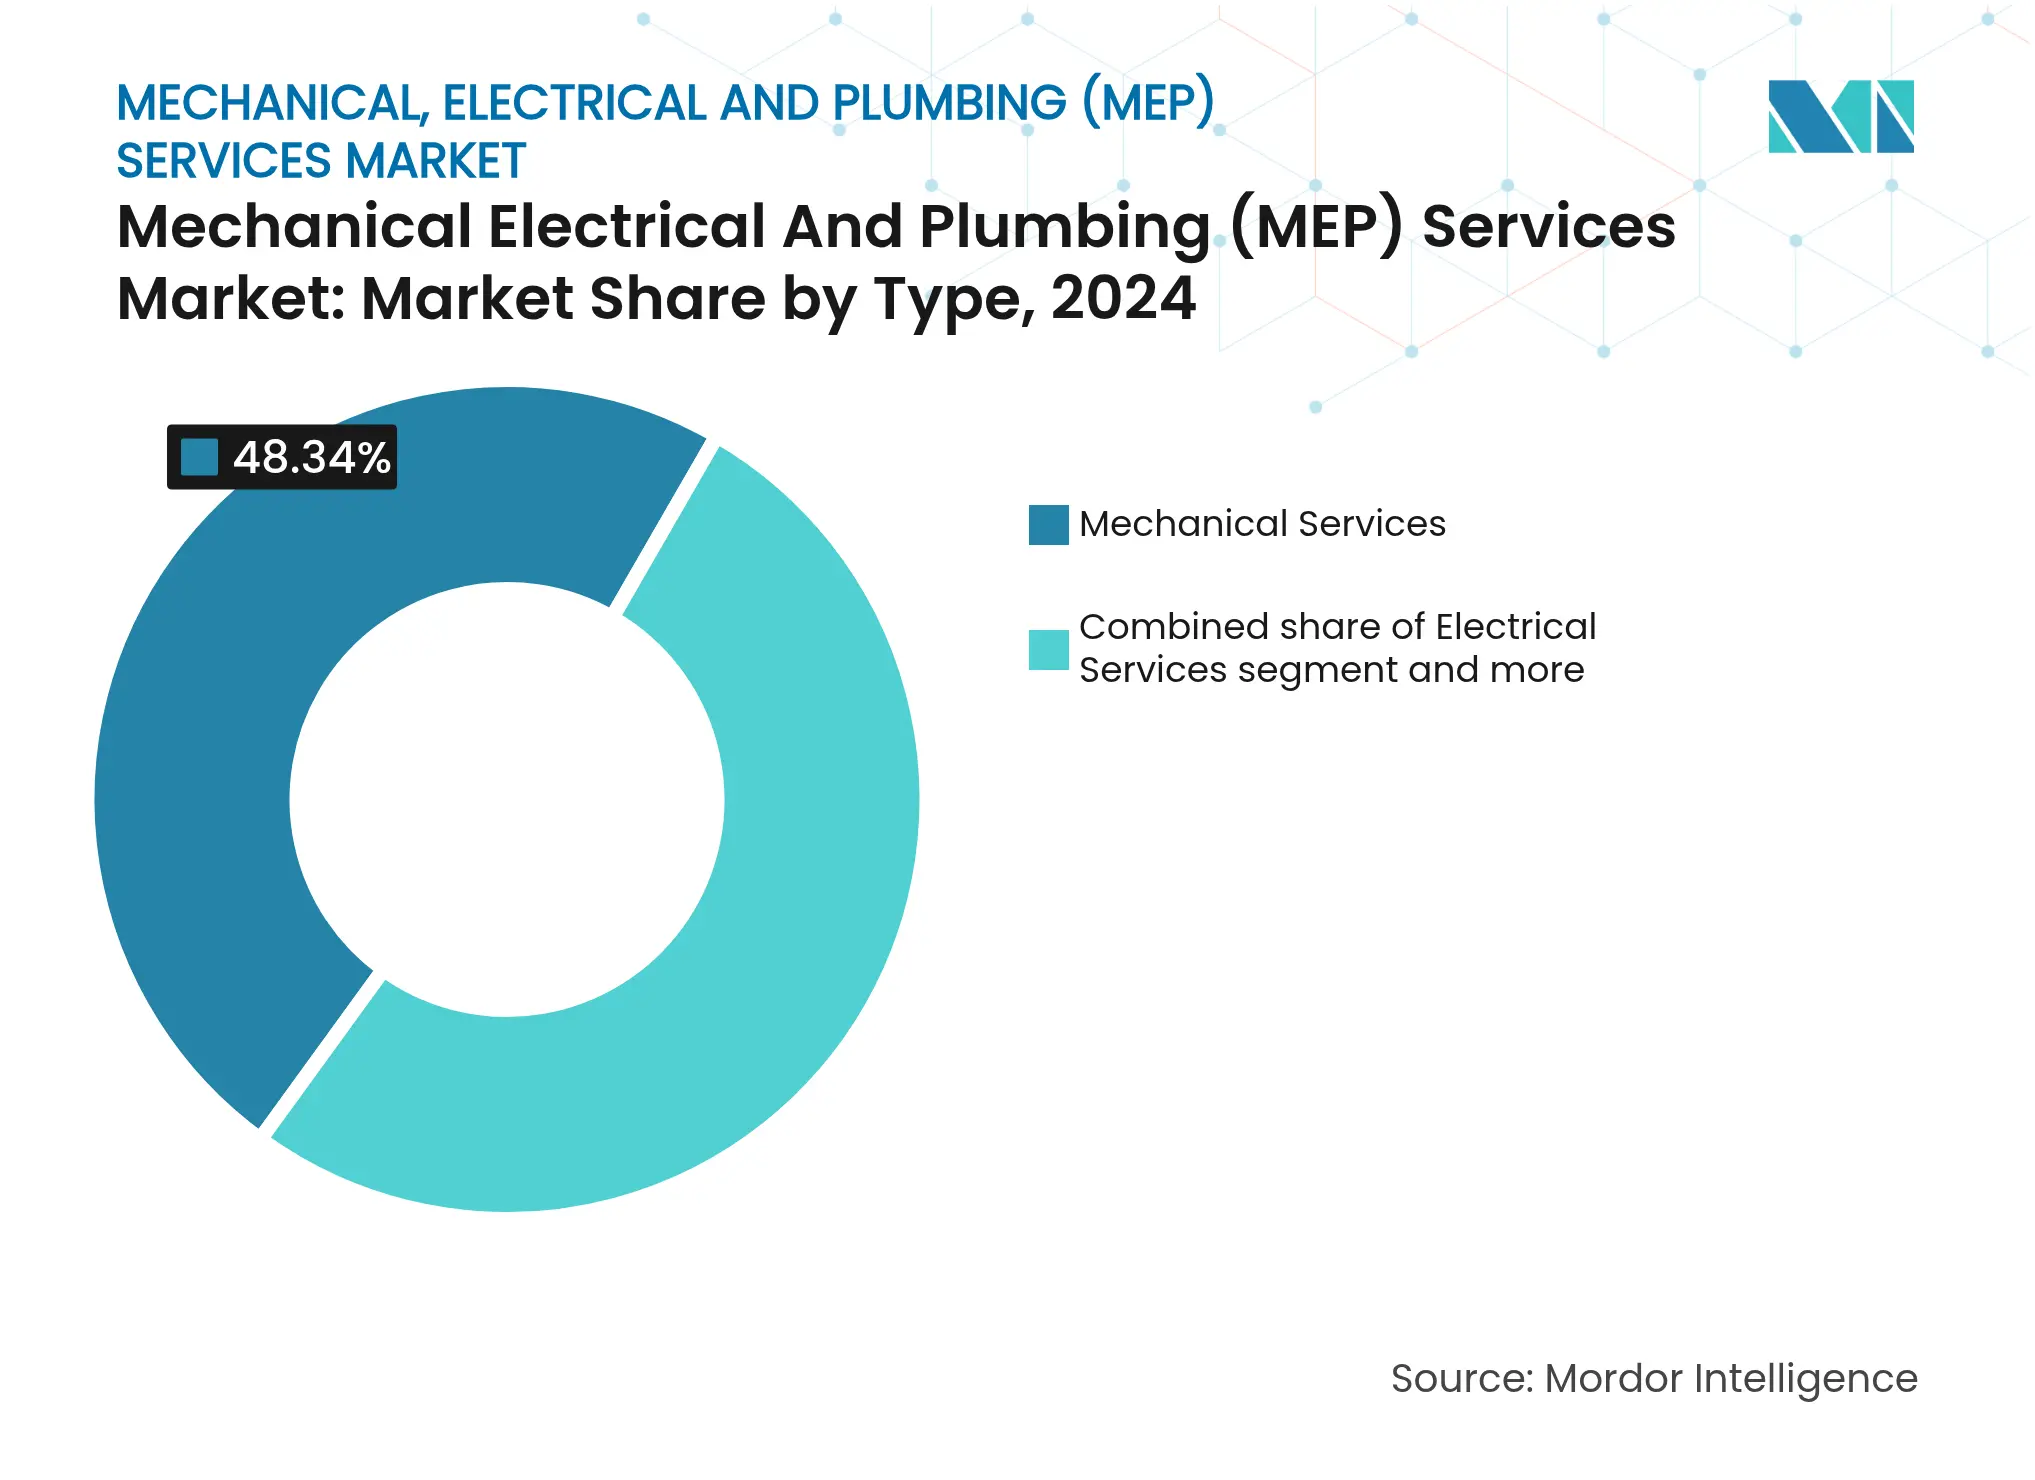
- By system type, Mechanical Services held 48.34% of the MEP services market share in 2024. Integrated MEP Services is forecast to advance at an 8.10% CAGR through 2030.
- By service offering, Design & Engineering claimed 36.34% of the MEP services market size in 2024, whereas the Other Services segment is projected to expand at an 8.82% CAGR to 2030.
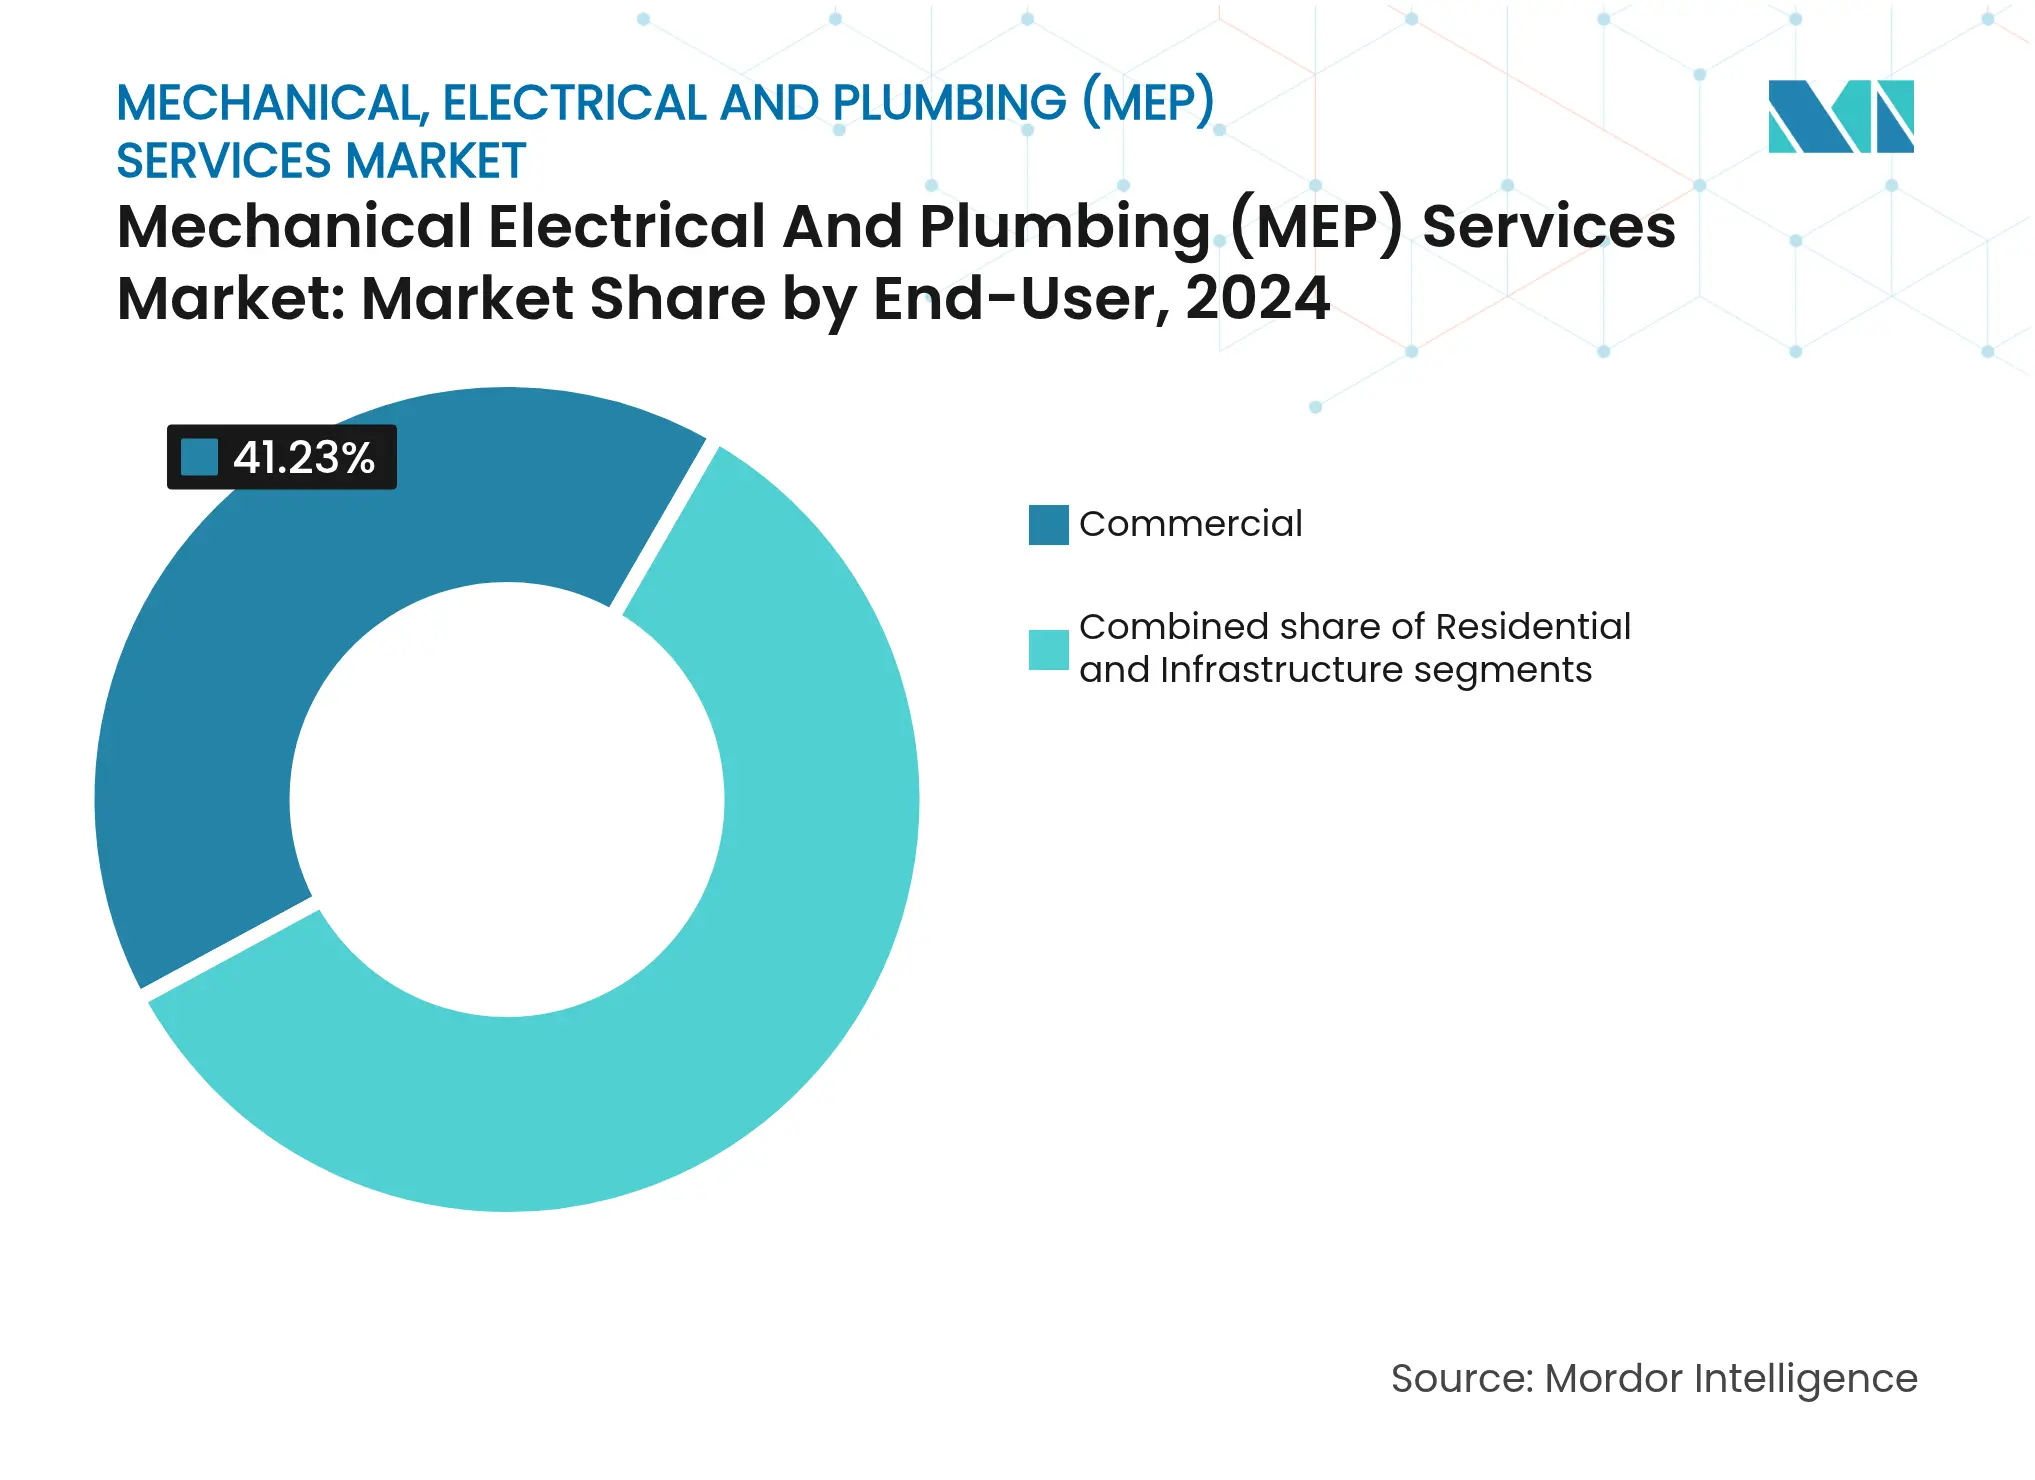
- By end-user, the Commercial segment captured 41.23% revenue in 2024; the Infrastructure segment is growing fastest at 8.6% CAGR to 2030.
- By geography, Asia–Pacific commanded 43.45% of 2024 revenue; the Middle East & Africa is set to log a 7.93% CAGR through 2030.
Global Mechanical, Electrical And Plumbing (MEP) Services Market Trends and Insights
Drivers Impact Analysis
| Drivers | (~) % Impact on CAGR Forecast | Geographic Relevance | Impact Timeline | |||
|---|---|---|---|---|---|---|
Surge
in global infrastructure spending programs
Surge
in global infrastructure spending programs
| +1.8% | Global, concentrated in APAC and MEA | Medium term (2-4 years) | (~) %
Impact on CAGR Forecast:
+1.8%
|
Geographic
Relevance
:
Global,
concentrated in APAC and MEA
|
Impact
Timeline
:
Medium
term (2-4 years)
|
Stricter
energy-efficiency & green-building regulations
Stricter
energy-efficiency & green-building regulations
| +1.5% | North America & EU, expanding to APAC | Long term (≥ 4 years) | |||
Rapid urbanization
& megacity projects in APAC & Middle East
Rapid urbanization
& megacity projects in APAC & Middle East
| +1.2% | APAC core, spill-over to MEA | Long term (≥ 4 years) | |||
"MEP-as-a-Service"
subscription models via IoT analytics
"MEP-as-a-Service"
subscription models via IoT analytics
| +0.8% | Global, early adoption in North America & EU | Medium term (2-4 years) | |||
Prefabricated
modular MEP "plug-and-play" assemblies
Prefabricated
modular MEP "plug-and-play" assemblies
| +0.6% | Global, concentrated in developed markets | Short term (≤ 2 years) | |||
EV-charging
& data-center cooling demand convergence
EV-charging
& data-center cooling demand convergence
| +0.5% | Global, concentrated in urban centers | Medium term (2-4 years) | |||
| Source: Mordor Intelligence | ||||||
Surge in Global Infrastructure Spending Programs
Massive public-sector outlays are creating multi-year pipelines for mechanical, electrical, and plumbing contractors. The United States has earmarked more than USD 1 trillion for roads, transit, energy, and water systems, including USD 100 million devoted to digital construction technologies that reward contractors skilled in BIM-integrated design. Saudi Arabia’s gigaprojects, led by NEOM and its USD 5 billion DataVolt data-center deal, are setting new benchmarks for integrated cooling, power, and wastewater systems. Vietnam’s push to attract USD 20.2 billion in foreign manufacturing investment is spurring factory builds that require precision HVAC and process utilities. Similar infrastructure blueprints in India, Indonesia, and Egypt channel capital into mass-transit corridors, desalination plants, and renewable microgrids, each dependent on sophisticated MEP coordination. Contractors able to bundle design, prefabrication, installation, and recurring optimization now compete on solution velocity rather than on the lowest labor rate[1]Michael Regan, “Investing in America: Bipartisan Infrastructure Law & Inflation Reduction Act Funding Update 2024,” United States Environmental Protection Agency, epa.gov.
Stricter Energy-Efficiency & Green-Building Regulations
Policy tailwinds in Europe and North America are reshaping mechanical and electrical specifications. The EU Energy Performance of Buildings Directive now obliges zero-emission performance for all new structures by 2030 and ends fossil-fuel boiler subsidies in 2025, shifting demand toward heat pumps, smart inverters, and demand-response control layers. California’s 2025 Energy Code mandates heat-pump space conditioning in most new dwellings and extends on-site solar-plus-storage rules to high-rise multifamily and nonresidential buildings. These mandates drive electrical-panel enlargements, branch-circuit upgrades, and sensor-rich automation that raise the engineering quotient of each retrofit. Canada’s amended Federal Energy Efficiency Regulations require 90%-efficient commercial boilers, prompting distribution loop redesigns to accommodate lower return-water temperatures. Collectively, these policies guarantee a steady backlog of performance-driven retrofit work and elevate the value proposition of design engineers versed in whole-building electrification[2]Kadri Simson, “Recast Energy Performance of Buildings Directive Adopted May 2024,” European Commission, ec.europa.eu.
Rapid Urbanization & Megacity Projects in APAC & the Middle East
Population growth in Asia-Pacific adds the equivalent of one Manila or Riyadh every month, pushing municipal planners toward vertical mixed-use districts and advanced transit hubs. The International Energy Agency foresees Southeast Asian electricity demand climbing 4% annually to 2035, with cooling loads alone rising from 16% to 30% of total building consumption. NEOM’s USD 2.7 billion pumped-hydro storage and USD 347 million wastewater recycling facilities illustrate the multi-utility complexity of future megacities. Vietnam’s electronics and semiconductor hubs need ISO-classified cleanrooms, ultrapure water loops, and redundant power feeds. Governments from Singapore to Qatar now stipulate BIM coordination and prefabricated MEP skids on public projects, aligning supply chains toward integrated delivery and boosting regional demand for cross-discipline service providers[3]Fatih Birol, “Southeast Asia Energy Outlook 2024,” International Energy Agency, iea.org.
“MEP-as-a-Service” Subscription Models via IoT Analytics
Building owners increasingly seek outcome guarantees rather than transactional installs. Johnson Controls reports average clients cut energy use 10-20% within three months of deploying its AI-driven OpenBlue platform, while predictive maintenance reduces reactive calls by up to 90%. Honeywell’s Forge delivers portfolio-wide optimization through edge analytics that fine-tune set points according to occupancy and utility tariffs. These offerings convert capital spending into monthly service fees, lowering up-front barriers and producing stickier revenues for contractors. Real-time dashboards and remote diagnostics let limited-skilled technicians manage wider asset portfolios, while cybersecurity services emerge as a billable layer as operational-technology networks face escalating threat vectors. The subscription model also aligns vendor incentives with tenant comfort, regulatory compliance, and carbon-reduction goals, fortifying long-term client relationships.
Restraints Impact Analysis
| Restraints | (~) % Impact on CAGR Forecast | Geographic Relevance | Impact Timeline | |||
|---|---|---|---|---|---|---|
Skilled-labor
shortages inflating specialty trade costs
Skilled-labor
shortages inflating specialty trade costs
| -1.4% | Global, acute in North America & EU | Short term (≤ 2 years) | (~) %
Impact on CAGR Forecast:
-1.4%
|
Geographic
Relevance
:
Global,
acute in North America & EU
|
Impact
Timeline
:
Short
term (≤ 2 years)
|
Supply-chain
price volatility for HVAC components & copper
Supply-chain
price volatility for HVAC components & copper
| -0.9% | Global, concentrated impact in manufacturing regions | Medium term (2-4 years) | |||
Rising
cybersecurity compliance costs for connected MEP
Rising
cybersecurity compliance costs for connected MEP
| -0.6% | North America & EU, expanding to APAC | Medium term (2-4 years) | |||
HFC-phase-down
retrofit liabilities for legacy HVAC assets
HFC-phase-down
retrofit liabilities for legacy HVAC assets
| -0.5% | Global, concentrated in developed markets | Short term (≤ 2 years) | |||
| Source: Mordor Intelligence | ||||||
Skilled-Labor Shortages Inflating Specialty Trade Costs
Electrical, plumbing, and HVAC technicians are aging faster than new entrants join the trades in North America, Europe, and Australia. Vacancies lift wage bids, extend project schedules, and prompt contractors to compete aggressively for certified workers. Employers are investing in augmented-reality guided installations and modular plant-room skids to stretch limited crews over more projects. Manufacturers such as Honeywell embed self-diagnostic firmware and QR-code tutorials to shorten commissioning cycles, yet complex tasks like A2L refrigerant charging or building-automation programming still require seasoned technicians. This imbalance pressures margins, inflates bid contingencies, and reinforces the appeal of prefabrication and remote system monitoring.
Supply-Chain Price Volatility for HVAC Components & Copper
The R-410A refrigerant phase-out that takes effect in 2025 forces OEMs to redesign equipment for mildly flammable A2L alternatives. As legacy inventory winds down, chiller and rooftop-unit lead times lengthen, and price quotes may only hold for days. Copper price swings inject uncertainty into both electrical feeders and plumbing risers, complicating fixed-price contracts. Contractors resort to escalation clauses, early bulk material buys, and value-engineering swaps, yet still face pass-through risk when bespoke air-handling units or variable-speed compressors arrive late. These factors increase working-capital requirements and can trigger liquidated damages on time-critical projects, especially data centers and life-science labs that cannot slip energization dates.
Segment Analysis
By Type: Mechanical Services Command Nearly Half of 2024 Revenue
Mechanical Services accounted for 48.34% of the MEP services market in 2024, driven by the sheer capital intensity of HVAC, district-energy, and process-piping systems. Electrification policies do not eliminate mechanical scope; they pivot it toward variable-refrigerant heat pumps, heat-recovery chillers, and advanced hydronics that call for precision engineering and commissioning. The MEP services market size linked to electrical systems also expands as rooftop solar, battery storage, and EV-charging hardware integrate with smart switchboards and microgrid controllers. Plumbing Services maintains a steady niche anchored in water-reuse mandates and lead-pipe replacement initiatives. Since building owners increasingly favor single accountability, Integrated MEP Services is the fastest riser at 8.10% CAGR. Bundled contracts reduce coordination gaps, lower change-order frequency, and align control-system architectures across disciplines, shaping a more cohesive supply chain.
Second-order effects include a surge in digital twin adoption that pushes contractors to invest in 3D laser scanning, cloud-based clash detection, and common-data environments. This investment supports turnkey offerings where mechanical, electrical, and plumbing models are federated from day one. For large campuses, a unified team can overlay fault detection analytics during the handover phase, abbreviating warranty claims and securing follow-on service revenue. Owners prioritizing guaranteed system performance view this model as a hedge against fragmented accountability, reinforcing the structural shift toward integration and away from siloed sub-contracts.
Note: Segment shares of all individual segments available upon report purchase
By Service Type: Design & Engineering Retains Core Value While Predictive Services Surge
Design & Engineering captured 36.34% of the MEP services market share in 2024. Digital delivery standards elevate their importance because early-phase energy simulations, computational fluid-dynamics modeling, and grid-interactive design dictate downstream capital costs. Regulatory requirements for zero-emission buildings in Europe and heat-pump-ready dwellings in California raise the technical threshold for compliance documents, expanding the advisory role of consultants. Meanwhile, the Other Services category is projected to add 8.82% CAGR, reflecting sustained demand for predictive maintenance, energy-performance contracting, and subscription-based optimization. Under a typical agreement, building managers pay a fixed monthly fee that bundles remote monitoring, consumables, and parts replacement. This arrangement translates capital budgets into operating expenses, smoothing cash flow and positioning MEP vendors as strategic partners.
Installation, Testing, and Commissioning remain indispensable because field verification assures that high-fidelity models translate into operational reality. Commissioning agents now run functional performance tests that feed into the same analytic dashboards owners will use post-occupancy. Maintenance & Repair commands annuity-like cash flows as aging stock requires valve retrofits, control-board swaps, and pipe corrosion monitoring. Rising complexity makes these tasks less susceptible to commoditization, particularly under refrigerant-phase-down regimes where certified handling is mandatory. Combining these elements, the MEP services industry matures toward an integrated lifecycle model where every phase from concept through decommissioning resides within a unified data backbone.
By End-User Industry: Infrastructure Pipeline Accelerates at Topline Pace
Infrastructure projects are forecast to post an 8.6% CAGR to 2030, outpacing other sectors as governments channel resilience grants into water treatment works, transit corridors, and renewable-ready substations. The Infrastructure Investment and Jobs Act allocates USD 48 billion for water modernization, motivating mechanical contractors to prequalify for ozone contactor refurbishments and biosolids digester upgrades. Data-center construction emerges as an infrastructure subset because hyperscale operators treat cooling, power distribution, and battery energy storage as critical utility assets. NEOM’s USD 5 billion DataVolt facility exemplifies this complexity with stringent PUE targets that demand integrated chilled-water loops, heat-recovery ventilation, and on-site solar arrays.
The Commercial segment, at 41.23% of 2024 revenue, benefits from hybrid-workplace retrofits that prioritize touchless systems, indoor-air-quality monitoring, and demand-controlled ventilation. Retail developers pivot toward experiential malls with immersive lighting and distributed speakers that intensify low-voltage scope. Residential demand remains resilient where decarbonization incentives offset retrofit costs. California’s mandate for heat-pump water heaters in new dwellings accelerates panel upgrades and drives demand for 230-volt circuits. Collectively, sector diversity insulates the MEP services market from cyclical swings, as downturns in one asset class often coincide with stimulus-driven buoyancy in another.
Note: Segment shares of all individual segments available upon report purchase
Geography Analysis
Asia-Pacific leads the MEP services market with 43.45% revenue in 2024, propelled by rapid urbanization and industrial offshoring. Electricity consumption across ASEAN is projected to climb 4% annually through 2035 as comfort cooling surges. Governments encourage foreign direct investment by expediting industrial-park approvals that bundle reliable grid power, natural gas, and treated water networks, all of which embed sizable mechanical and electrical scopes. Singapore’s Infrastructure Asia initiative connects regional ministries with private financiers and solution providers, expanding the project funnel beyond well-publicized metro lines to water reclamation and regional data hubs.
The Middle East & Africa posts the fastest regional CAGR at 7.93% through 2030. Saudi Arabia, the United Arab Emirates, and Egypt treat signature smart-city districts as national diversification tools, ensuring multiyear MEP spending. NEOM alone has let USD 25 billion in contracts, covering everything from pumped-hydro storage to green hydrogen facilities. As the Gulf shifts toward net-zero pledges, district-cooling operators upgrade to hybrid chiller plants that integrate thermal-energy storage, raising both control complexity and retrofit volume. Sub-Saharan Africa sees growing demand for modular hospitals and off-grid solar-plus-battery systems that rely on compact prefabricated MEP skids.
North America’s infrastructure stimulus, anchored by the USD 1.2 trillion Bipartisan Act, invigorates water-quality upgrades, grid hardening, and bridge-tunnel ventilation projects. Private investment pours into battery cell gigafactories and cold-storage warehouses, each requiring specialty HVAC and dry-room dehumidification. Europe maintains stable growth as the EU’s zero-emission mandate accelerates envelope upgrades, heat-pump conversions, and demand-response controls; renovation needs exceed EUR 3.5 trillion (USD 3.7 trillion) by 2030. South America, though starting from a smaller base, records pockets of momentum in data-center builds around Santiago and São Paulo, together with Brazilian sanitation PPPs that call for large-scale pumping and SCADA systems.

Competitive Landscape
Market Concentration
The MEP services market remains moderately fragmented. The top five firms account for roughly 35% of global revenue, yet consolidation quickens as engineering multinationals pursue design-build-operate models. WSP Global’s USD 1.78 billion acquisition of Power Engineers deepened transmission-grid capability, while its USD 1-billion joint program with Microsoft positions the firm as a preferred consultant for hyperscale data centers. Johnson Controls and Honeywell exploit platform stickiness, embedding analytics and cybersecurity layers that raise switching costs. AECOM’s decade-long framework with Sydney Water showcases the strategic pull of long-term alliancing contracts. Eiffage’s USD 756 million headquarters project for the French Interior Ministry underscores European appetite for integrated PPP structures.
Technology players such as Schneider Electric, IBM, and Amazon Web Services edge into building-services territory via cloud-native digital twins and microgrid orchestration. Traditional contractors respond by co-investing in data analytics ventures or acquiring niche software developers. Workforce scarcity spurs investment in robotics for conduit bending, drone-based roof inspections, and 3D-printed plumbing fixtures, as firms seek productivity offsets. Barriers heighten around A2L refrigerant handling, cybersecurity compliance, and energy-performance insurance, giving credentialed incumbents an edge. Nonetheless, sustained margin pressure keeps competitive dynamics lively, with regional specialists courting private-equity roll-up capital to scale prefabrication plants and expand service footprints.
Mechanical, Electrical And Plumbing (MEP) Services Industry Leaders

*Disclaimer: Major Players sorted in no particular order
Recent Industry Developments
- April 2025: AECOM secured the Design Development Partner role for Sydney Water’s decade-long capital program serving 5.3 million customers.
- February 2025: NEOM and DataVolt announced a USD 5 billion green data-center agreement with the first 1.5 GW phase operational by 2028.
- February 2025: WSP Global entered a seven-year strategic alliance with Microsoft, with a combined potential value exceeding USD 1 billion, to engineer data-center and mission-critical facilities.
- August 2024: Eiffage won a USD 756 million contract to design, build, and maintain a government office complex in Saint-Ouen-sur-Seine for five years.
Table of Contents for Mechanical, Electrical And Plumbing (MEP) Services Industry Report
1. Introduction
- 1.1Study Assumptions & Market Definition
- 1.2Scope of the Study
2. Research Methodology
3. Executive Summary
4. Market Landscape
- 4.1Market Overview
- 4.2Market Drivers
- 4.2.1Surge in global infrastructure spending programmes
- 4.2.2Stricter energy-efficiency & green-building regulations
- 4.2.3Rapid urbanisation & megacity projects in APAC & Middle East
- 4.2.4“MEP-as-a-Service” subscription models via IoT analytics
- 4.2.5Prefabricated modular MEP “plug-and-play” assemblies
- 4.2.6EV-charging & data-centre cooling demand convergence
- 4.3Market Restraints
- 4.3.1Skilled-labour shortages inflating specialty trade costs
- 4.3.2Supply-chain price volatility for HVAC components & copper
- 4.3.3Rising cybersecurity compliance costs for connected MEP
- 4.3.4HFC-phase-down retrofit liabilities for legacy HVAC assets
- 4.4Value / Supply-Chain Analysis
- 4.5Regulatory Landscape
- 4.6Technological Outlook
- 4.7Industry Attractiveness - Porter’s Five Forces Analysis
- 4.7.1Threat of New Entrants
- 4.7.2Bargaining Power of Buyers
- 4.7.3Bargaining Power of Suppliers
- 4.7.4Threat of Substitute Products
- 4.7.5Intensity of Competitive Rivalry
- 4.8Cost Structure Analysis
5. Market Size & Growth Forecasts (Value, In USD Billion)
- 5.1By Type
- 5.1.1Mechanical Services
- 5.1.2Electrical Services
- 5.1.3Plumbing Services
- 5.1.4Integrated MEP Services
- 5.2By Service Type
- 5.2.1Design & Engineering
- 5.2.2Installation, Testing, and Commissioning
- 5.2.3Maintenance & Repair
- 5.2.4Other Services
- 5.3By End-User Industry
- 5.3.1Residential
- 5.3.2Commercial
- 5.3.3Infrastructure
- 5.4By Geography
- 5.4.1North America
- 5.4.1.1United States
- 5.4.1.2Canada
- 5.4.1.3Mexico
- 5.4.2South America
- 5.4.2.1Brazil
- 5.4.2.2Argentina
- 5.4.2.3Chile
- 5.4.2.4Rest of South America
- 5.4.3Europe
- 5.4.3.1Germany
- 5.4.3.2United Kingdom
- 5.4.3.3France
- 5.4.3.4Italy
- 5.4.3.5Spain
- 5.4.3.6Rest of Europe
- 5.4.4Asia-Pacific
- 5.4.4.1China
- 5.4.4.2India
- 5.4.4.3Japan
- 5.4.4.4South Korea
- 5.4.4.5Australia
- 5.4.4.6Rest of Asia-Pacific
- 5.4.5Middle East & Africa
- 5.4.5.1United Arab Emirates
- 5.4.5.2Saudi Arabia
- 5.4.5.3South Africa
- 5.4.5.4Nigeria
- 5.4.5.5Rest of Middle East and Africa
6. Competitive Landscape
- 6.1Market Concentration
- 6.2Strategic Moves
- 6.3Market Share Analysis
- 6.4Company Profiles (includes Global level Overview, Market level overview, Core Segments, Financials as available, Strategic Information, Products & Services, and Recent Developments)
- 6.4.1Jacobs
- 6.4.2AECOM
- 6.4.3WSP Global
- 6.4.4Fluor Corporation
- 6.4.5EMCOR Group
- 6.4.6Comfort Systems USA
- 6.4.7TDIndustries
- 6.4.8Johnson Controls Building Solutions
- 6.4.9Honeywell Building Solutions
- 6.4.10Siemens Smart Infrastructure
- 6.4.11Drake & Scull Engineering
- 6.4.12ETA Engineering
- 6.4.13Atkins (SNC-Lavalin)
- 6.4.14Habtoor Leighton Specon
- 6.4.15Hyder Consulting (Arcadis)
- 6.4.16Dar Al-Handasah
- 6.4.17Al-Futtaim Engineering
- 6.4.18Bowman Consulting Group
- 6.4.19Sterling & Wilson
- 6.4.20MEP Engineering Inc.
- 6.4.21Global Facility Solutions
7. Market Opportunities & Future Outlook
- 7.1White-space & Unmet-Need Assessment
Global Mechanical, Electrical And Plumbing (MEP) Services Market Report Scope
MEP Services encompasses the design, engineering, consulting, and maintenance-related activities provided by engineering firms across a wide range of end-user verticals. Furthermore, report offers a complete background analysis of Global Mechanical Electrical and Plumbing (MEP) Services Market, which includes an assessment of the economy, market overview, market size estimation for key segments, and emerging trends in the market, market dynamics, and key company profiles are covered in the report.
The Global Mechanical Electrical and Plumbing (MEP) Services Market is segmented by Type (Mechanical Services, Electrical Services and Plumbing Services), by End-Users (Commercial and Residential) and by Geography (North America, Europe, Asia Pacific, Middle East and Africa and South America). The report offers market size and forecasts for Global Mechanical Electrical and Plumbing (MEP) Services Market in value (USD Billion) for all above segments.