LWAN Market Size and Share
Market Overview
| Study Period | 2020 - 2031 |
|---|---|
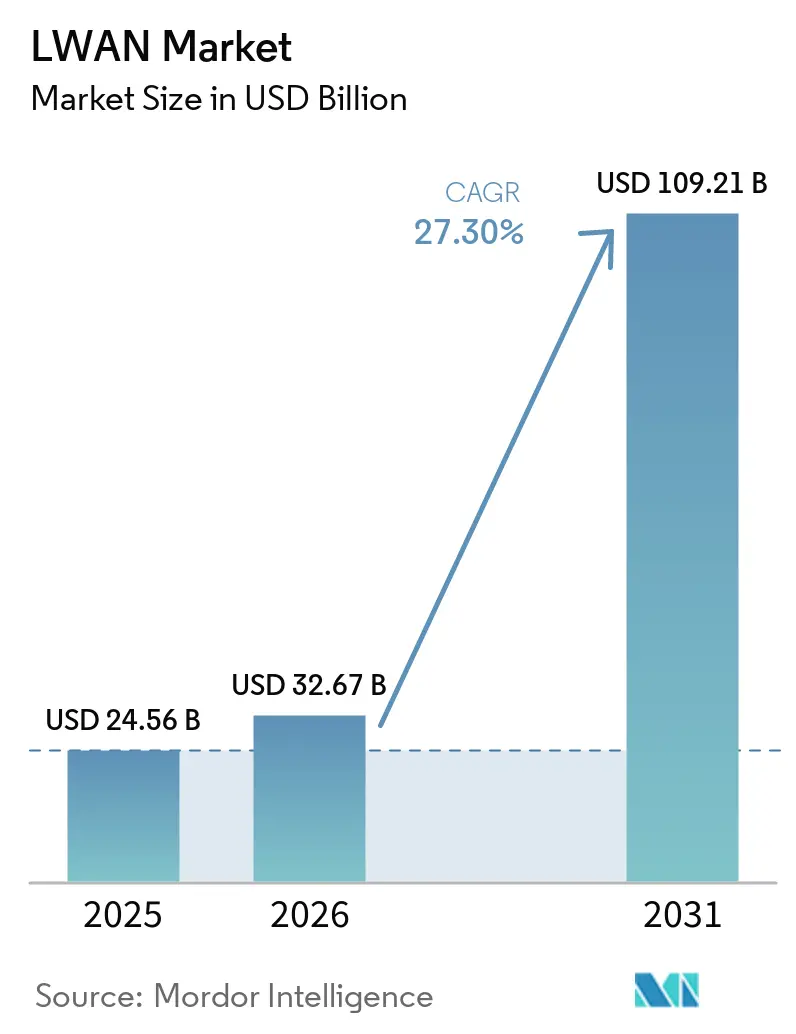
| Market Size (2026) | USD 32.67 Billion |
| Market Size (2031) | USD 109.21 Billion |
| Growth Rate (2026 - 2031) | 27.30% CAGR |
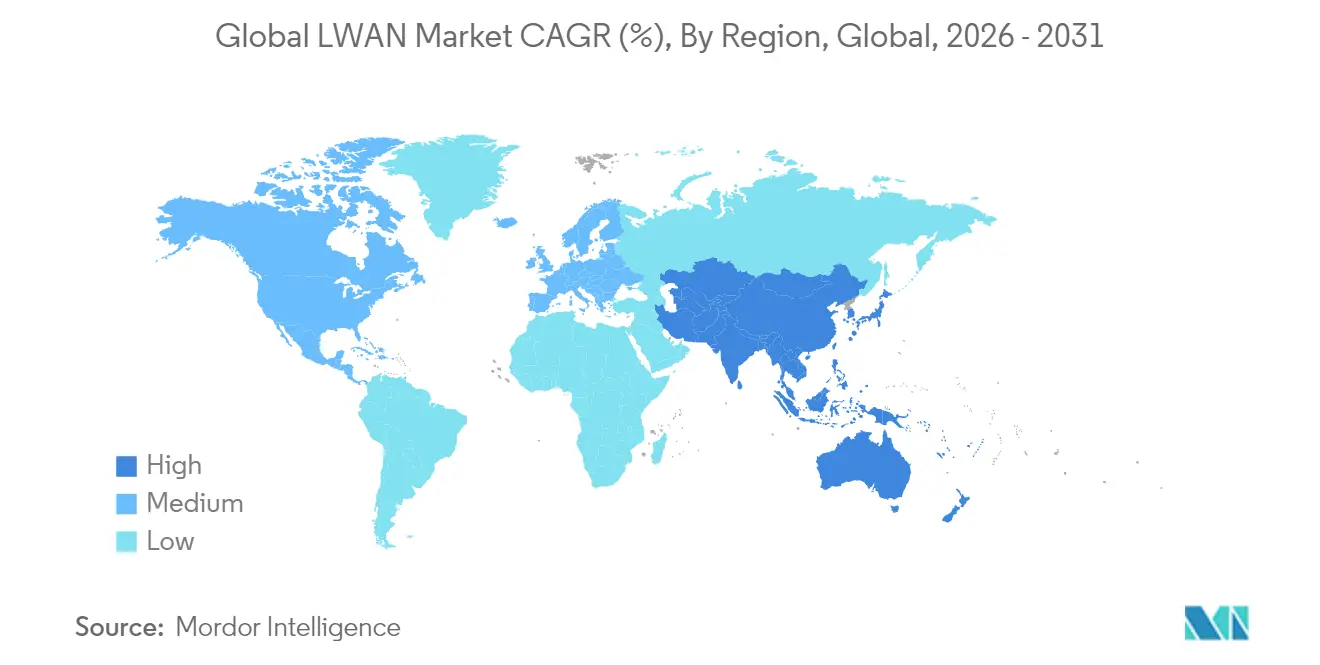
| Fastest Growing Market | Asia-Pacific |
| Largest Market | Asia Pacific |
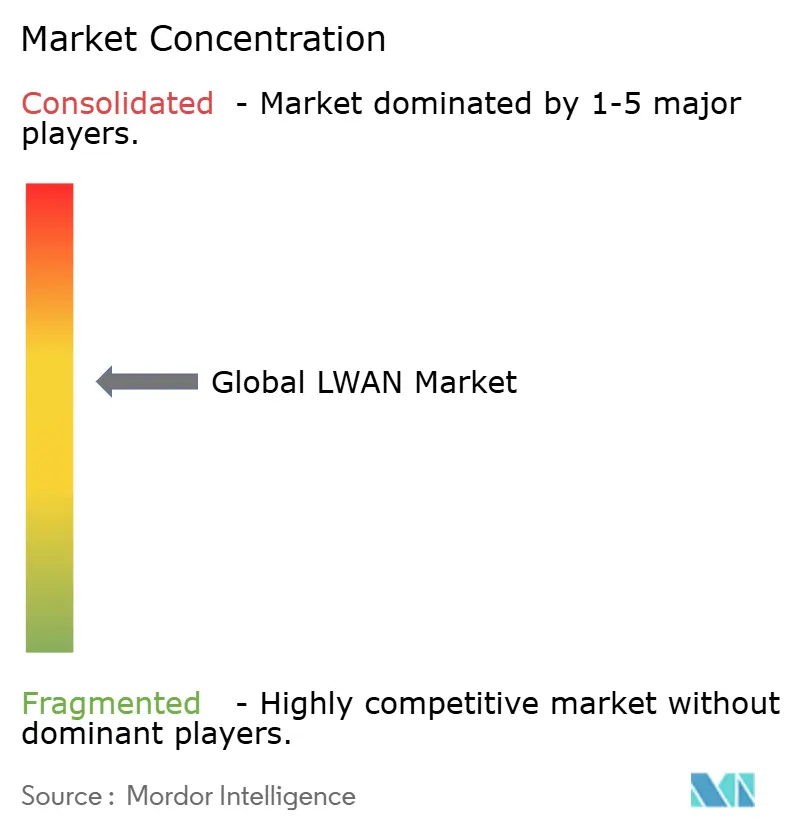
| Market Concentration | Medium |
Major Players *Disclaimer: Major Players sorted in no particular order Image © Mordor Intelligence. Reuse requires attribution under CC BY 4.0. | |
LWAN Market Analysis by Mordor Intelligence
The Global LWAN Market size is expected to increase from USD 24.56 billion in 2025 to USD 32.67 billion in 2026 and reach USD 109.21 billion by 2031, growing at a CAGR of 27.30% over 2026-2031.
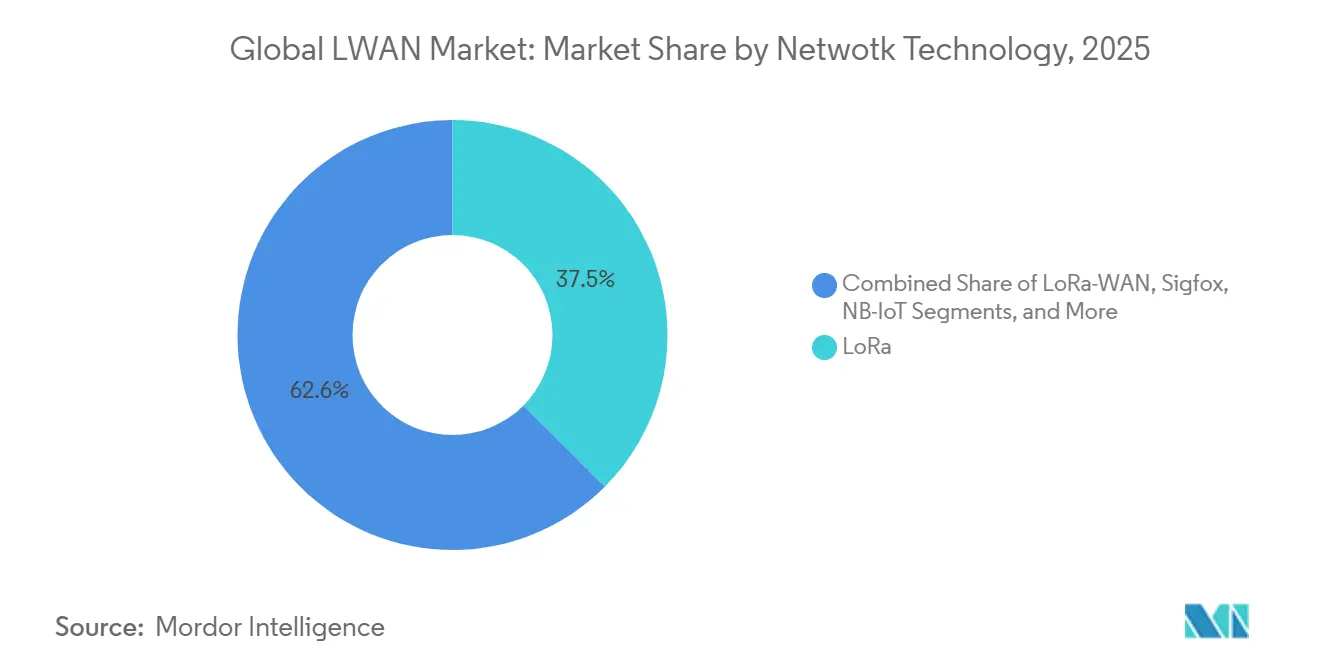
Demand accelerates as 5G RedCap modules reach commercial availability, satellite–terrestrial hybrids close rural coverage gaps, and critical-infrastructure operators double down on digital resilience after recent supply-chain shocks. Asia Pacific leads with 33.45% 2025 revenue share and shows the fastest regional expansion at 30.75% CAGR on the back of China’s mass NB-IoT deployments and India’s smart-city rollouts. LoRa held the largest 2025 technology slice at 37.45%, yet 5G RedCap is gaining momentum with 28.84% CAGR as enterprises seek lower latency and higher bandwidth. Hardware still represents 47.35% of outlays, though platform services are scaling at 29.65% CAGR as organizations seek unified connectivity and device-management environments
Key Report Takeaways
- By network technology, LoRa captured 37.45% of the LWAN market share in 2025, whereas 5G RedCap connections are forecast to expand at a 28.84% CAGR through 2031.
- By component, hardware accounted for 47.35% of the LWAN market size in 2025, while platform services recorded the highest projected growth at 29.65% CAGR.
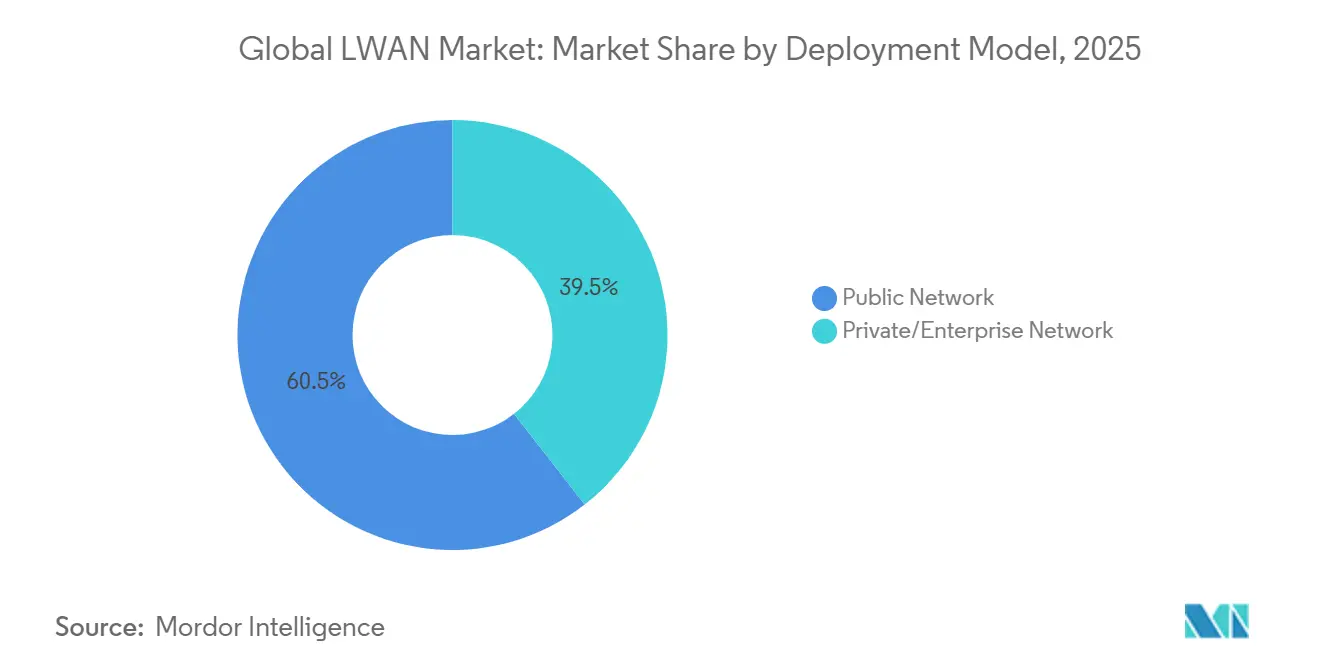
- By deployment model, public networks held 60.55% revenue share in 2025, yet private enterprise networks are advancing at a 30.20% CAGR to 2031.
- By end-user industry, utilities led with 25.95% of LWAN market share in 2025, whereas healthcare is poised for a 28.60% CAGR over the forecast period.
- By geography, Asia Pacific generated 33.45% of 2025 revenue and remains the fastest-growing region with a 30.75% CAGR through 2031.
Note: Market size and forecast figures in this report are generated using Mordor Intelligence’s proprietary estimation framework, updated with the latest available data and insights as of 2026.
Global LWAN Market Trends and Insights
Drivers Impact Analysis*
| Driver | % Impact on CAGR Forecast | Geographic Relevance | Impact Timeline |
|---|---|---|---|
| Digital transformation & Industry 4.0 acceleration | +6.3% | North America & EU industrial corridors, expanding to APAC | Long term (≥ 4 years) |
| Regulatory smart-meter mandates (water, gas, power) | +3.7% | EU, Australia, select US states | Short term (≤ 2 years) |
| Migration from 2G/3G freeing LTE bands for NB-IoT | +4.8% | Global, particularly China and India | Medium term (2-4 years) |
| Satellite-LPWAN hybrid constellations unlock remote coverage | +2.2% | Rural regions globally, Arctic/Antarctic applications | Long term (≥ 4 years) |
| Source: Mordor Intelligence | |||
Digital Transformation and Industry 4.0 Acceleration
Manufacturing groups are shifting from wired or Wi-Fi systems to LWAN connectivity to enable predictive maintenance and real-time asset tracking across dispersed facilities. A testbed operated by Ericsson, UScellular, and Rockwell Automation reached sub-10 ms latency for supervisory control using private 5G, proving that low-latency LWAN deployments can meet stringent industrial requirements. Energy-intensive operators such as Fair Cape Dairies have fitted LTE routers for generator monitoring, mitigating production risks during power outages. China Mobile Research Institute highlights integrated computing-and-networking as a top trend, demonstrating how edge analytics lower bandwidth demand while improving shop-floor responsiveness. The same architecture underpins the fast-growing adoption of AI-driven analytics platforms that extract value from machine data in situ, shortening decision loops. These advances form the backbone of multi-billion-dollar productivity gains projected across connected factories by 2025.
Regulatory Smart-Meter Mandates (Water, Gas, Power)
Policy-driven rollouts guarantee baseline LWAN demand. Australia requires full smart-meter deployment by 2030, obliging distribution network service providers to file formal replacement plans by December 2025. Yorkshire Water’s contract for 1.3 million LoRaWAN meters ranks among Europe’s largest LPWAN projects and underscores confidence in network scalability[2]Anna Karlsson, “Yorkshire Water Picks Netmore for 1.3 Million Meters,” netmoregroup.com. SWEPCO’s 234,000-meter program in Louisiana exemplifies how utilities use 15-minute interval data to refine billing and outage management. As rollouts grow, unit installation costs decline, reinforcing adoption curves and stimulating complementary analytics services. Device and data-management platforms that bundle metering, power-quality, and customer-engagement features thus see elevated growth prospects.
Migration from 2G/3G Freeing LTE Bands for NB-IoT
Global sunset programs for legacy cellular standards are reallocating spectrum to NB-IoT and LTE-M. China’s Ministry of Industry and Information Technology issued guidelines to accelerate NB-IoT coverage for smart-city services, citing ultra-wide reach and ultra-low power operation. AT&T ended NB-IoT plan sales in 2024 and steered clients toward LTE-M for richer data services, illustrating the regional divergence between Chinese NB-IoT continuity and Western LTE-M preference. Spectrum re-farming improves indoor and underground coverage, offering mining or tunnel operators robust links where traditional signals fade. Although temporary fragmentation persists, device vendors eventually benefit from scale economies once fewer standards dominate.
Satellite-LPWAN Hybrid Constellations Unlock Remote Coverage
Semtech’s HL78 modules now integrate non-terrestrial connectivity through a Skylo partnership, allowing devices to maintain service when terrestrial networks disappear. Actility and Wyld Networks are rolling out similar hybrid solutions for agriculture, ensuring end-to-end visibility in sparsely covered regions. Research published in MDPI’s Electronics journal shows that very-low-earth-orbit satellites coupled with LoRa achieve an optimal cost-to-coverage ratio for global IoT. Hybrid architecture extends asset-tracking, maritime monitoring, and environmental sensing, while retaining LWAN’s hallmark low-battery drain. As constellation economics improve, such architectures push the LWAN market into geographies previously deemed commercially unreachable.
Restraints Impact Analysis*
| Restraint | % Impact on CAGR Forecast | Geographic Relevance | Impact Timeline |
|---|---|---|---|
| Rising cybersecurity and privacy concerns for massive IoT | -3.80% | Global, particularly regulated industries | Short term (≤ 2 years) |
| RF front-end supply shortages are delaying module shipments | -3.20% | Global, concentrated in the Asia Pacific manufacturing | Short term (≤ 2 years) |
| Source: Mordor Intelligence | |||
Rising Cybersecurity and Privacy Concerns for Massive IoT
Billions of low-cost sensors widen the attack surface quicker than many security teams can respond. Analyses in Frontiers in Computer Science list default passwords, weak encryption, and stale firmware among the most common vulnerabilities, each magnified at scale. Healthcare regulators add pressure by demanding airtight protections for patient data gathered through remote monitoring devices. As 6G pilots emerge, processing loads and attack vectors grow, further stressing legacy detection tools. Enterprises are pivoting to zero-trust architectures paired with AI threat analytics, yet cost and talent shortages slow rollouts. The result is a drag on deployment velocity, particularly in data-sensitive verticals.
RF Front-End Supply Shortages Delaying Module Shipments
China supplied 98% of global gallium in 2022, and export controls have since driven 300% price spikes, inflating GaN amplifier costs critical to energy-efficient 5G and LWAN radios. Qorvo’s earnings miss illustrates how module vendors face both volume constraints and margin compression. Silicon-carbide bottlenecks add complexity, with Wolfspeed’s financial woes clouding long-term availability for power-management components. Analysts expect partial normalization in early 2025 once new refining capacity and supplier diversification schemes absorb demand, yet spot shortages of legacy components will linger. Vendor investments in predictive analytics and multi-sourcing mitigate risk but raise capital requirements.
*Our forecasts treat driver/restraint impacts as directional, not additive. The impact forecasts reflect baseline growth, mix effects, and variable interactions.
Segment Analysis
By Network Technology: 5G RedCap Emerges as Enterprise Standard
The segment generated the largest portion of the LWAN market size, with LoRa delivering 37.45% revenue in 2025 and 5G RedCap logging the highest 28.84% CAGR to 2031. Semtech secured 5G RedCap certification with AT&T for the EM8695 module, cutting power draw by 65% versus LTE alternatives and aligning with enterprise sustainability goals. NB-IoT remains vigorous in China, backed by ministry guidelines that reinforce its role in smart-city rollouts. LTE-M gains favor in North America for mobile asset applications as operators pivot from NB-IoT. Sigfox, now under UnaBiz, is recalibrating for niche deployments, while RPMA retains traction in mining, where ultra-reliability outranks bandwidth needs. RedCap connections are projected to surge from 27.6 million in 2023 to 963.5 million by 2030, ushering in a new baseline for mid-bandwidth IoT. As standards narrow, vendors can optimize silicon pipelines and slash certification overheads, thereby accelerating time-to-market for emerging devices.
Interoperability remains a short-term hurdle because fleets often run mixed protocols during migration cycles. System integrators are packaging multi-mode modules to smooth transitions, lessening costly truck-rolls for sensor swaps. This strategy underpins enterprise confidence in long-term return on connectivity investment, ensuring the LWAN market continues its rapid transition toward fewer but more capable air interfaces.


By Component: Platform Services Drive Integration Value
Hardware still accounts for 47.35% of the LWAN market share in 2025, reflecting ongoing demand for modules, gateways, and antennas. Yet platform services have become the fastest-growing component at 29.65% CAGR as businesses look for integrated device-life-cycle management and real-time analytics. AT&T’s Global SIM Advanced marries eSIM orchestration with centralized monitoring, illustrating how telecommunications groups reposition from hardware toward recurring platform revenue. Semtech’s AI-enabled security stack automates anomaly detection, lowering operational overhead for distributed fleets.
Professional services growth picks up because legacy process equipment often requires customized gateways and protocol translation. Managed service offers appeal to smaller firms lacking deep IoT expertise, bundling connectivity, cloud storage, and analytics under a single SLA. Vendors see higher customer-lifetime value as clients expand device counts once pilot projects prove ROI, reinforcing the resilience of software-centric revenue streams in the LWAN market.
By Deployment Model: Private Networks Gain Enterprise Preference
Public infrastructure represented 60.55% of the LWAN market size in 2025, thanks to ubiquitous cellular footprints. However, private LWAN deployments post a 30.20% CAGR because enterprises value data sovereignty, deterministic performance, and custom QoS policies. Deutsche Telekom’s Bridge Alliance tie-up widens access to private network services across 35 operators, simplifying multinational implementations. Hospitals such as the Cleveland Clinic leverage private 5G to maintain sub-10 ms latency for remote diagnostics, proving the model’s clinical relevance.
Hybrid architectures grow as cost-sensitive users offload non-critical telemetry onto public networks while reserving private slices for sensitive workloads. Edge-compute nodes positioned inside private domains cut backhaul costs and reduce cloud round-trip delays. As regulations tighten around cross-border data flows, industry analysts expect the LWAN market to tilt further toward private deployments, particularly in manufacturing and healthcare.
By End-User Industry: Healthcare Drives Innovation Adoption
Utilities retained 25.95% of the LWAN market share in 2025, anchored by mandated smart-meter programs. Healthcare now shows the fastest 28.60% CAGR through 2031 as remote patient monitoring shifts from pilot to mainstream. Over 60 million Americans are expected to use RPM solutions in 2024, up from 50 million the prior year. Singapore’s National University Health System runs Holomedicine programs over a hybrid 5G, highlighting the sector’s appetite for bandwidth-constrained mixed-reality tools.
Industrial manufacturing accelerates through predictive-maintenance LoRaWAN sensors, while transportation relies on LTE-M trackers to reinforce supply-chain resilience. Agriculture benefits from satellite-LPWAN hybrids to monitor soil moisture in sparsely covered fields. Such cross-vertical diversity safeguards the LWAN market against cyclical shocks in any single segment and propels continuing innovation.
Geography Analysis
Asia Pacific generated 33.45% of 2025 revenue and stands out with a 30.75% CAGR to 2031, driven by government-sponsored 5G and NB-IoT infrastructure. China Mobile alone operated more than 805 million 5G users and posted 20.8% smart-home revenue growth to RMB 100.5 billion in 2024. Massive state backing underpins dense base-station rollouts, while India’s Smart Cities Mission funnels capital toward city-wide sensor grids. Vietnam’s nationwide LoRaWAN agreement between VIoT and Actility further exemplifies regional commitment.
North America remains a premium enterprise market focused on LTE-M and nascent 5G RedCap. AT&T’s NB-IoT exit spurred module migrations but also catalyzed innovation around private 5G campuses, especially in logistics hubs and healthcare centers. Federal Communications Commission authorization of very-low-power 6 GHz operations from May 2025 expands unlicensed spectrum for IoT and stimulates fresh device categories.
Europe balances strong LoRaWAN uptake with regulatory-driven smart-meter schemes. Partnerships such as Netmore and Cellnex UK extend carrier-grade LoRaWAN across metropolitan clusters, lowering barriers for utility and industrial clients. Middle East and Africa see early reliance on satellite hybrids to cover oil pipelines and desert agriculture, though deployment volumes trail other regions. Overall, geographic variance in spectrum policy and industrial structure sustains heterogeneous demand patterns that insulate the LWAN market from uniform slowdowns.

Competitive Landscape
The LWAN market shows moderate fragmentation because no single technology standard dominates every use-case. Semtech anchors the LoRa ecosystem and is diversifying into 5G modules; its RedCap certification with AT&T positions the firm for mid-tier IoT growth semtech.com. Qualcomm’s acquisition of Sequans’ LTE portfolio enlarges its low-power cellular offering for industrial sensors. Patent filings by Meta around spectrum management underline the active R&D race among hyperscalers seeking edge-compute leverage.
Platform integration capacity is now a key competitive yardstick. Twilio and Comcast’s MachineQ bundle connectivity, device management, and cloud functions to shorten enterprise onboarding cycles. Actility’s alliances with Kerlink and Rubicon Water illustrate how vertically focused collaborations can open new white spaces in agriculture and utilities. AI-based security features, such as anomaly detection built into Semtech’s network server, create differentiation beyond radio hardware alone.
Ecosystem dynamics also hinge on supply-chain agility. Companies with multisource strategies for gallium, silicon-carbide, and passive components are better positioned to weather short-term shocks, protecting shipment schedules for module customers. The upshot is an LWAN market where end-to-end solution providers elevate their standing relative to pure-play component suppliers, setting the stage for further consolidation.
LWAN Industry Leaders
UnaBiz (Sigfox)
Semtech Corp.
Ingenu Inc.
Actility S.A.
AT&T
- *Disclaimer: Major Players sorted in no particular order

Recent Industry Developments
- January 2025: Semtech achieved 5G RedCap certification with AT&T for the EM8695 module, enabling 65% lower power draw than comparable LTE units.
- March 2025: AT&T launched Global SIM Advanced, an eSIM product with multi-profile functionality for seamless global IoT transitions.
- March 2025: Semtech began sampling HL781x LPWA modules with integrated Skylo satellite links to extend coverage for remote deployments.
- September 2024: Yorkshire Water selected Netmore to replace 1.3 million water meters with LoRaWAN units, one of Europe’s largest LPWAN undertakings.


Research Methodology Framework and Report Scope
Market Definitions and Key Coverage
Our study defines the low-power wide-area network (LPWAN) market as all public or private wireless networks and related hardware, platforms, and managed services that enable long-range, ultra-low-power connectivity for devices exchanging small data packets, including LoRa/LoRaWAN, Sigfox, NB-IoT, LTE-M, RPMA, and emerging 5G NR-RedCap technologies. Coverage spans modules, gateways, cloud platforms, and services sold to utilities, smart city projects, industrial and consumer IoT users worldwide.
Scope exclusion: satellite IoT constellations that operate outside terrestrial LPWAN standards are not counted.
Segmentation Overview
- By Network Technology
- LoRa
- LoRa-WAN
- Sigfox (Ultra-Narrowband)
- NB-IoT
- LTE-M
- RPMA (Ingenu)
- 5G NR-RedCap
- By Component
- Hardware (Modules, Gateways, Antennas)
- Platform (Connectivity Mgmt., Device Mgmt., Data Mgmt.)
- Services (Professional, Managed)
- By Deployment Model
- Public Network
- Private/Enterprise Network
- By End-User Industry
- Utilities
- Smart City Infrastructure
- Smart Homes and Consumer IoT
- Industrial and Manufacturing
- Transportation and Logistics
- Agriculture
- Healthcare
- Other End-User Industries
- By Geography
- North America
- United States
- Canada
- Mexico
- South America
- Brazil
- Argentina
- Rest of South America
- Europe
- Germany
- United Kingdom
- France
- Spain
- Rest of Europe
- Asia-Pacific
- China
- India
- Japan
- South Korea
- Rest of Asia-Pacific
- Middle East and Africa
- Middle East
- Saudi Arabia
- United Arab Emirates
- Rest of Middle East
- Africa
- South Africa
- Rest of Africa
- Middle East
- North America
Detailed Research Methodology and Data Validation
Primary Research
Mordor analysts interviewed mobile network operators across North America, Europe, and Asia-Pacific, module makers in Shenzhen and Taipei, and system integrators serving smart-meter and asset-tracking rollouts. Expert conversations clarified deployment costs, expected replacement cycles, and regional spectrum roadmaps, filling critical gaps spotted during secondary research.
Desk Research
Our team began with public datasets from tier-1 bodies such as the ITU, GSMA Intelligence, FCC, ETSI, and the World Bank for spectrum, connection counts, and macro IoT indicators. Industry associations like the LoRa Alliance and 3GPP working groups provided technology adoption benchmarks, while patent analytics from Questel signaled innovation density. Company 10-Ks, operator filings, and device vendor price lists helped anchor average selling prices (ASPs). Dow Jones Factiva and government procurement portals supplied shipment references. The sources listed illustrate, not exhaust, the broad pool examined by Mordor analysts.
Market-Sizing & Forecasting
We applied a top-down connection-based reconstruction that starts with reported LPWAN subscriber lines, spectrum licenses, and smart-meter mandates, which are then multiplied by device replacement and shipped-unit ratios to yield volume pools. These totals were corroborated through selective bottom-up checks, sampled module shipments and operator revenue splits, to fine-tune ASPs. Key variables tracked include average battery life, gateway density per square kilometer, regulatory meter deadlines, chipset cost curves, seasonal farm-sensor demand, and 2G/3G sunset timelines. A multivariate regression model, validated through scenario analysis, projects the impact of these drivers on connections and revenue through 2030. Data gaps in bottom-up samples were bridged using regional interpolation anchored to verified operator growth rates.
Data Validation & Update Cycle
Outputs pass anomaly screens, variance thresholds, and peer review before sign-off. Models are refreshed annually, with interim updates triggered by material events such as new spectrum auctions or abrupt module price shifts. A final analyst pass occurs just before report release to ensure clients receive the latest view.
Why Mordor's Global LWAN Baseline Commands Reliability
Published estimates often diverge because firms choose different network scopes, price bases, and refresh cadences.
Key gap drivers include: some studies tracking only connectivity revenue, others merging satellite IoT, or applying static ASPs despite rapid module deflation; a few project aggressive penetration without testing against national smart-meter rollout timetables, while Mordor refreshes its model each year and converts all inputs to constant 2024 USD before aggregation.
Benchmark comparison
| Market Size | Anonymized source | Primary gap driver |
|---|---|---|
| USD 48.01 B (2025) | Mordor Intelligence | - |
| USD 27.65 B (2025) | Global Consultancy A | Excludes private LPWAN deployments; assumes flat ASPs |
| USD 20.40 B (2024) | Regional Consultancy B | Omits platform and managed-service revenue |
| USD 16.90 B (2025) | Industry Association C | Counts only unlicensed technologies, ignores NB-IoT/LTE-M |
Taken together, the comparison shows how scope choices and price assumptions can swing totals widely, whereas Mordor's disciplined mix of verified connection counts, dynamic ASP tracking, and annually refreshed inputs delivers a balanced, transparent baseline that decision-makers can rely on.


Key Questions Answered in the Report
What is the current value of the LWAN market?
The LWAN Market stood at USD 32.67 billion in 2026 and is forecast to reach USD 109.21 billion by 2031 at a 27.30% CAGR during the forecast period (2026-2031).
Which region leads LWAN adoption?
Asia Pacific holds the lead with 33.45% 2025 revenue share and is also the fastest-growing area, expanding at a 30.75% CAGR through 2031.
Why are private LWAN networks gaining traction?
Enterprises prefer private deployments for data sovereignty, deterministic performance, and the ability to tailor quality-of-service profiles to mission-critical applications.
Which technology segment is expanding the fastest?
5G RedCap posts the highest forecast CAGR at 28.84% because it delivers higher bandwidth and lower latency while maintaining low-power credentials.
How do regulatory mandates influence the LWAN market?
Government smart-meter programs in regions such as Australia and the EU create guaranteed demand, accelerating utility adoption and driving platform service revenues.
What is the main challenge to scaling massive IoT deployments?
Rising cybersecurity and privacy concerns remain a principal restraint, trimming an estimated 6.8% from the industry CAGR as organizations invest in more robust defenses.
Page last updated on:


