
Market Overview
| Study Period | 2021 - 2031 |
|---|---|
| Market Size (2026) | USD 3.65 Billion |
| Market Size (2031) | USD 5.12 Billion |
| Growth Rate (2026 - 2031) | 7.01 % |
| Fastest Growing Market | Asia-Pacific |
| Largest Market | Asia Pacific |
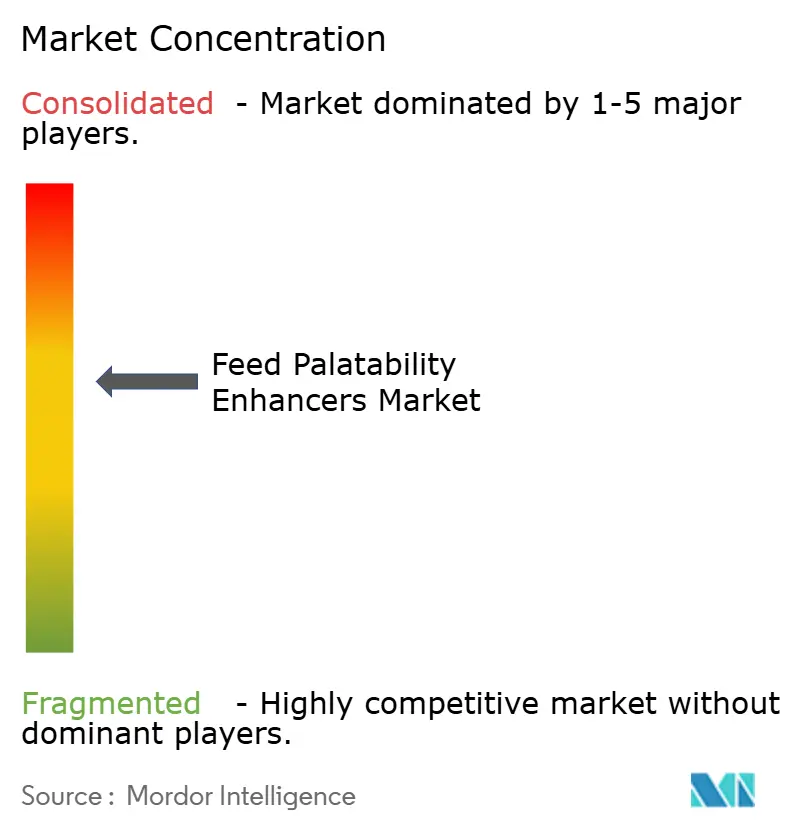
| Market Concentration | Medium |
Major Players *Disclaimer: Major Players sorted in no particular order Image © Mordor Intelligence. Reuse requires attribution under CC BY 4.0. | |
Feed Palatability Enhancers Market Analysis by Mordor Intelligence
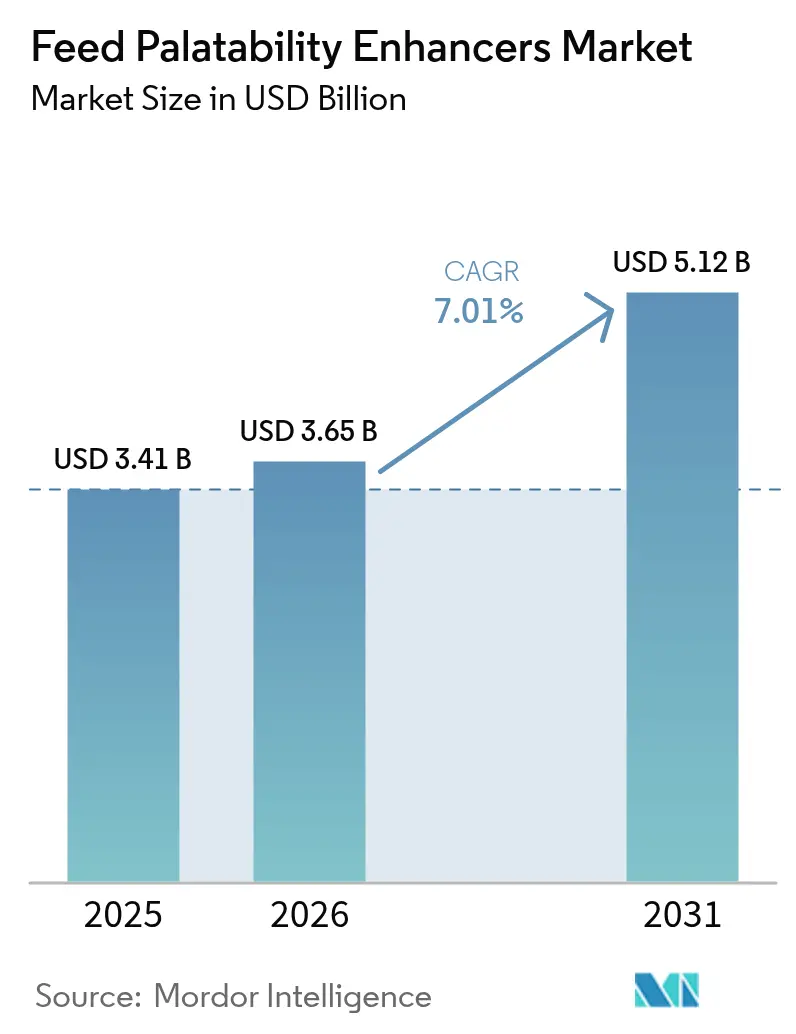
The feed palatability enhancers market size is expected to grow from USD 3.41 billion in 2025 to USD 3.65 billion in 2026 and is forecast to reach USD 5.12 billion by 2031 at 7.01% CAGR over 2026-2031. Robust growth stems from the global push for antibiotic-free livestock, rapid aquaculture intensification, and premiumization trends in pet nutrition, which increase the inclusion rates of sensory additives in finished feeds. European regulatory precedents banning antibiotic growth promoters have been copied across Southeast Asia and parts of South America, compelling producers to lean on flavors, sweeteners, and aroma enhancers to sustain feed intake. The Asia-Pacific region drives incremental volume growth as China, Vietnam, and India modernize their livestock systems, while North America and Europe anchor value growth in the pet segment, where formulation complexity increases palatable loading to more than 2% in ultra-premium wet diets. Suppliers with vertical integration into yeast fermentation and botanical extraction enjoy margin insulation against raw material spikes, whereas smaller regional players are exiting after volatile yeast and protein-hydrolysate prices erode profitability. Heat-stable encapsulation and blockchain traceability are now key differentiators, supporting premium price points among customers who demand clean-label verification.
Key Report Takeaways
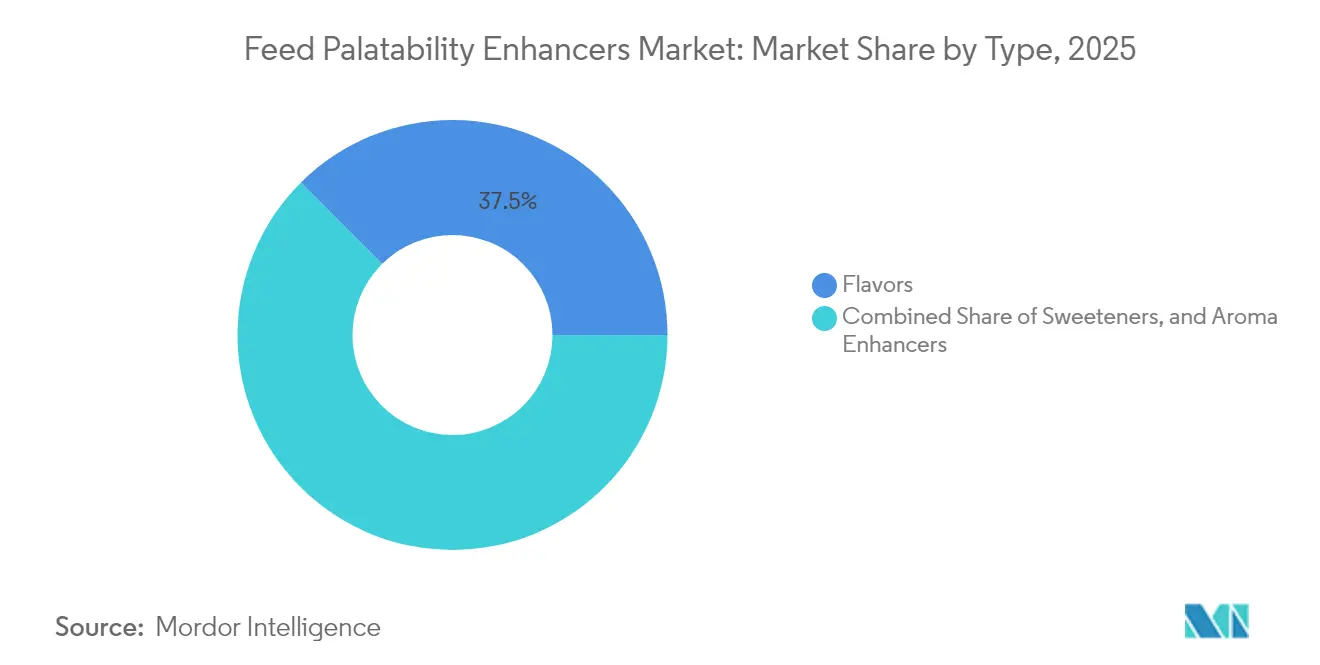
- By product type, flavors led the feed palatability enhancers market, accounting for a 37.45% share in 2025, and are projected to expand at a 7.16% CAGR through 2031.
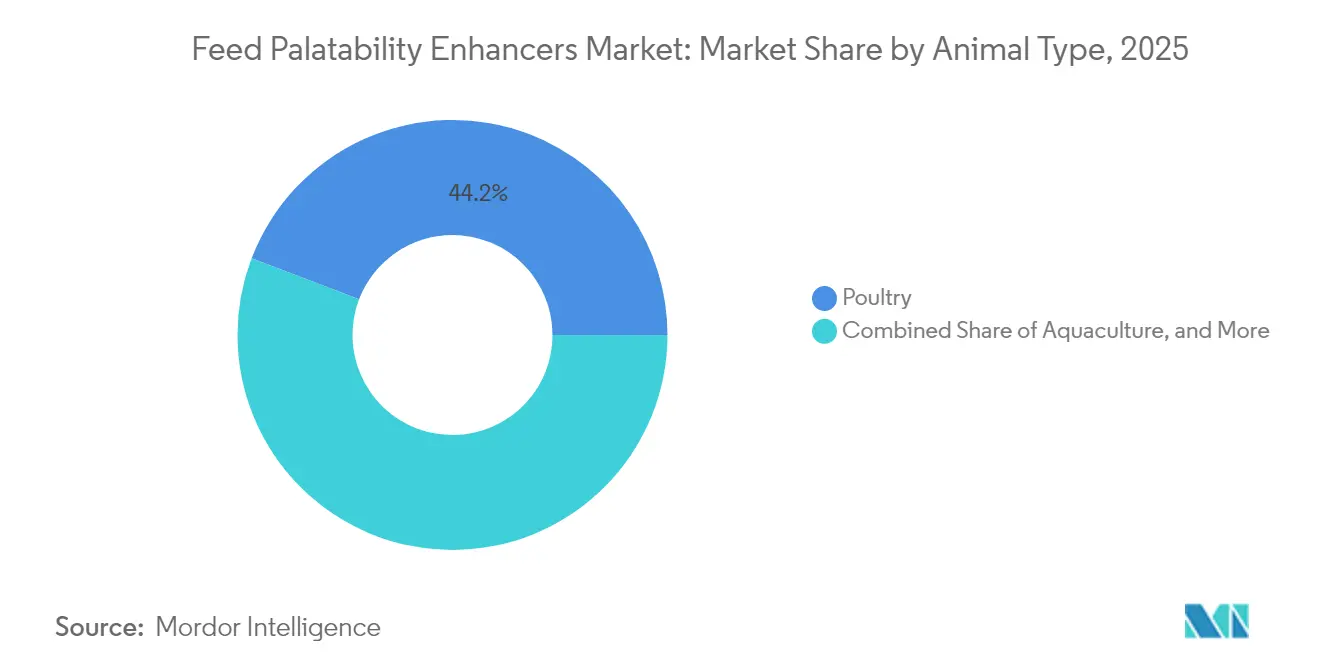
- By animal type, poultry accounted for 44.20% of the feed palatability enhancers market share in 2025, while aquaculture records the fastest growth at a 9.62% CAGR through 2031.
- By geography, the Asia-Pacific region led the feed palatability enhancers market, holding a 33.60% share in 2025, with a projected CAGR of 8.34% through 2031.
Note: Market size and forecast figures in this report are generated using Mordor Intelligence’s proprietary estimation framework, updated with the latest available data and insights as of 2026.
Market Trends and Insights
Drivers Impact Analysis of Feed Palatability Enhancers Market*
| Driver | (~) % Impact on CAGR Forecast | Geographic Relevance | Impact Timeline |
|---|---|---|---|
| Rising demand for antibiotic-free livestock production | +1.5% | Global, strongest in Europe Union and North America | Medium term (2-4 years) |
| Premiumization and humanization of pet nutrition | +1.2% | North America and Western Europe, spreading to urban Asia-Pacific | Short term (≤ 2 years) |
| Expansion of precision-feeding platforms in poultry and swine | +1.0% | North America, Europe and intensive Asian operations | Medium term (2-4 years) |
| Rapid aquaculture intensification in Asia-Pacific | +1.3% | Asia-Pacific with spillover to South America and Middle East | Long term (≥ 4 years) |
| Heat-stable natural flavor technologies for pelleted feeds | +0.6% | Global, early adoption in premium segments | Medium term (2-4 years) |
| Blockchain-enabled raw-material traceability boosting clean-label claims | +0.4% | North America and Europe Union leadership, gradual Asia-Pacific uptake | Long term (≥ 4 years) |
| Source: Mordor Intelligence | |||
Rising Demand for Antibiotic-Free Livestock Production
Regulatory bans on antibiotic growth promoters have created a structural tailwind for palatability enhancers by forcing producers to maintain feed intake through sensory appeal rather than pharmaceutical appetite stimulation. The United States Food and Drug Administration's Veterinary Feed Directive, implemented in 2017 and tightened in 2023, restricts medically important antibiotics in feed, pushing integrators toward flavor-based solutions that preserve daily weight gain [1]Source: European Food Safety Authority, “Scientific Opinion 2024,” efsa.europa.eu . In Thailand, the Department of Livestock Development reported a 22% increase in palatant adoption among contract broiler growers between 2023 and 2024, correlating with the country's phase-out of colistin and zinc bacitracin. This regulatory momentum is now extending to India, where the Food Safety and Standards Authority of India proposed antibiotic restrictions in compound feeds for poultry and aquaculture in late 2024, potentially unlocking a market serving 850 million birds annually.
Premiumization and Humanization of Pet Nutrition
Pet owners increasingly treat companion animals as family members, demanding ingredient transparency and gourmet flavor profiles that mirror human food trends. Nielsen data for 2024 indicate that super-premium pet food sales in the United States grew 14% year-over-year, with wet diets commanding a 32% price premium over dry kibble, driven largely by palatant-enhanced gravies and broths. Kerry Group's Taste and Nutrition division launched a range of fermented fish-protein palatants in early 2025, specifically targeting the feline wet-food segment, citing consumer willingness to pay USD 0.40 more per 85-gram pouch for products labeled no artificial flavors. This humanization extends to treats, where Kemin Industries introduced a palatable system in mid-2024 that replicates the umami profile of aged cheeses, addressing the premiumization of training rewards and dental chews.
Expansion of Precision-Feeding Platforms in Poultry and Swine
Internet-of-Things sensors and data analytics enable real-time adjustments to palatable dosing, optimize feed intake curves across production cycles, and reduce waste. Cargill's FeedWatch platform, deployed in over 200 United States broiler houses by the end of 2024, uses weight-gain algorithms to modulate flavor intensity during heat-stress periods, reportedly improving feed conversion by 0.04 points during summer months. In Denmark, the Danish Agriculture and Food Council documented that precision-fed sows consumed 3.2% more lactation feed when palatable levels were dynamically increased during peak milk production, translating to heavier weaning weights and shorter farrowing intervals. These precision tools are shifting pallets from commodity additives to performance-optimization levers, particularly in high-throughput operations where marginal gains compound into significant competitive advantages.
Rapid Aquaculture Intensification in Asia-Pacific
High-density fish and shrimp farming in Asia-Pacific demands water-stable palatants that resist leaching and maintain attractiveness under submerged conditions, driving formulation innovation and volume growth. Vietnam's shrimp aquaculture sector expanded production by 11% in 2024, reaching 950,000 metric tons. Feed manufacturers reported that palatable inclusion rates in shrimp diets increased from 1.5% to 2.0% to compensate for stress-induced appetite suppression in recirculating aquaculture systems. China's Ministry of Agriculture and Rural Affairs set a target of 70 million metric tons of aquaculture output by 2030, with palatants identified as a critical enabler for achieving the 6% annual growth required to meet domestic protein demand. Adisseo's aqua-specific palatant sales increased by 19% in 2024, driven by adoption in tilapia and pangasius operations across Southeast Asia, where rising feed costs are prompting producers to maximize intake efficiency.
Restraints Impact Analysis of Feed Palatability Enhancers Market*
| Restraint | (~) % Impact on CAGR Forecast | Geographic Relevance | Impact Timeline |
|---|---|---|---|
| Volatile prices of botanical and protein-hydrolysate inputs | −0.8% | Global, acute in single-source import regions | Short term (≤ 2 years) |
| Stringent regional approvals for synthetic sweeteners | −0.6% | Europe and Asia-Pacific experience longest lead times | Medium term (2-4 years) |
| Supply-chain disruptions for specialty amino acids | −0.5% | Global, production concentration in China and Southeast Asia | Short term (≤ 2 years) |
| Consumer skepticism toward chemical aromas in premium pet food | −0.4% | North America and Western Europe leadership | Medium term (2-4 years) |
| Source: Mordor Intelligence | |||
Volatile Prices of Botanical and Protein-Hydrolysate Inputs
Weather-driven crop failures and export restrictions are inflating costs for key palatable raw materials, compressing margins, and forcing suppliers to reformulate or pass through price increases that dampen demand. Yeast-extract prices rose 22% between January and September 2024, driven by Brazilian sugarcane shortages that reduced molasses availability, a primary feedstock for fermentation-based palatants. Rosemary-extract quotations surged 31% in early 2024 after drought in Spain's Andalusia region cut harvest volumes by 40%, disrupting supply chains for natural pet food palatants. Smaller palatant producers lacking vertical integration into raw-material sourcing face acute pressure, with several regional suppliers in Southeast Asia exiting the market in 2024 after failing to secure long-term contracts for yeast and hydrolysate supplies.
Stringent Regional Approvals for Synthetic Sweeteners
Divergent regulatory frameworks for synthetic palatants create multi-year approval timelines and fragment product portfolios, delaying launches and increasing compliance costs. The European Food Safety Authority's 2024 re-evaluation of neohesperidin dihydrochalcone, a synthetic sweetener widely used in swine feeds, extended the approval process by 18 months due to new toxicology data requirements, forcing suppliers to reformulate products for the Europe Union market. China's Ministry of Agriculture maintains a positive list of approved feed additives, which excludes several synthetic sweeteners permitted in the United States [2]Source: China Feed Industry Association, “Annual Report 2024,” chinafeed.org.cn. This requirement means that multinational suppliers must maintain parallel formulation platforms and inventory systems. These approval bottlenecks are accelerating investment in natural alternatives, even where synthetic options offer superior cost-performance, as suppliers seek to avoid regulatory risk.
*Our forecasts treat driver/restraint impacts as directional, not additive. The impact forecasts reflect baseline growth, mix effects, and variable interactions.
Feed Palatability Enhancers Market Segment Analysis
By Type:
Flavor Innovation Drives DifferentiationThe flavors category accounted for 37.45% of the feed palatability enhancers market size in 2025 and is projected to grow at a 7.16% CAGR through 2031. Flavors remain the dominant category due to their versatility across species and feed formats. Flavor systems mask bitter notes from high-protein diets and stimulate olfactory receptors across species. Kerry Group's 2024 product pipeline included 12 new flavor systems targeting specific life stages in poultry, such as a starter-diet flavor designed to ease the transition from pre-starter to grower rations, addressing a pain point where intake dips often trigger long-term performance penalties .
Texturants, often based on hydrocolloids or modified starches, are being co-formulated with flavors to create palatable systems that improve pellet durability while masking off-notes from high-inclusion alternative proteins such as insect meal or single-cell proteins. BASF's 2024 launch of a combined flavor-texturant for pet treats addressed the dual challenge of palatability and dental-chew hardness, capturing share in a segment where functionality and sensory appeal must coexist. Blended formulations, which combine synthetic backbones with natural top-notes, are emerging as a pragmatic middle ground, offering cost efficiency while meeting no artificial flavors claims through careful regulatory interpretation.



By Animal Type:
Aquaculture Acceleration Reshapes Demand MixPoultry retained 44.20% of the feed palatability enhancers market in 2025, reflecting the sector's scale, with global broiler production exceeding 100 million metric tons annually and palatants used to optimize starter-diet intake and mitigate heat-stress-related feed refusals. Palatant inclusion in starter feeds improved 7-day weights by 3.2% at a major United States integrator. Tyson Foods disclosed in its 2024 sustainability report that palatant inclusion in broiler starter feeds improved 7-day body weights by 3.2%, a gain that compounds through the 42-day grow-out cycle to deliver an additional 60 grams of live weight per bird.
Aquaculture records the fastest growth at a 9.62% CAGR through 2031, driven by species diversification beyond salmon and shrimp, with tilapia, pangasius, and marine finfish operations adopting palatants to improve feed conversion in recirculating and offshore systems. Nutreco's Skretting division reported that its palatable sales to land-based salmon farms in Norway grew 24% in 2024, as closed-containment systems require higher palatability to offset stress from controlled environments. In Ecuador, white-shrimp producers increased palatant inclusion rates from 1.2% to 1.8% in 2024 to combat early mortality syndrome, a disease that suppresses appetite and exacerbates production losses.
Geography Analysis
APAC Feed Palatability Enhancers Market
The Asia-Pacific region led the feed palatability enhancers market, holding a 33.60% share in 2025, with a projected CAGR of 8.34% through 2031, driven by China's livestock modernization, Vietnam's ambitions in shrimp exports, and India's expansion in the poultry sector. China's compound feed production reached 280 million metric tons in 2024, with palatable penetration rates in commercial feeds rising from 42% in 2020 to an estimated 58% in 2024 as integrators adopt nutritional strategies to replace banned antibiotics. Thailand's Charoen Pokphand Foods, the world's largest animal-feed producer, announced in mid-2024 that it would standardize palatable inclusion across its Asian poultry operations, a decision that affects over 20 million metric tons of annual feed output and signals mainstream acceptance of palatability enhancement.
North America and Europe Feed Palatability Enhancers Market
North America and Europe are expanding, with growth concentrated in the pet food and organic livestock segments, rather than in conventional poultry and swine. The United States Department of Agriculture reported that organic broiler production grew 11% in 2024, with organic-certified palatants becoming a prerequisite for maintaining certification under National Organic Program standards. In France, the poultry sector's shift toward slower-growing breeds, driven by animal welfare regulations, is increasing palatable demand as longer grow-out periods require sustained feed intake over 56-70 day cycles, versus conventional 35-42 day programs.
MEA Feed Palatability Enhancers Market
The Middle East and Africa are growing regions, driven by poultry-sector expansion in Saudi Arabia, Egypt, and South Africa, alongside nascent aquaculture development in Kenya and Nigeria. Saudi Arabia's Vision 2030 agricultural diversification strategy includes targets for 70% self-sufficiency in poultry meat, with palatants identified as a tool to improve feed efficiency in desert climates where heat stress depresses intake. Egypt's poultry sector, recovering from avian influenza outbreaks in 2023, experienced increased palatable adoption in 2024 as producers sought to accelerate flock rebuilding through improved starter diet performance.
Regulatory Landscape
Feed palatability enhancers are regulated primarily as feed additives, with the European Union treating many palatability inputs as sensory additives (flavouring compounds) under Regulation (EC) No 1831/2003, requiring pre-market authorization supported by safety and efficacy dossiers assessed by the European Food Safety Authority (EFSA) and authorized by the European Commission. This framework also drives periodic re-evaluations and renewals, creating long lead times for synthetic sweeteners and other novel palatants, and incentivizing suppliers to maintain parallel formulation and labeling approaches by region.
In 2026, the European Commission issued multiple Implementing Regulations relevant to palatability-related additive portfolios, including the renewal of fumaric acid authorization for all terrestrial animal species (Implementing Regulation (EU) 2026/171) and the authorization of L-isoleucine produced with a specified Escherichia coli strain for all animal species (Implementing Regulation (EU) 2026/1117). In the United States, market access continues to run through the FDA animal food ingredient pathways (including food additive petitions where applicable), while legislative activity such as the Innovative FEED Act of 2025 (S.1906) signals potential changes to how certain production-related substances could be categorized and reviewed.
Competitive Landscape
The feed palatability enhancers market exhibits moderate consolidation, with the top five players, Kerry Group plc, Associated British Foods plc, Symrise AG, Bluestar Adisseo Co. Ltd, and Kemin Industries Inc., accounting for a combined share in 2024. Kerry Group, Associated British Foods, and Symrise utilize vertical integration in fermentation and botanical extraction, enabling them to control raw material costs and tailor palatable profiles to regional taste preferences. Mid-tier specialists, such as Kemin Industries and Adisseo, compete on technical service depth, deploying field nutritionists who conduct on-farm palatability trials and adjust formulations based on real-time feed intake data.
Opportunities are emerging in species-specific palatants for aquaculture, where tilapia, pangasius, and marine finfish require distinct flavor profiles compared to established salmon and shrimp formulations. Technology is becoming a competitive differentiator, with suppliers investing in encapsulation platforms, precision-feeding analytics, and blockchain traceability to capture premium segments. Cargill's 2024 patent filing for a lipid-encapsulated palatant that releases flavor compounds in response to rumen pH demonstrates how incumbents are leveraging R&D depth to create performance moats.
Smaller regional players in Southeast Asia and South America are consolidating or exiting due to raw-material cost pressures and inability to meet evolving regulatory standards, with three notable acquisitions in 2024 involving European multinationals acquiring local palatant suppliers to secure distribution networks and customer relationships. Association of American Feed Control Officials ongoing review of palatant labeling standards, projected to conclude in 2025, may further consolidate the market by imposing compliance costs that favor larger, well-resourced suppliers. Emerging disruptors include precision-fermentation startups developing nature-identical palatants at synthetic-equivalent costs, a capability that could compress the natural-synthetic price gap and accelerate clean-label adoption.
Feed Palatability Enhancers Industry Leaders
Kerry Group plc
Symrise AG
Adisseo France SAS
Kemin Industries Inc.
Bluestar Adisseo Co. Ltd
- *Disclaimer: Major Players sorted in no particular order
Feed Palatability Enhancers Market Companies Covered in this Report
- Kerry Group plc
- Associated British Foods plc
- Symrise AG
- Bluestar Adisseo Co. Ltd
- Kemin Industries Inc.
- DSM-Firmenich AG
- BASF SE
- Cargill Incorporated
- ADM
- Nutreco N.V.
- Novus International Inc.
- Alltech Inc.
- Evonik Industries AG
- CJ CheilJedang Corporation
- DuPont de Nemours Inc.

Market Opportunities and Future Outlook
Premium pet food formulation complexity and regional capacity localization are creating whitespace for suppliers that can provide differentiated palatability systems with strong technical service and traceability. A concrete signal of investment is Symrise Pet Food commencing construction in June 2026 on a new facility in Rutherford, New South Wales, intended to manufacture palatability enhancers alongside health ingredients and protection solutions for Australasia and Southeast Asia; this supports shorter lead times, local customer collaboration, and reduced exposure to cross-border logistics shocks for specialty inputs.
Technology-led opportunities are opening around delivery formats and taste-generation tools that solve known limitations in pelleted feeds and wet pet applications, especially where bitterness masking and stability are critical. Gelteq Limited reported completion of veterinary palatability trials with Kemin Industries in June 2026 for a gel-based delivery platform designed to mask bitter pharmaceutical profiles in canine applications, highlighting adjacent demand for palatability-enabling systems beyond standard flavor blends. At the same time, ongoing EU implementing authorizations in 2026 for feed additives (for example, fumaric acid renewals and new authorizations such as L-isoleucine and xanthan gum for specified species groups) reinforce the need for regulatory-ready portfolios and strengthen the business case for natural or compliance-efficient alternatives where synthetic pathways face extended review timelines.
Recent Industry Developments in Feed Palatability Enhancers Market
- June 2026: Symrise broke ground on a new pet food ingredients production facility in Rutherford, New South Wales, Australia, to manufacture palatability enhancers along with related pet food health and protection solutions. The move strengthens local supply for Australasia and nearby export markets, helping customers reduce reliance on long-distance imports for specialty palatant systems.
- May 2026: Kerry introduced AlphaGal Ultra, a multi-enzyme solution positioned to increase nutrient availability from livestock feed. While not a palatant itself, the launch reflects continued formulation innovation in feed additives that can be co-optimized with palatability systems in precision-feeding programs focused on intake and efficiency.
- November 2024: An explosion at a major Chinese tryptophan production facility idled about 15% of global capacity and drove a sharp spot-price increase, forcing reformulation and margin trade-offs for manufacturers using amino-acid-linked palatability blends. The disruption highlighted concentration risk in specialty inputs and increased attention on alternative sourcing and more robust formulation platforms.


Feed Palatability Enhancers Market Report Scope and Research Methodology
Market Definition and Coverage
For this study, the feed palatability enhancers market is defined as additives used in animal feed to improve acceptance and intake by changing taste, smell, or overall eating experience, with results captured in value (USD) across major consuming regions.
Scope exclusions: The sizing excludes base feed ingredients and nutrition-only additives that do not have a direct palatability role, such as standard vitamin-mineral premixes, enzymes, and probiotics.
Segments Covered in This Report
- By Type
- Flavors
- Sweeteners
- Aroma Enhancers
- By Animal Type
- Poultry
- Swine
- Ruminant
- Aquaculture
- Other Animal Types
- By Geography
- North America
- United States
- Canada
- Mexico
- Rest of North America
- South America
- Brazil
- Argentina
- Rest of South America
- Europe
- Germany
- United Kingdom
- France
- Spain
- Italy
- Russia
- Rest of Europe
- Asia-Pacific
- China
- Japan
- India
- Australia
- Rest of Asia-Pacific
- Middle East
- Saudi Arabia
- United Arab Emirates
- Rest of Middle East
- Africa
- South Africa
- Egypt
- Rest of Africa
- North America
Data Sources, Market Sizing, and Validation
Desk Research
Desk research was used to set the market boundaries, build the first demand picture by species, and set realistic price bands by region. We leaned on public sources such as FAOSTAT for livestock and aquaculture production, USDA and EU agriculture releases for feed and animal numbers, and national statistics agencies for production and trade indicators that help explain feed volume movements. For regulatory and safety context that can change ingredient adoption, sources such as EFSA opinions and Codex guidance were checked, followed by association publications on feed additives and compound feed trends.
On the supply side, company filings, investor presentations, and reputable press coverage helped confirm capacity additions, product positioning, and regional exposure of key suppliers. We also used paid subscriptions for company financials and intelligence, plus a patent database to see where formulation activity was rising, and then cross-checked signals with import-export shipment level data when trade patterns were material. The desk research sources listed here are illustrative only, and many other public documents and datasets were also reviewed for data collection, validation, and clarification.
Primary Interviews and Surveys
Primary work was carried out to pressure-test the desk assumptions that most often drive the model, which are inclusion rules, typical dosage ranges by species, and price realization by region and form. We spoke with a mix of feed additive suppliers, premix and compound feed participants, and downstream users such as integrators, nutritionists, and procurement teams, covering APAC, EMEA, and the Americas so the inputs reflected real buying and formulation practices. When a data point varied by animal type or by local regulation, it was rechecked with another respondent group before the final model was locked.
Distribution of primary research fieldwork respondents
| Company type | Respondent position | Region |
|---|---|---|
| Top tier: 25% | CXOs: 18% | APAC: 41% |
| Mid tier: 57% | Functional/Unit leaders: 33% | EMEA: 34% |
| Smaller Players: 18% | Managers: 49% | Americas: 25% |
Market-Sizing & Forecasting
Market sizing was built using a top-down approach where global and regional feed demand pools were reconstructed from livestock and aquaculture production signals, and then translated into an addressable palatability enhancer demand using penetration assumptions by species and feed type. To keep the totals realistic, the result was corroborated using selective bottom-up approximations, mainly supplier and channel checks, plus sampled price per kg times estimated volume for common forms where feedback was consistent.
Key model inputs included compound feed production trends, animal population and output growth (meat, milk, eggs, and farmed fish), shifts toward antibiotic-free and premium feeding programs, typical inclusion rates by animal type, and regional price realization based on formulation mix and import dependence. Where data gaps existed, especially for smaller markets and niche animal categories, we applied conservative penetration ranges and then adjusted them only when primary feedback confirmed sustained usage.
Forecasts were developed using scenario analysis, where the base case followed expected animal output growth and feed manufacturing trends, and then the upside and downside were shaped by adoption speed in aquaculture and pet nutrition and by ingredient cost swings that affect reformulation. Assumptions were reviewed with interviewees so the final forecast stayed tied to practical purchase behavior rather than only historical trend lines.
Data Validation & Update Cycle
Outputs were validated through multiple checks, including year over year consistency reviews by region and animal type, price-volume sanity checks, and comparisons against independent signals such as compound feed production movement and livestock output changes. When a number looked out of pattern, the drivers were traced back to penetration, dosage, or pricing inputs, and then the assumption was either corrected or tagged as a genuine market shift after a follow-up check.
Before sign-off, the model goes through a step-by-step analyst review so calculation logic and unit conversions are consistent across regions. The report is refreshed annually, and interim updates are made when material events occur, such as major regulatory changes or sharp raw material price movements. Right before delivery, a final pass is completed to ensure the latest public data points and primary cues are reflected in the narrative and the numbers.
Mordor Intelligence's Global Feed Palatability Enhancers Market Market Size Measured Against Other Published Estimates
Published market values for feed palatability enhancers often do not match because each study makes its own decisions on what is counted and how quickly adoption is assumed to rise across species. Differences also show up when one source reports a historical base year and another reports a forward year, which can make the gap look larger than it really is.
The table shows that the spread is mainly explained by scope and timing choices, plus how prices and inclusion rates are projected. In Mordor Intelligence's model, only palatability-focused additives (flavors, sweeteners, and aroma enhancers) are counted, and the total is built by linking usage to animal type demand pools rather than bundling adjacent modifier categories that can inflate the value.
Benchmark comparison
| Source | Market Size | Gaps in Research Methodology |
|---|---|---|
| Mordor Intelligence | USD 3.41 B (2025) | |
| Global Consultancy A | USD 3.41 B (2024) | Uses a different reference year and is presented as an enhancers-and-modifiers view in places, which can pull in neighboring additive functions and shift the total when price bands are averaged across a wider basket. |
| Industry Publisher B | USD 4.00 B (2026) | Starts from a forward year and applies broader adoption and pricing assumptions across species, which can lift the number when penetration is not anchored to feed production and species level demand signals. |
Taken together, the comparison suggests the most dependable way to read the market is to first confirm what products are included and which year is being reported, and then check if the total is tied back to species demand indicators and realistic inclusion rates. By keeping the steps traceable to feed volumes, adoption levels, and price realization by region, the final estimate stays easier to replicate and to update as conditions change.


Key Questions Answered in the Report
How large is the feed palatability enhancers market in 2026?
The feed palatability enhancers market size is USD 3.65 billion in 2026 and is set to reach USD 5.12 billion by 2031.
Which product type holds the largest share?
Flavors lead with a 37.45% share of the feed palatability enhancers market size in 2025.
What is driving demand in aquaculture?
High-density shrimp and marine fish operations in Asia-Pacific require water-stable palatants to maintain intake, fueling a 9.62% CAGR for the segment.
Which region accounts for the fastest growth?
Asia-Pacific is expanding at an 8.34% CAGR, reflecting livestock modernization and aquaculture scale-up.
Page last updated on:





