Event Logistics Market Size and Share
Market Overview
| Study Period | 2020 - 2031 |
|---|---|
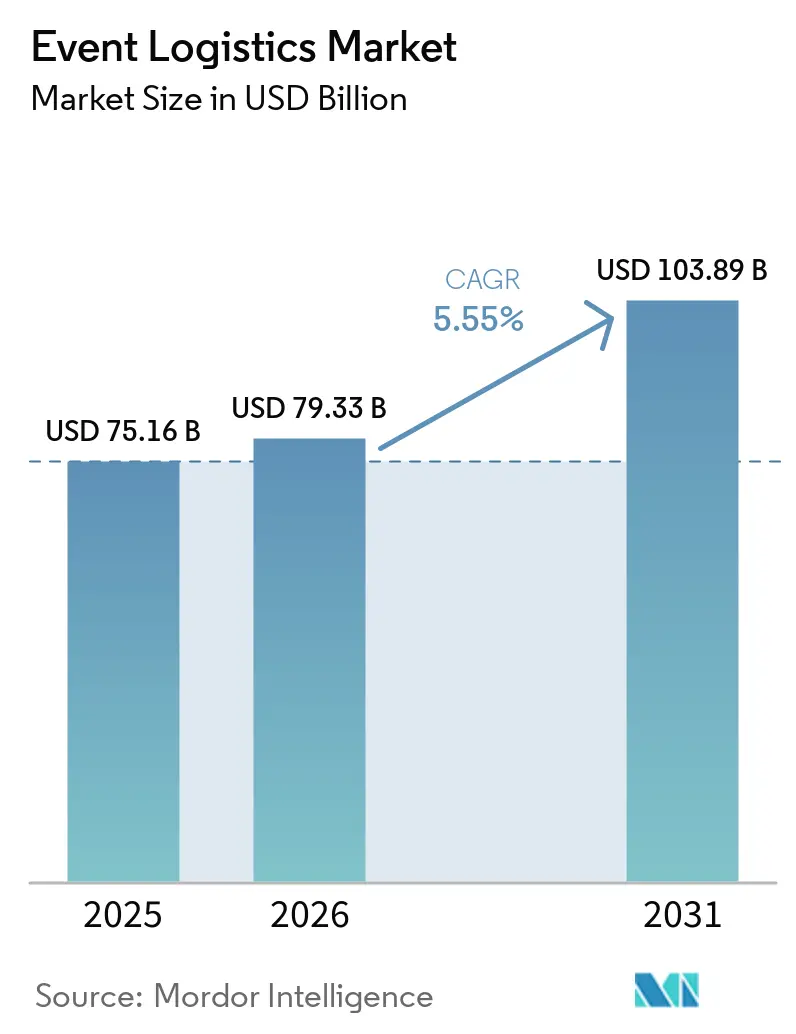
| Market Size (2026) | USD 79.33 Billion |
| Market Size (2031) | USD 103.89 Billion |
| Growth Rate (2026 - 2031) | 5.55% CAGR |
| Fastest Growing Market | North America |
| Largest Market | Asia-Pacific |
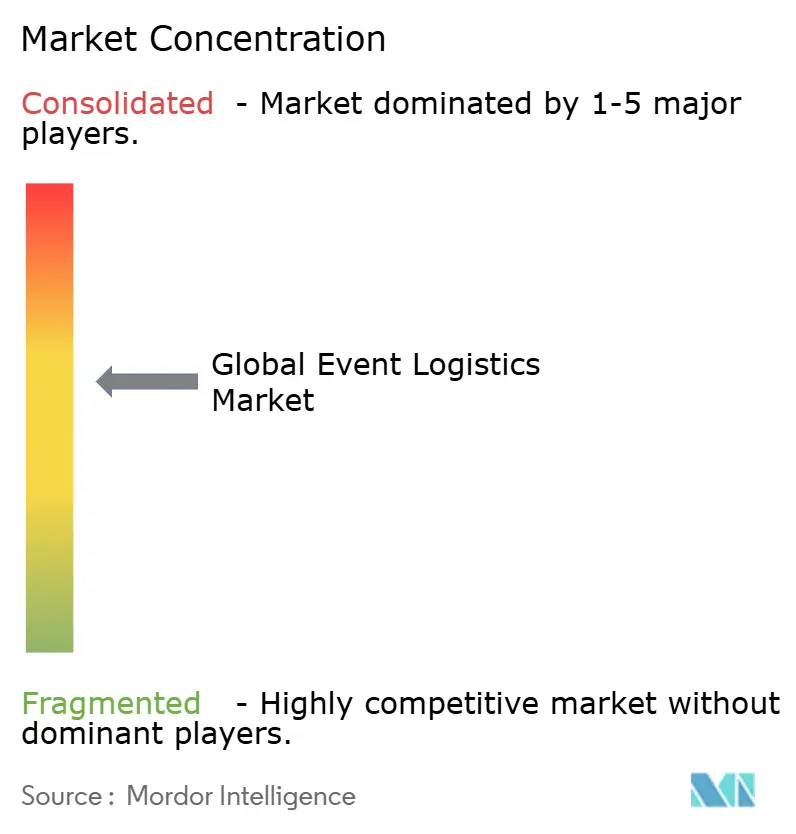
| Market Concentration | Medium |
Major Players *Disclaimer: Major Players sorted in no particular order Image © Mordor Intelligence. Reuse requires attribution under CC BY 4.0. | |
Event Logistics Market Analysis by Mordor Intelligence
The Event Logistics Market size was valued at USD 75.16 billion in 2025 and estimated to grow from USD 79.33 billion in 2026 to reach USD 103.89 billion by 2031, at a CAGR of 5.55% during the forecast period (2026-2031).
Growth is anchored in the steady return of mega-events, the rapid normalization of hybrid formats, and the shift toward single-provider outsourcing that reduces coordination risk. Robust demand for cross-border freight services, intensified experiential brand marketing, and new sustainability mandates are expanding revenue pools for integrated providers. Technology investment in IoT-enabled tracking and AI-driven planning is improving shipment visibility, while infrastructure modernization in the Asia-Pacific is reshaping preferred routing patterns. Together, these forces are reinforcing the resilience of the event logistics market despite freight-rate volatility and labor shortages.
Key Report Takeaways
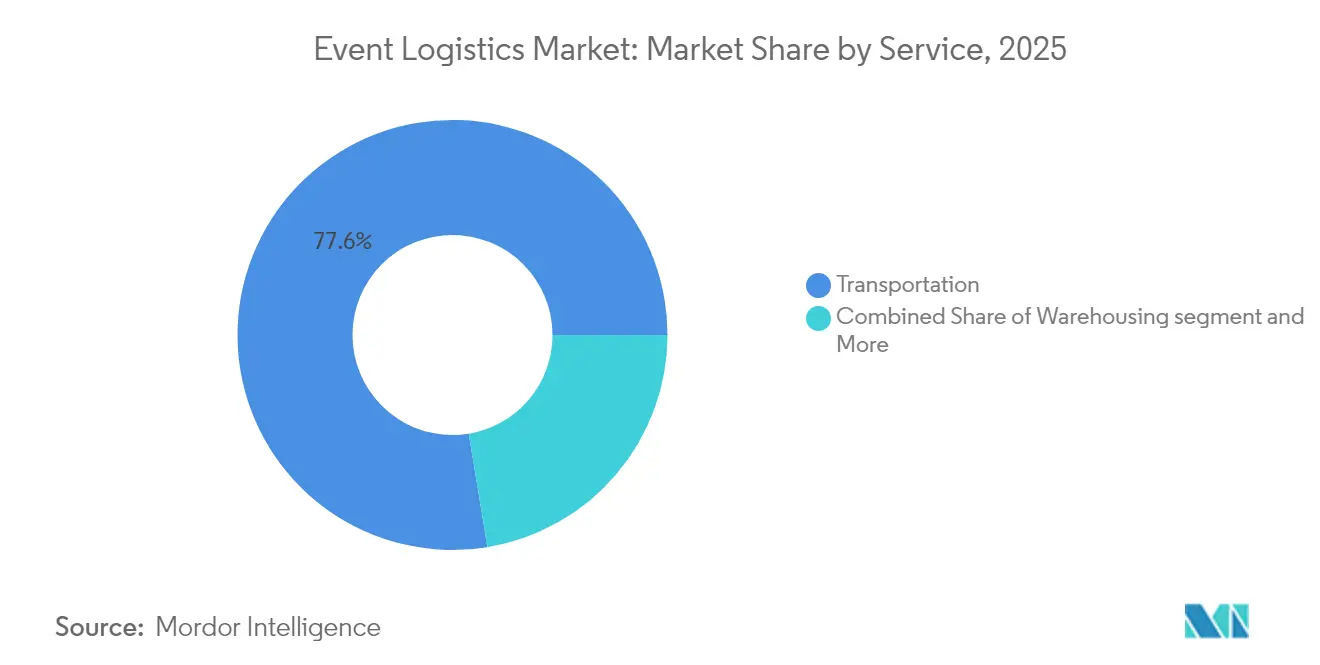
- By service, transportation services led with 77.60% revenue share of the event logistics market in 2025; warehousing, distribution & inventory management is projected to expand at a 6.72% CAGR through 2031.
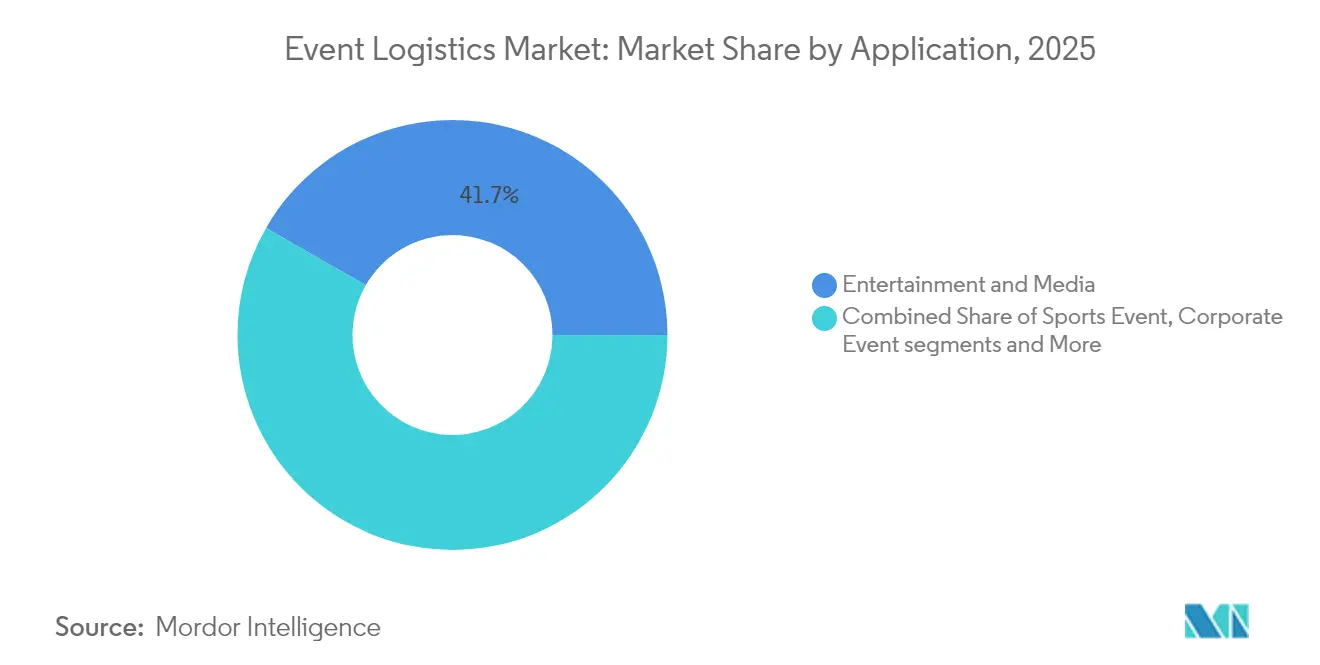
- By application, entertainment & media accounted for a 41.70% share of the event logistics market size in 2025, while sports events are advancing at a 6.55% CAGR through 2031.
- By geography, North America commanded 37.75% of the event logistics market share in 2025; Asia-Pacific is set to accelerate at a 6.98% CAGR between 2026-2031.
Note: Market size and forecast figures in this report are generated using Mordor Intelligence’s proprietary estimation framework, updated with the latest available data and insights as of 2026.
Global Event Logistics Market Trends and Insights
Drivers Impact Analysis*
| Driver | (~) % Impact on CAGR Forecast | Geographic Relevance | Impact Timeline |
|---|---|---|---|
| Escalation of mega-events & hybrid formats worldwide | +1.2% | Global, concentration in North America & Europe | Medium term (2-4 years) |
| Growth in international sports & cultural touring calendars | +0.9% | Global, strongest in Asia-Pacific & North America | Long term (≥ 4 years) |
| Surge in experiential brand-marketing events | +0.8% | North America & Europe core, expanding to Asia-Pacific | Short term (≤ 2 years) |
| Preference for single-point end-to-end outsourcing | +0.7% | Global, led by mature markets | Medium term (2-4 years) |
| Heightened expectations for real-time shipment visibility enabled by IoT/RFID | +0.6% | North America & Europe, spillover to Asia-Pacific | Short term (≤ 2 years) |
| Global sustainability pledges accelerating demand for carbon-neutral solutions | +0.5% | Europe & North America leading, global adoption | Long term (≥ 4 years) |
| Source: Mordor Intelligence | |||
Escalation of Mega-Events and Hybrid Formats Expanding Worldwide Demand
Hybrid events now demand parallel orchestration of freight flows and digital infrastructure. During the Paris 2024 Olympics, CEVA Logistics handled 170,000 pallets across three hubs totaling 80,000 m² while coordinating broadcast equipment distribution, illustrating the dual-stream model reshaping service portfolios. The same requirement is surfacing in corporate conferences where booth construction and cloud-streaming kits must arrive together, prompting providers to build specialized multimedia teams that manage fibre connectivity, display rigs, and on-site technicians in a single work order.
Continuous Growth in International Sports and Cultural Touring Calendars
Touring schedules have lengthened and globalized, raising customs-handling complexity and carnet administration. Cross-border truck traffic between the US, Canada, and Mexico topped 320,000 movements in 2024, helped by USMCA provisions that simplify re-entry for equipment bound for consecutive tour stops. Stadium show promoters now require providers to stage spare lighting rigs and rigging hardware at transshipment depots near major crossings, lowering exposure to last-minute border delays.
Surge in Experiential Brand-Marketing Events Boosting Outsourced Logistics Spend
Corporate spend continues shifting from traditional media to immersive activations that demand rapid setup and teardown. Freeman’s 2024 Exhibitor Trends Report found 75% of exhibitors expect to maintain or increase budgets and 79% plan equal or greater event participation, underscoring sustained logistics volumes. Providers are responding with pop-up deployment units that integrate project managers, carpenters, and inventory specialists capable of handling multi-city roll-outs inside eight-week windows.
Rising Organizer Preference for Single-Point End-to-End Logistics Outsourcing
Organizers of trade fairs and sporting spectacles increasingly contract one lead logistics partner to curb execution risk. Truelink Capital’s USD 535 million purchase of GES assembled transportation, warehousing, and venue services under one roof, mirroring how buyers prioritize consolidated SLAs over piecemeal contracting.
Restraints Impact Analysis*
| Restraint | (~) % Impact on CAGR Forecast | Geographic Relevance | Impact Timeline |
|---|---|---|---|
| Volatile international air & ocean freight rates | -0.8% | Global, acute for cross-border events | Short term (≤ 2 years) |
| Multi-jurisdictional customs & security compliance | -0.6% | Global, concentrated in cross-border corridors | Medium term (2-4 years) |
| Post-pandemic shortage of skilled on-site logistics labor challenging reliable execution | -0.5% | Global, most severe in North America & Europe | Medium term (2-4 years) |
| Increasing scrutiny of event carbon footprints elevating compliance costs | -0.3% | Europe & North America leading, global expansion | Long term (≥ 4 years) |
| Source: Mordor Intelligence | |||
Persistently Volatile International Air and Ocean Freight Rates
Air freight spot prices can double within weeks, forcing organizers to expand contingency budgets or negotiate early block bookings. Border truck rates rose 50-75% in 2024 amid tariff disruptions, adding margin pressure on already tight event budgets[1]Journal of Commerce, “Tariff-Driven Disruptions Inflate Cross-Border Trucking Rates,” joc.com. Providers are experimenting with hedging contracts and multimodal routing to cushion customers against swings.
Multi-Jurisdictional Customs and Security Compliance Complexities
The EU’s Import Control System 2, extended to rail and road in April 2025, mandates pre-arrival data that lengthens clearance timelines[2]European Commission, “Import Control System 2: Extension to Rail and Road,” ec.europa.eu. Brexit-induced checks now delay certain UK crossings by up to 55 hours for plant and animal goods, prompting some carriers to reroute via alternative ports. Such hurdles obligate event planners to lock in schedules months earlier and rely on brokers versed in temporary import regimes.
*Our forecasts treat driver/restraint impacts as directional, not additive. The impact forecasts reflect baseline growth, mix effects, and variable interactions.
Segment Analysis
By Service: Transportation Dominance Amid Technology Integration
Transportation contributed 77.60% of the event logistics market in 2025, underlining its role as the backbone for specialized equipment movement. Despite rate volatility, premium demand persists for air freight lanes that guarantee climate-controlled cabins for musical instruments and broadcast gear requiring shock attenuation. Integrated IoT sensors now track location, humidity, and vibration, reducing insurance claims and reinforcing trust between shippers and organizers. Warehousing, distribution & inventory management is projected to post a 6.72% CAGR, reflecting customer insistence on forward-stocking assets near venue clusters. Automated retrieval systems and RFID portals inside regional hubs cut pick-and-pack time by 22%, enabling overnight redeployments between back-to-back tour dates. As a result, the event logistics market size for warehousing solutions is anticipated to rise steadily through 2031.
Road transport continues to dominate last-mile moves thanks to flexible routing, yet faces constraints from driver shortages, especially in North America. Rail corridors in China and the EU attract bulk staging loads that can tolerate longer lead times while lowering emissions. Sea freight remains the option for non-critical booth infrastructure, offering cost-down benefits that align with sustainability pledges. Air lift retains its niche for time-critical gear and has grown for interactive digital sets that lose value rapidly if delayed. The event logistics industry is therefore investing in blended multimodal plans that match cargo sensitivity with the most reliable, low-carbon path available.


By Application: Entertainment Leads While Sports Accelerates
Entertainment & media events held 41.70% of the event logistics market share in 2025, anchored by multi-continent concert tours and film production road shows. These engagements require precision rigging deliveries and redundant audio-visual inventory positioned across hemispheres to cover overlapping show legs. High-load factors and strict cut-off windows sustain premium tariff structures, reinforcing profitability for firms that can guarantee day-definite arrivals.
Sports events, projected at a 6.55% CAGR, are gaining momentum on the back of fixture-dense calendars and elevated equipment complexity. The Paris 2024 Olympics alone required transport of 1.3 million furniture items and 900,000 sports pieces, stretching provider capacity and validating long-term framework contracts with federations. Trade fairs and exhibitions are rebounding in Asia and Europe, buoyed by resurging corporate travel and on-site deal-making culture. Corporate events centered on experiential marketing push for shorter build times, prompting service models that include fabrication, storage, and post-event refurbishment. Hybrid activations further diversify demand as digital assets travel in parallel with physical booth shells, ensuring the event logistics market maintains breadth across verticals.
Geography Analysis
North America retained 37.75% of the event logistics market in 2025, benefiting from a dense network of venues in Las Vegas, Chicago, and Toronto that double as logistics marshalling points. USMCA streamlining and mature 3PL ecosystems deliver reliable cross-border flows; nevertheless, fuel-price spikes and driver shortages continue to test margins. The region’s corporate event sector, backed by resilient marketing budgets, sustains year-round baseline volumes that cushion providers against seasonality. Mexico’s ascent as the largest United States trading partner at USD 475.6 billion in imports unlocks near-shoring opportunities that tighten haul lengths and reduce dwell times.
Asia-Pacific represents the fastest-growing region with a 6.98% CAGR through 2031. Rising business travel spend, forecast to reach USD 800 billion by 2027, and accelerated infrastructure upgrades underpin the expansion. China’s robust domestic trade-fair circuit, covering technology, automotive, and manufacturing themes, fuels demand for specialized on-site handling crews conversant in complex booth assembly. India’s convention-center pipeline, from Hyderabad to Mumbai, widens the runway for multi-city touring packages, while Japan’s investment in smart-venue technology sparks demand for IoT-integrated logistics solutions. As a result, the event logistics market size in Asia-Pacific continues to rise swiftly.
Europe sustains a balanced outlook. The ICS2 regime raises compliance overhead, yet the continent’s dense calendar—ranging from Hannover Messe to Milan Fashion Week—maintains consistent cargo flows. Providers able to certify ISO 20121 compliance gain an edge as sponsors enforce carbon reporting at every segment of the supply chain. Beyond the tri-core regions, the Middle East and Africa showcase green-field opportunities tied to Expo-style projects and entertainment city build-outs, though infrastructure gaps still restrain immediate volume scaling.
Mordor Intelligence provides coverage of the event logistics market across other key regional markets, including Europe, Asia, and Middle East, each with their regulatory frameworks and demand patterns. Detailed country-level analysis extends to United States incorporating local coverage and market participation, as required.

Note: Segments share of all individual segments available upon report purchase

Competitive Landscape
The event logistics market remains moderately consolidated. The top players control a significant portion of global revenue, with scale advantages in asset pools, regulatory expertise, and technology investments. M&A remained active through 2024: Truelink Capital folded GES into its platform, and Legends absorbed ASM Global, bundling venue management with data-driven merchandising. New State Capital’s stake in The Expo Group signals private-equity appetite for mid-tier specialists capable of serving 500-plus shows annually.
Technology arms-races continue. DHL introduced generative AI tools that cleanse raw data and slash proposal turnaround times by 50%. Avery Dennison showcased RFID deployments that lift inventory accuracy to 97%, driving adoption rates among high-value electronics exhibitors. Providers with proprietary customer portals that offer real-time shock and temperature readings are winning multi-year retainers with sports federations and luxury brands.
Sustainability is the next battleground. CEVA Logistics pledged net-zero by 2050 and executed half of Olympic deliveries via low-carbon methods, setting a benchmark competitors are racing to match Clients increasingly assign weighted scoring to green credentials during RFPs, compelling carriers to invest in biofuel blends, EV fleets, and container recycling schemes. Entrants without demonstrable carbon-reduction roadmaps risk relegation to spot-freight roles incapable of supporting comprehensive event cycles.
Event Logistics Industry Leaders
DHL Supply Chain & Global Forwarding
Nippon Express
C.H. Robinson Worldwide
Kuehne + Nagel International AG
DSV A/S
- *Disclaimer: Major Players sorted in no particular order

Recent Industry Developments
- May 2025: Providence Equity Partners announced a strategic controlling investment in Global Critical Logistics (GCL), becoming majority shareholder while ATL Partners retains a minority stake. GCL, which operates Rock-it Cargo, DIETL, and CARS, executes more than 10,000 projects a year in 160+ countries and plans to accelerate expansion in live-events logistics.
- November 2024: FIFA named Rock-it Cargo the Official Logistics Provider for FIFA World Cup 26™, covering 48 teams and 104 matches across 16 host cities in Canada, Mexico, and the United States. The multi-year contract starts with FIFA Club World Cup™ 2025 services and is the largest sporting-event logistics deal to date.
- August 2024: Legends finalized its acquisition of ASM Global, combining data analytics with extensive venue portfolios.
- April 2024: CMA CGM and CEVA Logistics served as official logistics partners for Paris 2024, moving 1.3 million furniture items and 900,000 sports pieces.


Research Methodology Framework and Report Scope
Market Definitions and Key Coverage
Our study defines the event logistics market as all specialized transportation, warehousing, on-site handling, and customs services contracted for exhibitions, concerts, sports fixtures, corporate conferences, and other time-bound public gatherings. Revenue is captured at the point a logistics provider invoices an event organizer for end-to-end or single-service support.
Scope exclusion: Pure venue management, ticketing platforms, and generic courier services that serve everyday supply chains are not counted.
Segmentation Overview
- By Service
- Transportation
- Road
- Rail
- Sea/Ocean
- Air
- Warehousing, Distribution & Inventory Management
- Other Services
- Transportation
- By Application
- Entertainment & Media
- Sports Events
- Trade Fairs & Exhibitions
- Corporate Events
- Other Applications
- By Geography
- North America
- United States
- Canada
- Mexico
- South America
- Brazil
- Peru
- Chile
- Argentina
- Rest of South America
- Asia-Pacific
- India
- China
- Japan
- Australia
- South Korea
- South East Asia (Singapore, Malaysia, Thailand, Indonesia, Vietnam, Philippines)
- Rest of Asia-Pacific
- Europe
- United Kingdom
- Germany
- France
- Spain
- Italy
- BENELUX (Belgium, Netherlands, Luxembourg)
- NORDICS (Denmark, Finland, Iceland, Norway, Sweden)
- Rest of Europe
- Middle East and Africa
- United Arab Emirates
- Saudi Arabia
- Turkey
- South Africa
- Nigeria
- Rest of Middle East and Africa
- North America
Detailed Research Methodology and Data Validation
Primary Research
We held structured interviews with freight forwarders, on-site rigging specialists, customs brokers, and procurement managers for concert tours across North America, Europe, the Gulf, and Asia Pacific. Their insights on cost-per-attendee, shipment lead times, and emerging hybrid-event requirements plugged key gaps and validated secondary ratios before model lock-in.
Desk Research
Mordor analysts began with government freight flow statistics, customs trade filings, and air cargo tonnage tables from bodies such as the US Bureau of Transportation, Eurostat, UN Comtrade, and IATA, which reveal directional volumes for time-definite shipments linked to major events. Sector-specific barometers, including the UFI Global Exhibition Barometer, SportsBusiness annual event calendar, and ICCA meetings database, helped size the pool of events by type and geography. Company filings, investor presentations, and reputable business media were scanned through Dow Jones Factiva, while D&B Hoovers supplied financial splits for listed logistics providers that disclose event revenue. These sources formed the factual spine; many additional open datasets and trade journals were also consulted for corroboration.
Market-Sizing & Forecasting
The core model applies a top-down build. Global counts of large exhibitions, stadium events, and touring productions are multiplied by representative logistics spend per event, adjusted for attendee scale and service mix. Select bottom-up roll-ups of disclosed event revenue from sampled 3PLs and freight forwarders are then overlaid to stress-test totals and refine regional splits. Input fingerprints include annual trade-show floor space, international sports fixture calendars, average air-freight spot rates, 3PL penetration into live-event supply chains, and corporate experiential marketing budgets. A multivariate regression with these drivers underpins the 2025-2030 forecast, while scenario bands address freight-rate volatility and event calendar shifts. Where provider disclosures were partial, gaps were bridged using peer ratios collected from primary interviews.
Data Validation & Update Cycle
Outputs pass a three-layer check: trend coherence versus historical series, variance alerts triggered when regional growth deviates by two standard deviations, and senior analyst peer review. Reports refresh annually, and material shocks, such as new mega-event announcements or freight price spikes, prompt interim revisions before client delivery.
Why Our Event Logistics Baseline Earns Trust
Published figures often diverge because firms choose different service scopes, event taxonomies, currency conversions, and refresh cadences. Our careful alignment with the actual service stack bought by organizers, plus annual recalibration, minimizes those gaps.
Key divergence drivers seen elsewhere include counting venue management revenue, applying aggressive freight-rate inflation, or projecting with fixed event counts beyond confirmed calendars. Mordor avoids those pitfalls by tying every assumption to a verifiable input or expert confirmation.
Benchmark comparison
| Market Size | Anonymized source | Primary gap driver |
|---|---|---|
| USD 75.16 B (2025) | Mordor Intelligence | - |
| USD 72.10 B (2024) | Global Consultancy A | Excludes on-site handling; uses static FX conversion |
| USD 68.00 B (2023) | Industry Association B | Counts only ticketed events; omits corporate conferences |
| USD 63.90 B (2024) | Research Boutique C | Applies uniform 4% freight cost ratio without region weighting |
These comparisons show that, by anchoring estimates to full-service scope, current-year exchange rates, and validated event pipelines, Mordor Intelligence delivers a balanced, transparent baseline that decision-makers can reliably trace and replicate.


Key Questions Answered in the Report
What is the current size of the event logistics market?
The market stands at USD 79.33 billion in 2026 and is projected to reach USD 103.89 billion by 2031, growing at a 5.55% CAGR.
Which service segment generates the highest revenue?
Transportation services contribute 77.60% of overall 2025 revenue, underscoring the need to move specialized equipment reliably across borders.
Which region is expanding the fastest?
Asia Pacific leads growth with a 6.98% CAGR thanks to rising business travel, infrastructure upgrades, and a robust calendar of international events.
How are hybrid events influencing logistics operations?
Hybrid formats require simultaneous management of physical freight and digital broadcasting infrastructure, driving demand for providers skilled in both domains.
What role does sustainability play in provider selection?
Sponsors increasingly mandate carbon-neutral operations, prompting carriers to deploy low-carbon fuels, EV fleets, and reverse-logistics programs to remain competitive.
How is technology enhancing shipment visibility?
IoT sensors, RFID tagging, and AI-powered analytics now offer real-time location and condition monitoring, reducing risk and improving on-site execution precision.
Page last updated on:


