Construction Repair And Rehabilitation Chemicals Market Size and Share
Market Overview
| Study Period | 2020 - 2031 |
|---|---|
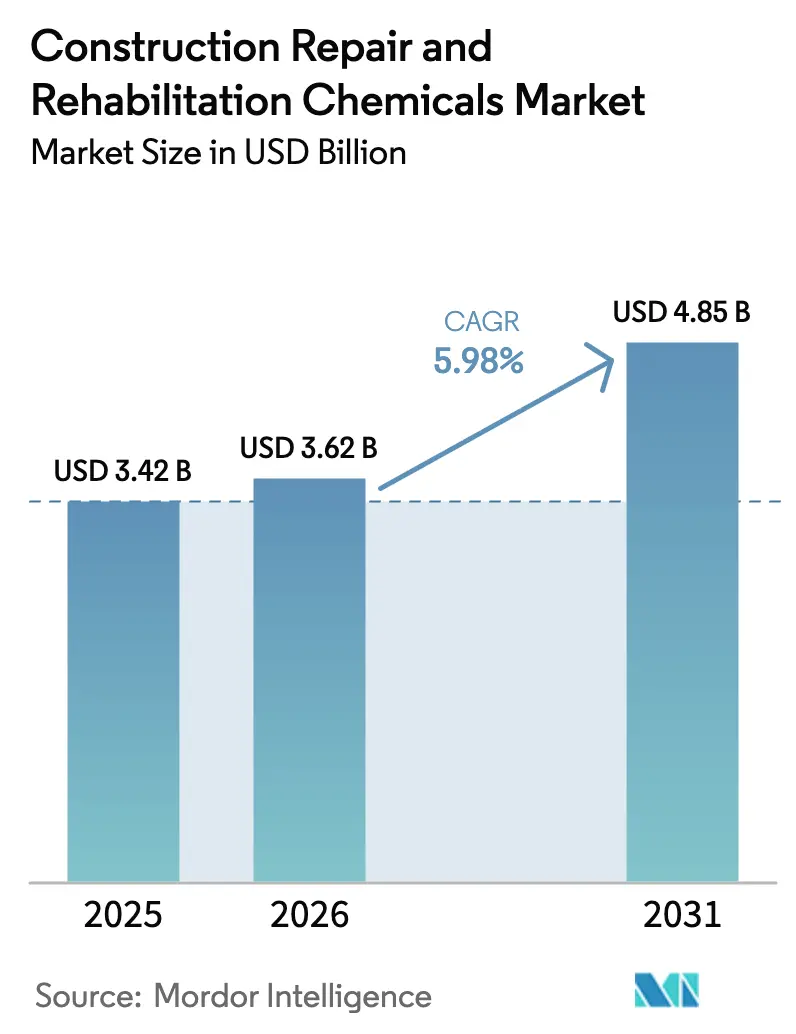
| Market Size (2026) | USD 3.62 Billion |
| Market Size (2031) | USD 4.85 Billion |
| Growth Rate (2026 - 2031) | 5.98% CAGR |
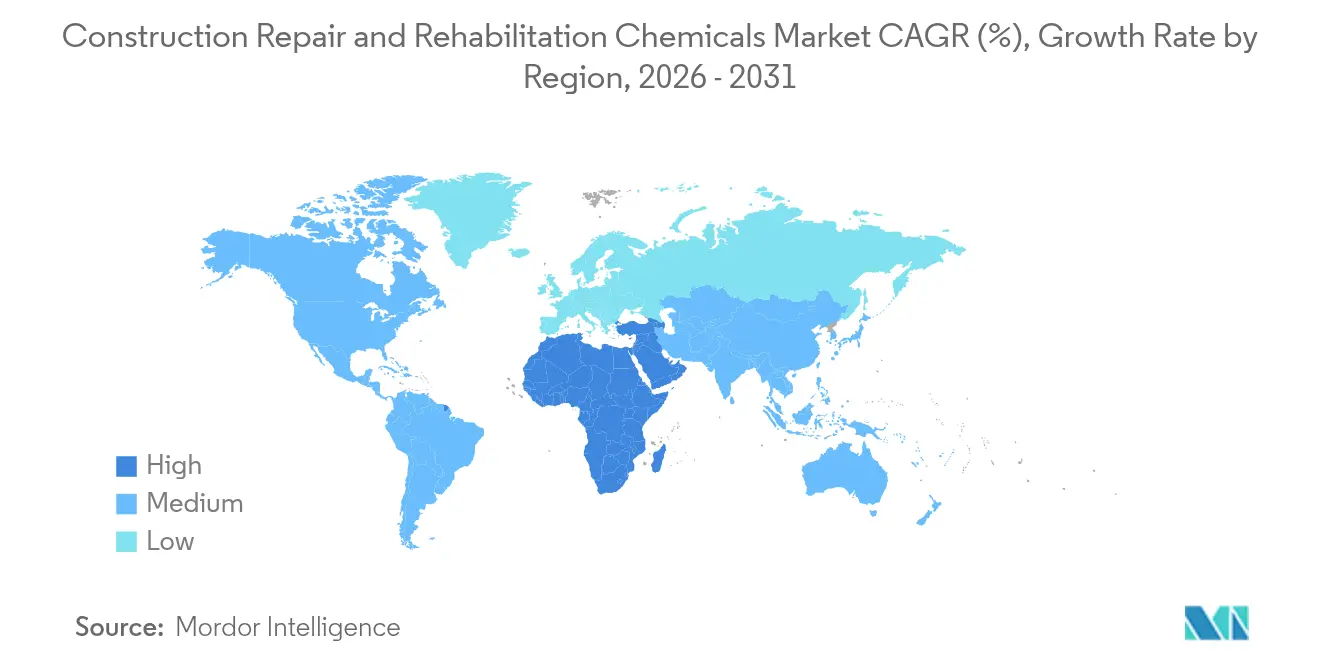
| Fastest Growing Market | Middle East and Africa |
| Largest Market | Asia Pacific |
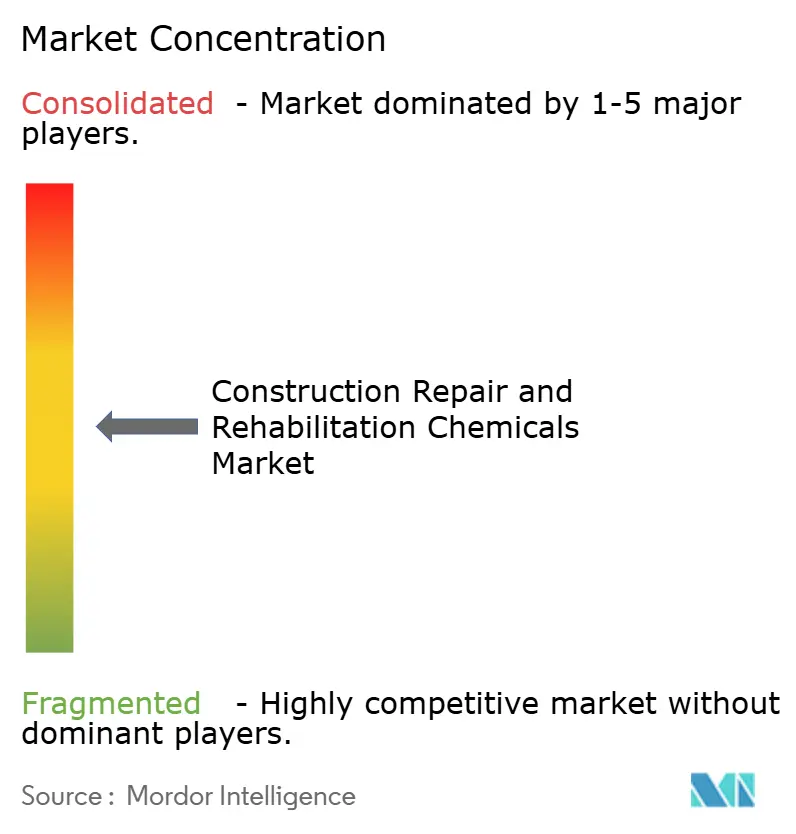
| Market Concentration | Medium |
Major Players *Disclaimer: Major Players sorted in no particular order Image © Mordor Intelligence. Reuse requires attribution under CC BY 4.0. | |
Construction Repair And Rehabilitation Chemicals Market Analysis by Mordor Intelligence
The Construction Repair and Rehabilitation Chemicals market size is expected to grow from USD 3.42 billion in 2025 to USD 3.62 billion in 2026 and is forecast to reach USD 4.85 billion by 2031 at 5.98% CAGR over 2026-2031. Aging bridges, tunnels, and buildings built during the post-war era are simultaneously reaching the end of their life, while stimulus-backed modernization programs encourage owners to rehabilitate rather than rebuild. Rapid urbanization across Asia, mega-projects in the Middle East, and stricter green-building rules that award credits for proven life extension are reinforcing demand for polymer-enhanced mortars, corrosion inhibitors, and injection grouts. Contractors favor low-carbon formulations that reduce downtime, and manufacturers are racing to launch bio-based additives that help projects secure funding for the circular economy. Price swings for epoxy and isocyanate feedstocks, together with shortages of certified applicators, create margin pressure but have not slowed order books.
Key Report Takeaways
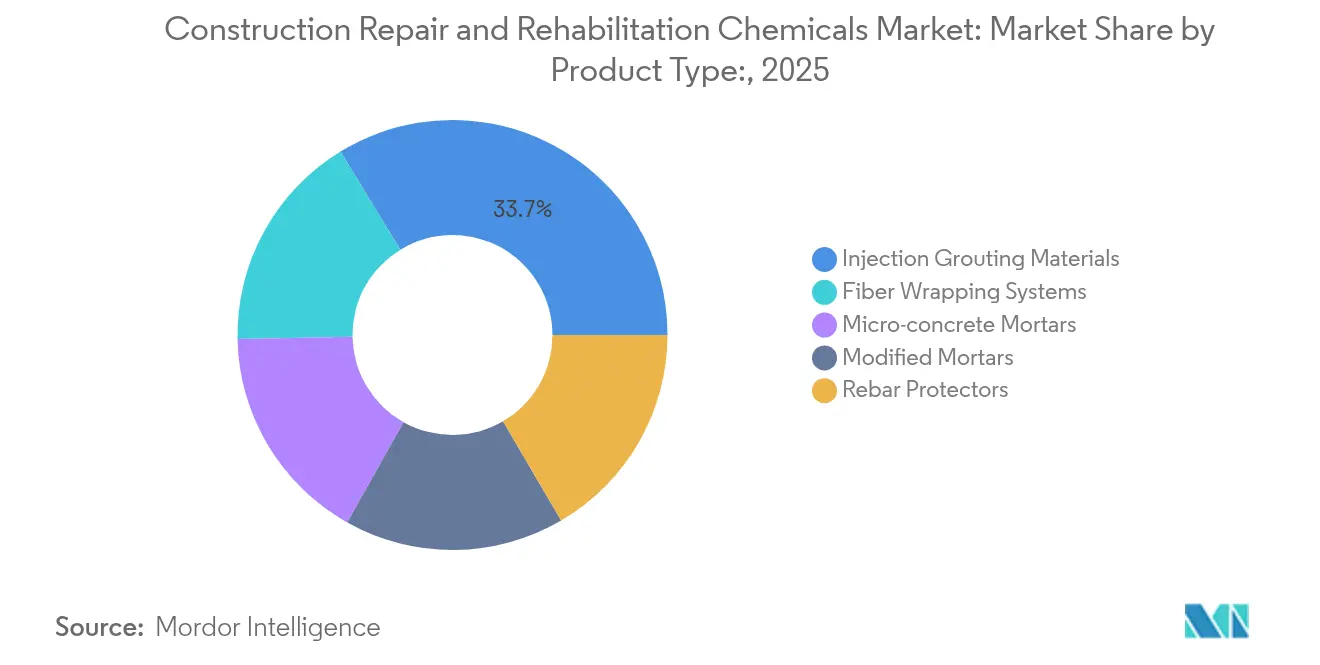
- By product type, Injection Grouting Materials led with a 33.72% share of the Construction Repair and Rehabilitation Chemicals market in 2025. Modified Mortars are projected to expand at a 7.01% CAGR through 2031, the fastest among product categories.
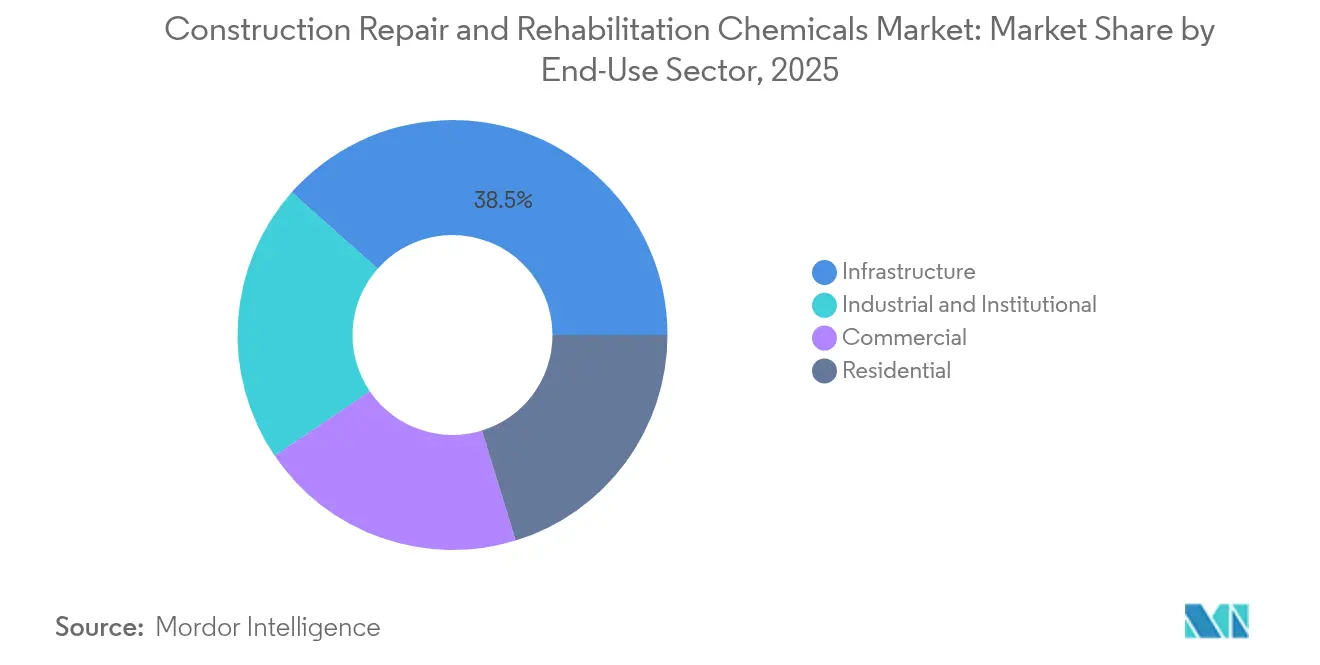
- By end-use sector, Infrastructure captured 38.45% revenue share in 2025. Industrial and Institutional facilities are expected to record the highest forecast growth at a 6.78% CAGR during 2026-2031.
- By region, Asia-Pacific commanded 41.98% value share in 2025, while the Middle East and Africa region is set to post the quickest 6.88% CAGR to 2031.
Note: Market size and forecast figures in this report are generated using Mordor Intelligence’s proprietary estimation framework, updated with the latest available data and insights as of 2026.
Global Construction Repair And Rehabilitation Chemicals Market Trends and Insights
Drivers Impact Analysis*
| Driver | (~) % Impact on CAGR Forecast | Geographic Relevance | Impact Timeline |
|---|---|---|---|
| Fast-tracked infrastructure stimulus globally | +1.8% | Global, concentrated in North America, Europe, APAC | Medium term (2-4 years) |
| Aging civil assets past design life | +1.5% | North America, EU, mature APAC | Long term (≥4 years) |
| Mandatory durability-extension clauses | +1.2% | EU and North America led, global reach | Medium term (2-4 years) |
| Specialist repair solutions gain traction | +0.9% | Early adoption in developed markets | Short term (≤2 years) |
| Circular-economy credits for low-carbon mixes | +0.6% | EU core, North America, select APAC | Long term (≥4 years) |
| Source: Mordor Intelligence | |||


Fast-Tracked Infrastructure Stimulus Globally
Governments are ring-fencing rehabilitation budgets because reinforcing an existing bridge or tunnel is less capital-intensive than building a replacement. US IIJA (Infrastructure Investment and Jobs Act) allocations continue to prioritize bridge deck overlays and crack-injection work. China’s transport ministry funds polymer grout upgrades across trunk highways to increase service life amid traffic surges[1]Koster Bauchemie AG, “Cost-Benefit of Polymer Modified Mortars,” koster.eu. In Europe, Recovery and Resilience Facility grants give preference to projects that prove a 30-year life extension, steering demand toward high-performance corrosion inhibitors. Contractors cite 30-40% shorter schedule times when using rapid-cure injection systems compared with sectional replacement. These programmatic incentives collectively lift the construction repair and rehabilitation chemicals market by channeling spending into chemical solutions that cut embodied carbon relative to demolition.
Aging Civil Assets Past Design Life in Developed Economies
Bridge decks cast in the 1960s exhibit chloride-induced rebar corrosion, which accelerates crack propagation. The US Army Corps of Engineers reports that extending bridge life by 20 years with hydrophobic pore-blocking sealers costs one-quarter of the cost of full replacement. Similar deterioration patterns are observed in German motorway viaducts where the carbonation depth exceeds the design cover. Facility owners, therefore, specify penetrating corrosion inhibitors and polymer-modified repair mortars that add tensile strength while matching substrate modulus. Rust Belt municipalities allocate up to 60% of maintenance budgets to chemical rehabilitation, viewing it as the only affordable route to keep assets operational.
Mandatory Durability-Extension Clauses in Green-Building Codes
Credits under LEED (Leadership in Energy and Environmental Design) v4.1 reward projects that demonstrate quantifiable life-extension through materials such as polymer-rich mortars and fiber wraps. The EU taxonomy labels refurbishment that elongates service life by at least 30% as a “sustainable economic activity”, unlocking favorable financing. Corporate real estate owners now demand 10-year performance warranties from suppliers, redirecting specifications toward premium two-component systems that have been verified in ISO (International Organization for Standardization) 20340 cyclic tests. Insurers also offer reduced premiums when structures employ certified corrosion inhibitors. These regulatory and financial levers funnel projects toward high-value formulations, reinforcing growth in the construction repair and rehabilitation chemicals market.
Specialist Repair Solutions Gain Traction Amid Growing Awareness
Consulting engineers are replacing generic skim-coat repairs with system-engineered solutions, such as epoxy grout crack sealing and carbon-fiber wraps. Field trials on motorway overpasses show polymer-modified mortars extend inspection intervals by 5 years[2]Sika AG, “Repair and Protection Portfolio 2025,” sika.com. Manufacturers run digital seminars that train contractors on mix ratios and surface prep, boosting installer confidence and adoption. The result is a price tolerance for chemistry that costs 30% more yet halves downtime. Certification programs administered by material suppliers increase the number of qualified applicators, gradually alleviating the labor bottleneck.
Restraints Impact Analysis*
| Restraint | (~) % Impact on CAGR Forecast | Geographic Relevance | Impact Timeline |
|---|---|---|---|
| Volatile epoxy and isocyanate feed-stock pricing | - 0.80% | Global, with regional variations in supply chains and inventory cycles | Short term (≤ 2 years) |
| Skilled-labor shortages for specialty application | - 0.70% | Global, acute in North America and Europe, emerging in Asia-Pacific | Medium term (2-4 years) |
| Fragmented standards on long-term performance testing | - 0.60% | Global, with particular challenges in emerging markets and cross-border projects | Long term (≥ 4 years) |
| Source: Mordor Intelligence | |||
Volatile Epoxy and Isocyanate Feedstock Pricing
European epoxy resin benchmarks rose 8% in January 2025 due to tight inventories, whereas Asian prices fell 3% ahead of the Lunar New Year turnarounds. Polyurethane precursors MDI (Methylene Diphenyl Diisocyanate) and TDI (Toluene Diisocyanate) saw USD 200–300 per ton hikes after producers announced capacity rationalizations. Contractors bidding on multi-year infrastructure jobs face a cost-pass-through risk because specifications often fix resin chemistry months before the application. Suppliers respond by adding escalation clauses or holding buffer stocks, but both strategies squeeze margins and strain working capital.
Skilled-Labor Shortages for Specialty Application
The median age of certified crack-injection technicians in the United States reached 47 years in 2025, five years older than the overall construction workforce. European training bodies report course wait-lists of six months for fiber-wrap installers. Complex multi-component repair systems require precise mixing and surface profiling that inexperienced labor cannot guarantee, leading to warranty disputes. The gap inflates labor rates by up to 15% and forces project delays, slowing market volume growth even as demand indicators remain positive.
*Our forecasts treat driver/restraint impacts as directional, not additive. The impact forecasts reflect baseline growth, mix effects, and variable interactions.
Segment Analysis
By Product Type: Injection Systems Lead Technical Evolution
Injection Grouting Materials generated USD 1.15 billion in 2025, equal to 33.72% of the construction repair and rehabilitation chemicals market size. Engineers choose polyurethane foams and low-viscosity epoxy grouts to seal active water leaks and re-establish structural continuity. Advanced micro-fine cement blends and expanding acrylic gels penetrate hairline cracks, extending asset life without excavation. Modified Mortars, forecast to grow at a 7.01% CAGR, use styrene-butadiene and acrylic polymers that improve flexural strength and shrinkage control. Fiber Wrapping Systems gain share in seismic zones because carbon fiber fabrics raise load capacity while adding negligible dead weight.
Second-generation micro-concrete mortars with particle-packed gradation achieve early strength of 45 MPa within 24 hours, enabling rapid reopening of traffic lanes. Zinc-rich rebar protectors migrate corrosion inhibitors to steel surfaces, delaying chloride attack. Collectively, these innovations draw purchasers toward system solutions rather than single-product fixes, lifting average selling prices across the construction repair and rehabilitation chemicals market.


By End-Use Sector: Infrastructure Drives Volume Growth
Infrastructure assets—including bridges, tunnels, culverts, and water treatment plants—absorbed 38.45% of global demand in 2025, equal to USD 1.31 billion of the construction repair and rehabilitation chemicals market size. Public agencies funnel stimulus funds into overlay, joint-sealing, and cathodic-protection programs that specify epoxy grouts and polymer rich mortars. Industrial and Institutional facilities are projected to log a 6.78% CAGR to 2031 as hospitals, data centers, and universities retrofit floors and façades to meet new durability codes. Commercial real estate owners prioritize aesthetics, selecting color-matched patching compounds and low-odor coatings that allow tenants to remain operational.
Homeowners represent an emerging niche for small-pack repair kits that fill spalls and recoat balconies. Food-processing plants request antimicrobial-enhanced mortars that resist lactic acid, while power plants favor high-temperature grouts for flue-gas ducts. These end-use dynamics guide product development toward niche formulations that solve sector-specific problems and strengthen brand loyalty inside the construction repair and rehabilitation chemicals industry.
Geography Analysis
Asia-Pacific retained a 41.98% share of global revenue in 2025 on the back of China’s Belt and Road transport corridors, India’s Smart Cities upgrades, and rapid mass-transit expansion across Southeast Asia. Domestic producers, such as Asian Paints and Pidilite, scale polycarboxylate admixtures and injection resins that comply with the Bureau of Indian Standards, thereby reducing import dependence. Japanese expressway operators are investing resources in carbon-fiber wrap retrofits to combat alkali-silica reaction while meeting seismic codes. As a result, regional consumption volume rose faster than global averages, and the construction repair and rehabilitation chemicals market size in Asia-Pacific will maintain leadership through 2031.
The Middle East and Africa region is expected to record the fastest growth, with a 6.88% CAGR from 2026 to 2031. Saudi Arabia’s NEOM giga-project specifies sulfate-resistant grouts and UV-stable coatings to withstand desert exposure. UAE (United Arab Emirates) rail projects utilize micro-concrete to repair tunnel linings within 8-hour nighttime windows. South African state-owned railways outline tenders that mandate a minimum 25-year service life, prompting suppliers to adopt premium two-component systems. Challenges include import logistics and limited certified applicator pools, yet owners increasingly accept higher material costs when lifecycle models prove savings.
North America remains a mature but sizable market where the IIJA channels USD 40 billion annually into bridge and roadway rehabilitation. Departments of Transportation standardize on ASTM C881 epoxy injection and ASTM C928 rapid-repair mortars, creating specification stickiness that benefits incumbents. Europe exhibits similar replacement demand, with municipalities in Germany and France allocating 60% of capital budgets to refurbishment aligned with the EU Green Deal. South America shows moderate recovery as Brazil restarts stalled commuter-rail expansion, though currency volatility curbs near-term growth.

Competitive Landscape
The Construction Repair and Rehabilitation Chemicals Market is moderately concentrated. The marketplace features global majors with broad product lines and regional specialists carving out niches. Sika, MAPEI, and Saint-Gobain offer premium concrete repair mortar lines, backed by on-site technical teams and ISO-accredited laboratories. Augmented-reality applications and cloud-based project tracking and tracing solutions enhance installation accuracy, reducing callbacks and minimizing switching costs. Overall rivalry remains moderate, with innovation cycles and regulation shaping share shifts rather than price wars.
Construction Repair And Rehabilitation Chemicals Industry Leaders
MAPEI S.p.A.
RPM International Inc.
Saint-Gobain
Sika AG
Ardex Group
- *Disclaimer: Major Players sorted in no particular order

Recent Industry Developments
- September 2025: Responding to customer demand for convenience and reduced waste on smaller jobs, Setcrete Ltd. launched a new half-size, 2.5kg sack of its popular Rapid Set Repair Mortar in the United Kingdom.
- January 2025: Imerys launched Fondag Aerospace, a concrete engineered to withstand the punishing conditions of rocket launches in Europe and the rest of the world. Fondag Aerospace has been established to meet the demanding requirements of the aerospace industry.


Global Construction Repair And Rehabilitation Chemicals Market Report Scope
Commercial, Industrial and Institutional, Infrastructure, Residential are covered as segments by End Use Sector. Fiber Wrapping Systems, Injection Grouting Materials, Micro-concrete Mortars, Modified Mortars, Rebar Protectors are covered as segments by Sub Product. Asia-Pacific, Europe, Middle East and Africa, North America, South America are covered as segments by Region.| Fiber Wrapping Systems |
| Injection Grouting Materials |
| Micro-concrete Mortars |
| Modified Mortars |
| Rebar Protectors |
| Commercial |
| Industrial and Institutional |
| Infrastructure |
| Residential |
| Asia-Pacific | Australia |
| China | |
| India | |
| Indonesia | |
| Japan | |
| Malaysia | |
| South Korea | |
| Thailand | |
| Vietnam | |
| Rest of Asia-Pacific | |
| North America | Canada |
| Mexico | |
| United States | |
| Europe | France |
| Germany | |
| Italy | |
| Russia | |
| Spain | |
| United Kingdom | |
| Rest of Europe | |
| South America | Argentina |
| Brazil | |
| Rest of South America | |
| Middle East and Africa | Saudi Arabia |
| United Arab Emirates | |
| Rest of Middle East and Africa |
| By Product Type | Fiber Wrapping Systems | |
| Injection Grouting Materials | ||
| Micro-concrete Mortars | ||
| Modified Mortars | ||
| Rebar Protectors | ||
| By End-Use Sector | Commercial | |
| Industrial and Institutional | ||
| Infrastructure | ||
| Residential | ||
| By Geography | Asia-Pacific | Australia |
| China | ||
| India | ||
| Indonesia | ||
| Japan | ||
| Malaysia | ||
| South Korea | ||
| Thailand | ||
| Vietnam | ||
| Rest of Asia-Pacific | ||
| North America | Canada | |
| Mexico | ||
| United States | ||
| Europe | France | |
| Germany | ||
| Italy | ||
| Russia | ||
| Spain | ||
| United Kingdom | ||
| Rest of Europe | ||
| South America | Argentina | |
| Brazil | ||
| Rest of South America | ||
| Middle East and Africa | Saudi Arabia | |
| United Arab Emirates | ||
| Rest of Middle East and Africa | ||


Market Definition
- END-USE SECTOR - Repair and rehabilitation chemicals consumed in the construction sectors such as commercial, residential, industrial, institutional, and infrastructure are considered under the scope of the study.
- PRODUCT/APPLICATION - Under the scope of the study, the consumption of repair and rehabilitation chemical products such as injection grouting materials, modified mortars, fiber wrapping systems, rebar protectors, and micro-concrete mortars are considered.
| Keyword | Definition |
|---|---|
| Accelerator | Accelerators are admixtures used to fasten the setting time of concrete by increasing the initial rate and speeding up the chemical reaction between cement and the mixing water. These are used to harden and increase the strength of concrete quickly. |
| Acrylic | This synthetic resin is a derivative of acrylic acid. It forms a smooth surface and is mainly used for various indoor applications. The material can also be used for outdoor applications with a special formulation. |
| Adhesives | Adhesives are bonding agents used to join materials by gluing. Adhesives can be used in construction for many applications, such as carpet laying, ceramic tiles, countertop lamination, etc. |
| Air Entraining Admixture | Air-entraining admixtures are used to improve the performance and durability of concrete. Once added, they create uniformly distributed small air bubbles to impart enhanced properties to the fresh and hardened concrete. |
| Alkyd | Alkyds are used in solvent-based paints such as construction and automotive paints, traffic paints, flooring resins, protective coatings for concrete, etc. Alkyd resins are formed by the reaction of an oil (fatty acid), a polyunsaturated alcohol (Polyol), and a polyunsaturated acid or anhydride. |
| Anchors and Grouts | Anchors and grouts are construction chemicals that stabilize and improve the strength and durability of foundations and structures like buildings, bridges, dams, etc. |
| Cementitious Fixing | Cementitious fixing is a process in which a cement-based grout is pumped under pressure to fill forms, voids, and cracks. It can be used in several settings, including bridges, marine applications, dams, and rock anchors. |
| Commercial Construction | Commercial construction comprises new construction of warehouses, malls, shops, offices, hotels, restaurants, cinemas, theatres, etc. |
| Concrete Admixtures | Concrete admixtures comprise water reducers, air entrainers, retarders, accelerators, superplasticizers, etc., added to concrete before or during mixing to modify its properties. |
| Concrete Protective Coatings | To provide specific protection, such as anti-carbonation or chemical resistance, a film-forming protective coat can be applied on the surface. Depending on the applications, different resins like epoxy, polyurethane, and acrylic can be used for concrete protective coatings. |
| Curing Compounds | Curing compounds are used to cure the surface of concrete structures, including columns, beams, slabs, and others. These curing compounds keep the moisture inside the concrete to give maximum strength and durability. |
| Epoxy | Epoxy is known for its strong adhesive qualities, making it a versatile product in many industries. It resists heat and chemical applications, making it an ideal product for anyone needing a stronghold under pressure. It is widely used in adhesives, electrical and electronics, paints, etc. |
| Fiber Wrapping Systems | Fiber Wrapping Systems are a part of construction repair and rehabilitation chemicals. It involves the strengthening of existing structures by wrapping structural members like beams and columns with glass or carbon fiber sheets. |
| Flooring Resins | Flooring resins are synthetic materials applied to floors to enhance their appearance, increase their resistance to wear and tear or provide protection from chemicals, moisture, and stains. Depending on the desired properties and the specific application, flooring resins are available in distinct types, such as epoxy, polyurethane, and acrylic. |
| High-Range Water Reducer (Super Plasticizer) | High-range water reducers are a type of concrete admixture that provides enhanced and improved properties when added to concrete. These are also called superplasticizers and are used to decrease the water-to-cement ratio in concrete. |
| Hot Melt Adhesives | Hot-melt adhesives are thermoplastic bonding materials applied as melts that achieve a solid state and resultant strength on cooling. They are commonly used for packaging, coatings, sanitary products, and tapes. |
| Industrial and Institutional Construction | Industrial and institutional construction includes new construction of hospitals, schools, manufacturing units, energy and power plants, etc. |
| Infrastructure Construction | Infrastructure construction includes new construction of railways, roads, seaways, airports, bridges, highways, etc. |
| Injection Grouting | The process of injecting grout into open joints, cracks, voids, or honeycombs in concrete or masonry structural members is known as injection grouting. It offers several benefits, such as strengthening a structure and preventing water infiltration. |
| Liquid-Applied Waterproofing Membranes | Liquid-Applied membrane is a monolithic, fully bonded, liquid-based coating suitable for many waterproofing applications. The coating cures to form a rubber-like elastomeric waterproof membrane and may be applied over many substrates, including asphalt, bitumen, and concrete. |
| Micro-concrete Mortars | Micro-concrete mortar is made up of cement, water-based resin, additives, mineral pigments, and polymers and can be applied on both horizontal and vertical surfaces. It can be used to refurbish residential complexes, commercial spaces, etc. |
| Modified Mortars | Modified Mortars include Portland cement and sand along with latex/polymer additives. The additives increase adhesion, strength, and shock resistance while also reducing water absorption. |
| Mold Release Agents | Mold release agents are sprayed or coated on the surface of molds to prevent a substrate from bonding to a molding surface. Several types of mold release agents, including silicone, lubricant, wax, fluorocarbons, and others, are used based on the type of substrates, including metals, steel, wood, rubber, plastic, and others. |
| Polyaspartic | Polyaspartic is a subset of polyurea. Polyaspartic floor coatings are typically two-part systems that consist of a resin and a catalyst to ease the curing process. It offers high durability and can withstand harsh environments. |
| Polyurethane | Polyurethane is a plastic material that exists in various forms. It can be tailored to be either rigid or flexible and is the material of choice for a broad range of end-user applications, such as adhesives, coatings, building insulation, etc. |
| Reactive Adhesives | A reactive adhesive is made of monomers that react in the adhesive curing process and do not evaporate from the film during use. Instead, these volatile components become chemically incorporated into the adhesive. |
| Rebar Protectors | In concrete structures, rebar is one of the important components, and its deterioration due to corrosion is a major issue that affects the safety, durability, and life span of buildings and structures. For this reason, rebar protectors are used to protect against degrading effects, especially in infrastructure and industrial construction. |
| Repair and Rehabilitation Chemicals | Repair and Rehabilitation Chemicals include repair mortars, injection grouting materials, fiber wrapping systems, micro-concrete mortars, etc., used to repair and restore existing buildings and structures. |
| Residential Construction | Residential construction involves constructing new houses or spaces like condominiums, villas, and landed homes. |
| Resin Fixing | The process of using resins like epoxy and polyurethane for grouting applications is called resin fixing. Resin fixing offers several advantages, such as high compressive and tensile strength, negligible shrinkage, and greater chemical resistance compared to cementitious fixing. |
| Retarder | Retarders are admixtures used to slow down the setting time of concrete. These are usually added with a dosage rate of around 0.2% -0.6% by weight of cement. These admixtures slow down hydration or lower the rate at which water penetrates the cement particles by making concrete workable for a long time. |
| Sealants | A sealant is a viscous material that has little or no flow qualities, which causes it to remain on surfaces where they are applied. Sealants can also be thinner, enabling penetration to a certain substance through capillary action. |
| Sheet Waterproofing Membranes | Sheet membrane systems are reliable and durable thermoplastic waterproofing solutions that are used for waterproofing applications even in the most demanding below-ground structures, including those exposed to highly aggressive ground conditions and stress. |
| Shrinkage Reducing Admixture | Shrinkage-reducing admixtures are used to reduce concrete shrinkage, whether from drying or self-desiccation. |
| Silicone | Silicone is a polymer that contains silicon combined with carbon, hydrogen, oxygen, and, in some cases, other elements. It is an inert synthetic compound that comes in various forms, such as oil, rubber, and resin. Due to its heat-resistant properties, it finds applications in sealants, adhesives, lubricants, etc. |
| Solvent-borne Adhesives | Solvent-borne adhesives are mixtures of solvents and thermoplastic or slightly cross-linked polymers such as polychloroprene, polyurethane, acrylic, silicone, and natural and synthetic rubbers. |
| Surface Treatment Chemicals | Surface treatment chemicals are chemicals used to treat concrete surfaces, including roofs, vertical surfaces, and others. They act as curing compounds, demolding agents, rust removers, and others. They are cost-effective and can be used on roadways, pavements, parking lots, and others. |
| Viscosity Modifier | Viscosity Modifiers are concrete admixtures used to change various properties of admixtures, including viscosity, workability, cohesiveness, and others. These are usually added with a dosage of around 0.01% to 0.1% by weight of cement. |
| Water Reducer | Water reducers, also called plasticizers, are a type of admixture used to decrease the water-to-cement ratio in the concrete, thereby increasing the durability and strength of concrete. Various water reducers include refined lignosulfonates, gluconates, hydroxycarboxylic acids, sugar acids, and others. |
| Water-borne Adhesives | Water-borne adhesives use water as a carrier or diluting medium to disperse resin. They are set by allowing the water to evaporate or be absorbed by the substrate. These adhesives are compounded with water as a dilutant rather than a volatile organic solvent. |
| Waterproofing Chemicals | Waterproofing chemicals are designed to protect a surface from the perils of leakage. A waterproofing chemical is a protective coating or primer applied to a structure's roof, retaining walls, or basement. |
| Waterproofing Membranes | Waterproofing membranes are liquid-applied or self-adhering layers of water-tight materials that prevent water from penetrating or damaging a structure when applied to roofs, walls, foundations, basements, bathrooms, and other areas exposed to moisture or water. |


Research Methodology
Mordor Intelligence follows a four-step methodology in all our reports.
- Step-1: Identify Key Variables: The quantifiable key variables (industry and extraneous) pertaining to the specific product segment and country are selected from a group of relevant variables & factors based on desk research & literature review; along with primary expert inputs. These variables are further confirmed through regression modeling (wherever required).
- Step-2: Build a Market Model: In order to build a robust forecasting methodology, the variables and factors identified in Step-1 are tested against available historical market numbers. Through an iterative process, the variables required for market forecast are set and the model is built on the basis of these variables.
- Step-3: Validate and Finalize: In this important step, all market numbers, variables and analyst calls are validated through an extensive network of primary research experts from the market studied. The respondents are selected across levels and functions to generate a holistic picture of the market studied.
- Step-4: Research Outputs: Syndicated Reports, Custom Consulting Assignments, Databases & Subscription Platforms


