Market Overview
| Study Period | 2021 - 2031 |
|---|---|
| Forecast Data Period | 2026 - 2031 |
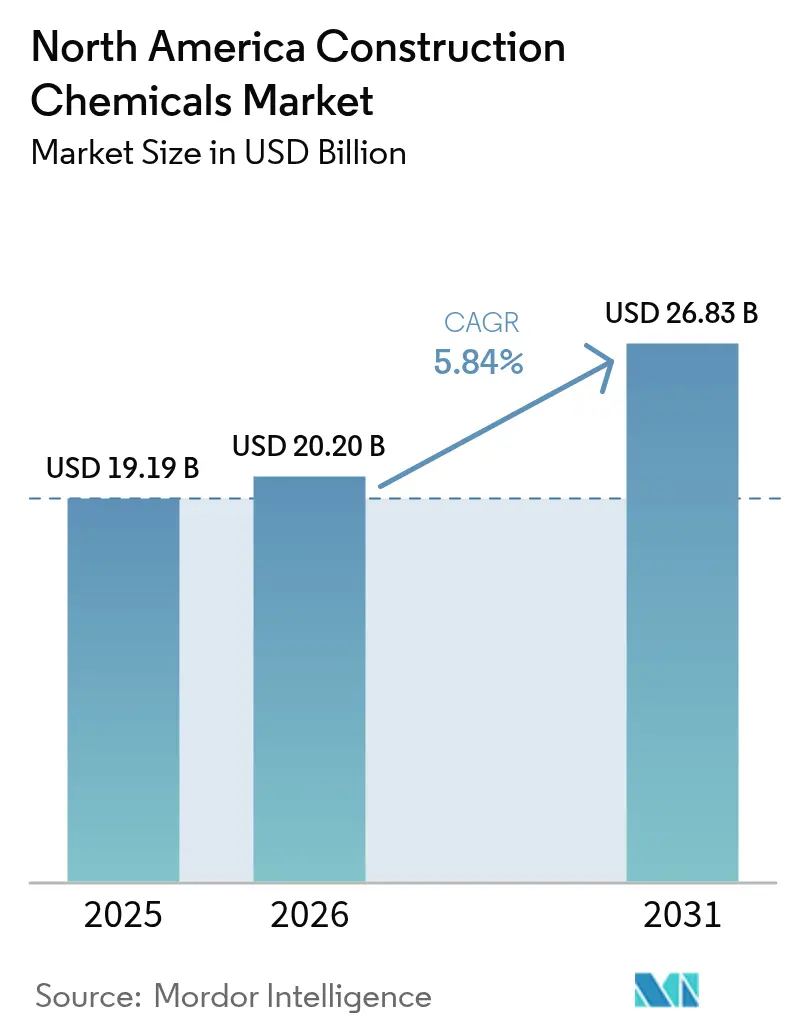
| Base Year Market Size (2025) | USD 19.19 Billion |
| Market Size (2026) | USD 20.20 Billion |
| Market Size (2031) | USD 26.83 Billion |
| Growth Rate (2026 - 2031) | 5.84% CAGR |
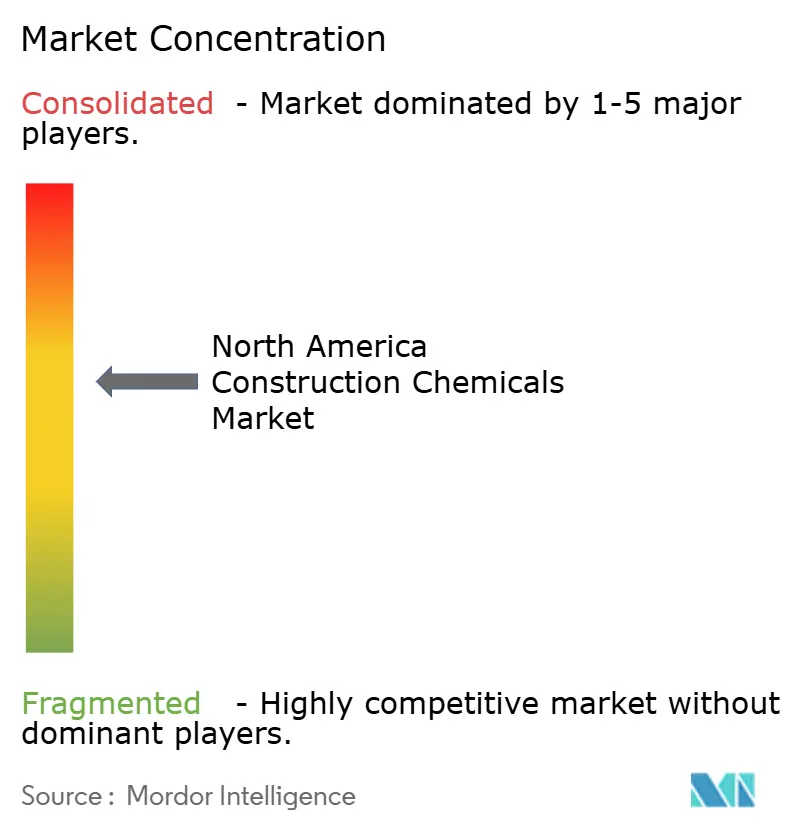
| Market Concentration | Medium |
Major Players *Disclaimer: Major Players sorted in no particular order Image © Mordor Intelligence. Reuse requires attribution under CC BY 4.0. | |
North America Construction Chemicals Market Analysis by Mordor Intelligence
The North America Construction Chemicals Market size is projected to be USD 19.19 billion in 2025, USD 20.20 billion in 2026, and reach USD 26.83 billion by 2031, growing at a CAGR of 5.84% from 2026 to 2031. Recovery-driven federal spending, green building codes, and rapid industrialization are reshaping procurement models toward performance-based contracts that reward suppliers of specialty admixtures, low-carbon binders, and advanced waterproofing systems. Infrastructure owners are embedding chemical-performance warranties into bid documents, which favors vertically integrated multinationals able to offer testing support and just-in-time logistics. Rising adoption of ready-mix and precast methods is translating into consistent demand for water-reducing and accelerator chemistries that compress project cycles and curb labor risk. Parallel decarbonization mandates in California, Washington, and British Columbia are stimulating rapid product substitution toward supplementary cementitious materials activated by next-generation polycarboxylate ether polymers.
Key Report Takeaways
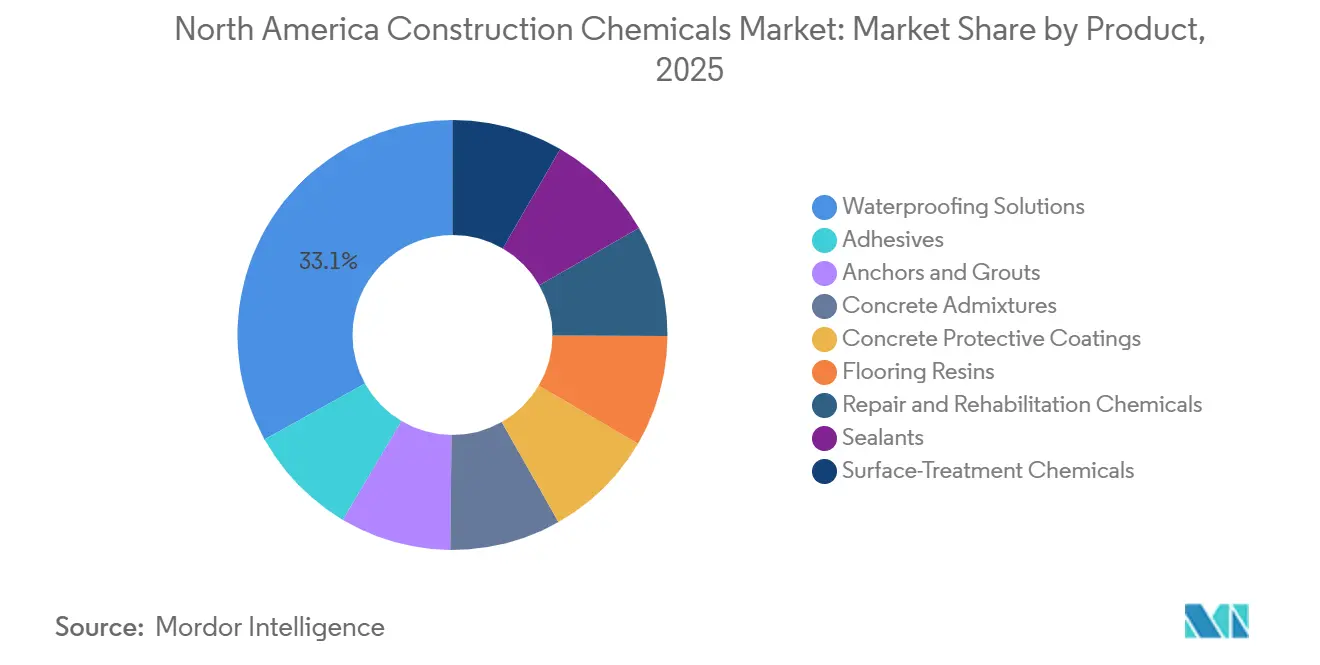
- By product, waterproofing solutions held a 33.07% revenue share in 2025, and the segment is projected to expand at a 6.35% CAGR during the forecast period (2026-2031) as liquid-applied membranes gain traction in both new-build and retrofit projects.
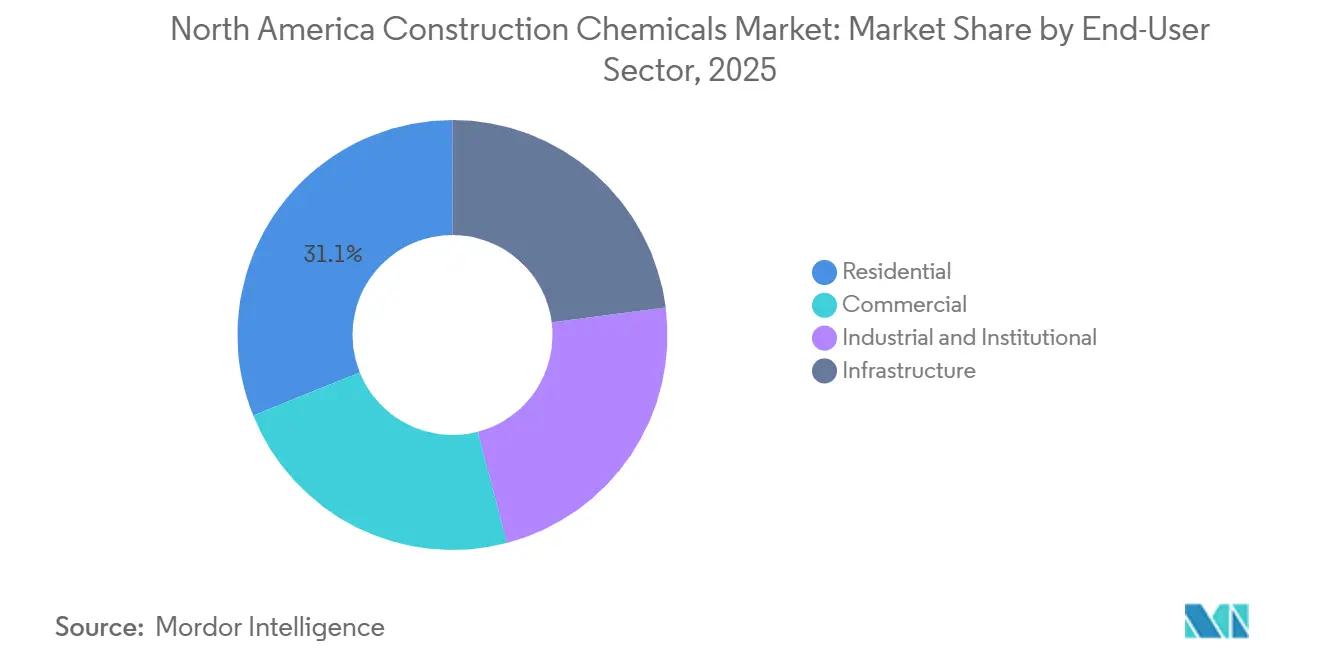
- By end-user sector, Residential construction accounted for 31.11% of the 2025 market, while the Industrial and Institutional category is on track for the fastest growth at a 6.76% CAGR during the forecast period (2026-2031), propelled by data center and semiconductor fab investments.
- By geography, the United States captured 67.72% of North America Construction Chemicals market share in 2025 and is forecast to grow at a 5.90% CAGR during the forecast period (2026-2031).
Note: Market size and forecast figures in this report are generated using Mordor Intelligence’s proprietary estimation framework, updated with the latest available data and insights as of 2026.
North America Construction Chemicals Market Trends and Insights
Drivers Impact Analysis*
| Driver | (~) % Impact on CAGR Forecast | Geographic Relevance | Impact Timeline |
|---|---|---|---|
| Substantial infrastructure spending rebound | +1.20% | United States (IIJA corridors, bridge rehabilitation), Canada (transit hubs, wastewater facilities), Mexico (freight logistics, Tren Maya extension) | Medium term (2-4 years) |
| Rapid uptake of ready-mix and precast construction | +1.10% | United States (Sun Belt metros, data-center clusters), Canada (modular housing, transit stations), Mexico (automotive supplier parks, tilt-up industrial) | Short term (≤ 2 years) |
| Stricter energy-efficiency codes favouring high-performance admixtures | +0.90% | United States (IECC 2024 adopters, 18 states), Canada (National Building Code 2025, net-zero-ready path), Mexico (NOM-020 compliance zones, climate zones 1-2) | Long term (≥ 4 years) |
| Circular-economy mandates for low-carbon binders | +0.80% | California (Buy Clean Act), Washington (HB 1103 carbon fee), British Columbia (CleanBC Roadmap), early adoption in Oregon and New York | Long term (≥ 4 years) |
| Mass-timber hybrid structures needing chemical interface solutions | +0.60% | United States (Pacific Northwest, Great Lakes region), Canada (British Columbia, Ontario), limited penetration in Mexico due to seismic code constraints | Medium term (2-4 years) |
| Source: Mordor Intelligence | |||


Substantial Infrastructure Spending Rebound
Federal capital deployment is accelerating demand for high-performance admixtures, corrosion inhibitors, and fiber wraps that extend service life on bridges, transit hubs, and energy corridors. The United States Infrastructure Investment and Jobs Act sets aside USD 110 billion for surface transportation, with USD 40 billion earmarked for bridge rehabilitation that specifies ASTM C494-compliant water-reducing admixtures[1]American Society of Civil Engineers, “2025 Bridge Conditions Report,” asce.org. Canada’s Investing in Canada Infrastructure Program released CAD 12.4 billion (USD 9.1 billion) in 2025 to upgrade wastewater facilities, stimulating polyurethane grout consumption. Mexico’s National Infrastructure Program targets MXN 2.1 trillion (USD 123 billion) through 2030, driving uptake of anchoring grouts engineered for seismic performance. Performance warranties embedded in bid documents are transferring durability risk to suppliers, amplifying demand for ISO 9001-certified formulations. Multinationals with in-house testing labs now enjoy a qualification edge over regional blenders lacking documented quality systems.
Rapid Uptake of Ready-Mix and Precast Construction
Industrialized building methods are compressing schedules and raising the bar for chemical additives that deliver early-strength and rheology control. United States ready-mix shipments reached 420 million cubic yards in 2025, a 7.3% rise, led by data-center builds in Texas and Virginia that require 28-day strengths above 8,000 psi[2]U.S. Geological Survey, “Mineral Commodity Summary: Cement 2026,” usgs.gov. Precast producers adopting steam curing cut demolding from 18 hours to 8 hours, boosting accelerator demand valued at USD 340 million. Canada’s modular sector delivered 14,200 units in 2024 using viscosity-modifying admixtures that eliminate honeycombing. Mexican industrial parks prefer tilt-up systems with 5-7% air entrainment to manage thermal cycling. Factory-controlled environments also require zero-transfer mold-release agents that meet FDA (Food and Drug Administration) 21 CFR (Code of Federal Regulations) 175.300, broadening chemical demand beyond traditional construction channels.
Stricter Energy-Efficiency Codes Favoring High-Performance Admixtures
New code editions are tightening air-leakage limits and thermal resistance thresholds, elevating the role of admixtures that lower permeability and optimize thermal mass. The International Energy Conservation Code 2024 caps commercial air changes at 3.0 ACH50, driving insulated concrete panel adoption with water-reducers that minimize voids. Canada’s National Building Code 2025 introduces a net-zero-ready path requiring R-27 walls supported by lightweight aggregate mixes that rely on plasticizers for pumpability. Mexico’s NOM-020-ENER-2011 update lowers roof U-values to 0.50 W/m²K, accelerating uptake of reflective roof coatings that trim cooling loads 15-20%. Compliance testing via blower doors and thermography is shifting liability to contractors, prompting higher use of premium polycarboxylate ether super-plasticizers that command 30-40% price premiums over naphthalene products.
Circular-Economy Mandates for Low-Carbon Binders
Decarbonization policies are forcing clinker substitution with supplementary cementitious materials activated by tailored chemical blends. California’s Buy Clean Act limits embodied carbon to 40% below baseline, effectively requiring 30-50% fly-ash or slag replacement. Washington’s HB 1103 imposes a USD 25 per metric ton CO₂e fee from 2026, pushing producers to low-carbon binders. British Columbia’s CleanBC Roadmap aims for a 40% construction-emissions cut by 2030, encouraging alkali-activated slag cement systems. Maintaining workability as clinker drops below 50% is driving R&D (research and development) into block copolymer dispersants; Sika’s 2025 patent filing for a tri-block copolymer admixture illustrates the IP race.
Restraints Impact Analysis*
| Restraint | (~) % Impact on CAGR Forecast | Geographic Relevance | Impact Timeline |
|---|---|---|---|
| Volatile petro-derived resin prices | -0.70% | United States (Gulf Coast producers, import-dependent formulators), Canada (Alberta feedstock, Eastern provinces), Mexico (import-reliant market, 70% resin dependency) | Short term (≤ 2 years) |
| Skilled-labour shortages delaying project starts | -0.50% | United States (Sun Belt states, Texas, Florida, Arizona), Canada (Alberta, Ontario construction hubs), Mexico (northern industrial corridor, Monterrey, Tijuana) | Medium term (2-4 years) |
| Fire-safety rule changes curbing solvent-borne chemistries | -0.30% | California (CARB Rule 1168), New York (NYSERDA standards), limited federal impact, concentrated in high-regulation states | Short term (≤ 2 years) |
| Source: Mordor Intelligence | |||
Volatile Petro-Derived Resin Prices
Epoxy and polyurethane resin prices rose 18% year on year in 2025 after Gulf Coast cracker outages and higher propylene costs. MDI reached USD 2,780 per metric ton as global supply lagged behind insulation demand. Smaller formulators without hedges lost 200-250 basis points of margin and began substituting bio-based acrylics, which cost 25-30% more and underperform in heavy-duty settings. Low hedge penetration leaves the supply chain exposed to geopolitical shocks, making price escalation clauses standard in 2026 project contracts.
Skilled-Labor Shortages Delaying Project Starts
The US construction sector reported 380,000 vacancies in December 2025, with concrete finishing hardest hit. Average finisher wages climbed to USD 28.40, lifting labor costs to over 40% of budgets and incentivizing rapid-set adhesives and self-leveling underlayments that cut installation time by 30-40%. Canada lost 24,000 workers year on year, delaying starts by 8.3 weeks. Mexico’s northern corridor faces an 18,000-worker gap that raised mason wages 22% to MXN 650 (USD 38) daily. Prefabrication now consumes higher volumes of admixtures and anchors per square meter, partially offsetting market drag.
*Our forecasts treat driver/restraint impacts as directional, not additive. The impact forecasts reflect baseline growth, mix effects, and variable interactions.
Segment Analysis
By Product: Waterproofing Dominance Amid Retrofit Surge
Waterproofing systems represented 33.07% of the North America Construction Chemicals market size in 2025 and are forecast to grow at 6.35% during the forecast period (2026-2031), outpacing the broader market. Liquid-applied polyurethane and polyurea membranes are capturing share in plaza decks and parking structures where complex geometries challenge traditional sheet goods. Super-plasticizers within concrete admixtures added USD 1.8 billion in revenues in 2025 as polycarboxylate ether technology delivers water-cement ratios below 0.35 without loss of flow. Adhesives are shifting toward reactive polyurethane grades that meet ANSI (American National Standards Institute) A118.15 shear-strength requirements for mass-timber construction.
Durability standards continue to elevate demand for concrete protective coatings and repair products that extend service life in aggressive environments. Epoxy-phenolic novolac systems protect wastewater tanks down to pH 1.0, while CFRP (Carbon Fiber Reinforced Polymer) wraps offer 550 ksi tensile strength for bridge retrofits. California’s Rule 1168 VOC limits to 50 g/L are prompting reformulation toward moisture-cured silyl-terminated polymers. Multifunctional blends such as SikaTop Seal-107 meet both bond-strength and chloride-penetration tests, underscoring innovation that spans categories.


By End-User Sector: Industrial Gains Outpace Residential Base
Residential building held 31.11% of the North America Construction Chemicals market share in 2025, buoyed by 1.02 million US single-family starts. The industrial and institutional segment, however, is projected to expand at a 6.76% CAGR during the forecast period (2026-2031) as semiconductor fabs and data centers demand ultra-flat, ESD-rated epoxy floors with resistivity between 1.0 × 10⁶ and 1.0 × 10⁹ ohms. Infrastructure projects funded under the IIJA (Infrastructure Investment and Jobs Act) require 45,000 metric tons of fiber composites and injection resins annually through 2028.
Commercial office construction faces headwinds from elevated vacancies, but adaptive-reuse conversions spur niche demand for structural strengthening systems that double live-load capacity without adding dead weight. Institutional owners seek antimicrobial, seamless polyurethane cement floors that withstand thermal shock in kitchens and labs, widening the specification envelope for high-performance coatings. Production homebuilders prioritize water-borne acrylic sealants with 20-year warranties, whereas custom builders in seismic zones choose silicone or polyurethane options rated for ±50% joint movement.
Geography Analysis
The United States generated 67.72% of 2025 revenue in the North America construction chemicals market and is advancing at a 5.90% CAGR to 2031. Texas logged USD 142 billion in construction value during 2025, propelled by Gulf Coast petrochemical expansions and Dallas-Fort Worth data centers that consumed 28,000 metric tons of epoxy resins and sealants. California’s Scope 3 disclosure law accelerates the adoption of alkali-activated slag and geopolymer concretes that reduce embodied carbon by 40% below baseline.
Canadian demand is clustering around transit-oriented development. Toronto’s Ontario Line and Vancouver’s Broadway Extension together call for 320,000 m³ of shotcrete stabilized by accelerators and fiber reinforcement to meet daily advance targets. British Columbia’s Step Code, tightened in 2024, mandates airtightness testing that favors spray-applied polyurethane foams and air-barrier membranes, broadening chemical uptake in the building-envelope segment.
Mexico demonstrates bifurcation between near-shoring industrial hubs and tourism projects. Nuevo León attracted USD 8.2 billion in foreign direct investment in 2025, much of it directed toward automotive and electronics plants requiring ESD (Electrostatic Discharge)-safe flooring and chemical-resistant coatings. Completion of the 1,525 km Tren Maya in 2024 continues to require track-bed grouting and repair mortars to manage settlement in karst regions. Upcoming United States EPA (Environmental Protection Agency) revisions to surface-coating NESHAPs (National Emission Standards for Hazardous Air Pollutants), expected in Q2 2026, will likely tilt industrial purchasing toward high-solids and powder formulations.
Competitive Landscape
The North America Construction Chemicals market is moderately consolidated. Patent filings climbed 17% to 142 in 2025, concentrated in self-healing additives and block-copolymer super-plasticizers. Niche contenders, including LATICRETE and ARDEX, are leveraging rapid-set technologies that allow same-day trafficking, reducing contractor downtime by up to USD 12,000 per project.
North America Construction Chemicals Industry Leaders
Sika AG
Saint-Gobain
RPM International Inc.
MAPEI S.p.A.
HOLCIM
- *Disclaimer: Major Players sorted in no particular order

Recent Industry Developments
- July 2025: Saint-Gobain announced the acquisition of Interstar Materials, a leading North American manufacturer of pigments for concrete applications. This strategic move reinforces Saint-Gobain’s construction chemicals platform and strengthens its presence in the concrete segment across North America.
- March 2025: Sika AG announced the full acquisition of HPS North America, Inc., a well-established supplier of building finishing materials in the United States. HPS distributes Schönox-branded products, manufactured by Sika Germany, across the U.S. market, primarily for flooring applications, including self-leveling and waterproofing solutions.


North America Construction Chemicals Market Report Scope
Construction chemicals are specialized compounds used to enhance the durability, strength, and workability of structures, typically added to concrete, mortar, or paints. They increase project life by protecting against environmental hazards, improving waterproofing, and speeding up construction timelines. Major types include concrete admixtures, flooring compounds, and sealants.
The North America Construction Chemicals Market is segmented by product, end-user sector, and geography. By product, the market is segmented into adhesives, anchors and grouts, concrete admixtures, concrete protective coatings, flooring resins, repair and rehabilitation chemicals, sealants, surface-treatment chemicals, and waterproofing solutions. By end-user sector, the market is segmented into commercial, industrial and institutional, infrastructure, and residential. The report also covers the market sizing and forecasts for 3 countries (the United States, Canada, and Mexico) in the region based on value (USD).
By Product
| Adhesives | Hot-Melt |
| Reactive | |
| Solvent-borne | |
| Water-borne | |
| Anchors and Grouts | Cementitious Fixing |
| Resin Fixing | |
| Concrete Admixtures | Accelerator |
| Air-Entraining | |
| Super-plasticizer | |
| Retarder | |
| Shrinkage-Reducer | |
| Viscosity-Modifier | |
| Plasticizer | |
| Other Types | |
| Concrete Protective Coatings | Acrylic |
| Alkyd | |
| Epoxy | |
| Polyurethane | |
| Other Resins | |
| Flooring Resins | Acrylic |
| Epoxy | |
| Polyaspartic | |
| Polyurethane | |
| Other Resins | |
| Repair and Rehabilitation Chemicals | Fiber-Wrapping Systems |
| Injection Grouting | |
| Micro-concrete Mortars | |
| Modified Mortars | |
| Rebar Protectors | |
| Sealants | Acrylic |
| Epoxy | |
| Polyurethane | |
| Silicone | |
| Other Resins | |
| Surface-Treatment Chemicals | Curing Compounds |
| Mold-Release Agents | |
| Other Types | |
| Waterproofing Solutions | Chemicals |
| Membranes |
By End-User Sector
| Commercial |
| Industrial and Institutional |
| Infrastructure |
| Residential |
By Geography
| United States |
| Canada |
| Mexico |
| By Product | Adhesives | Hot-Melt |
| Reactive | ||
| Solvent-borne | ||
| Water-borne | ||
| Anchors and Grouts | Cementitious Fixing | |
| Resin Fixing | ||
| Concrete Admixtures | Accelerator | |
| Air-Entraining | ||
| Super-plasticizer | ||
| Retarder | ||
| Shrinkage-Reducer | ||
| Viscosity-Modifier | ||
| Plasticizer | ||
| Other Types | ||
| Concrete Protective Coatings | Acrylic | |
| Alkyd | ||
| Epoxy | ||
| Polyurethane | ||
| Other Resins | ||
| Flooring Resins | Acrylic | |
| Epoxy | ||
| Polyaspartic | ||
| Polyurethane | ||
| Other Resins | ||
| Repair and Rehabilitation Chemicals | Fiber-Wrapping Systems | |
| Injection Grouting | ||
| Micro-concrete Mortars | ||
| Modified Mortars | ||
| Rebar Protectors | ||
| Sealants | Acrylic | |
| Epoxy | ||
| Polyurethane | ||
| Silicone | ||
| Other Resins | ||
| Surface-Treatment Chemicals | Curing Compounds | |
| Mold-Release Agents | ||
| Other Types | ||
| Waterproofing Solutions | Chemicals | |
| Membranes | ||
| By End-User Sector | Commercial | |
| Industrial and Institutional | ||
| Infrastructure | ||
| Residential | ||
| By Geography | United States | |
| Canada | ||
| Mexico | ||


Market Definition
- END-USE SECTOR - Construction chemicals consumed in the construction sectors such as commercial, residential, industrial, institutional, and infrastructure are considered under the scope of the study.
- PRODUCT/APPLICATION - Under the scope of the study, the consumption of construction chemical products such as concrete admixtures, repair and rehabilitation chemicals, flooring resins, waterproofing solutions, anchors and grouts, adhesives and sealants, and surface treatment chemicals is considered.
| Keyword | Definition |
|---|---|
| Accelerator | Accelerators are admixtures used to fasten the setting time of concrete by increasing the initial rate and speeding up the chemical reaction between cement and the mixing water. These are used to harden and increase the strength of concrete quickly. |
| Acrylic | This synthetic resin is a derivative of acrylic acid. It forms a smooth surface and is mainly used for various indoor applications. The material can also be used for outdoor applications with a special formulation. |
| Adhesives | Adhesives are bonding agents used to join materials by gluing. Adhesives can be used in construction for many applications, such as carpet laying, ceramic tiles, countertop lamination, etc. |
| Air Entraining Admixture | Air-entraining admixtures are used to improve the performance and durability of concrete. Once added, they create uniformly distributed small air bubbles to impart enhanced properties to the fresh and hardened concrete. |
| Alkyd | Alkyds are used in solvent-based paints such as construction and automotive paints, traffic paints, flooring resins, protective coatings for concrete, etc. Alkyd resins are formed by the reaction of an oil (fatty acid), a polyunsaturated alcohol (Polyol), and a polyunsaturated acid or anhydride. |
| Anchors and Grouts | Anchors and grouts are construction chemicals that stabilize and improve the strength and durability of foundations and structures like buildings, bridges, dams, etc. |
| Cementitious Fixing | Cementitious fixing is a process in which a cement-based grout is pumped under pressure to fill forms, voids, and cracks. It can be used in several settings, including bridges, marine applications, dams, and rock anchors. |
| Commercial Construction | Commercial construction comprises new construction of warehouses, malls, shops, offices, hotels, restaurants, cinemas, theatres, etc. |
| Concrete Admixtures | Concrete admixtures comprise water reducers, air entrainers, retarders, accelerators, superplasticizers, etc., added to concrete before or during mixing to modify its properties. |
| Concrete Protective Coatings | To provide specific protection, such as anti-carbonation or chemical resistance, a film-forming protective coat can be applied on the surface. Depending on the applications, different resins like epoxy, polyurethane, and acrylic can be used for concrete protective coatings. |
| Curing Compounds | Curing compounds are used to cure the surface of concrete structures, including columns, beams, slabs, and others. These curing compounds keep the moisture inside the concrete to give maximum strength and durability. |
| Epoxy | Epoxy is known for its strong adhesive qualities, making it a versatile product in many industries. It resists heat and chemical applications, making it an ideal product for anyone needing a stronghold under pressure. It is widely used in adhesives, electrical and electronics, paints, etc. |
| Fiber Wrapping Systems | Fiber Wrapping Systems are a part of construction repair and rehabilitation chemicals. It involves the strengthening of existing structures by wrapping structural members like beams and columns with glass or carbon fiber sheets. |
| Flooring Resins | Flooring resins are synthetic materials applied to floors to enhance their appearance, increase their resistance to wear and tear or provide protection from chemicals, moisture, and stains. Depending on the desired properties and the specific application, flooring resins are available in distinct types, such as epoxy, polyurethane, and acrylic. |
| High-Range Water Reducer (Super Plasticizer) | High-range water reducers are a type of concrete admixture that provides enhanced and improved properties when added to concrete. These are also called superplasticizers and are used to decrease the water-to-cement ratio in concrete. |
| Hot Melt Adhesives | Hot-melt adhesives are thermoplastic bonding materials applied as melts that achieve a solid state and resultant strength on cooling. They are commonly used for packaging, coatings, sanitary products, and tapes. |
| Industrial and Institutional Construction | Industrial and institutional construction includes new construction of hospitals, schools, manufacturing units, energy and power plants, etc. |
| Infrastructure Construction | Infrastructure construction includes new construction of railways, roads, seaways, airports, bridges, highways, etc. |
| Injection Grouting | The process of injecting grout into open joints, cracks, voids, or honeycombs in concrete or masonry structural members is known as injection grouting. It offers several benefits, such as strengthening a structure and preventing water infiltration. |
| Liquid-Applied Waterproofing Membranes | Liquid-Applied membrane is a monolithic, fully bonded, liquid-based coating suitable for many waterproofing applications. The coating cures to form a rubber-like elastomeric waterproof membrane and may be applied over many substrates, including asphalt, bitumen, and concrete. |
| Micro-concrete Mortars | Micro-concrete mortar is made up of cement, water-based resin, additives, mineral pigments, and polymers and can be applied on both horizontal and vertical surfaces. It can be used to refurbish residential complexes, commercial spaces, etc. |
| Modified Mortars | Modified Mortars include Portland cement and sand along with latex/polymer additives. The additives increase adhesion, strength, and shock resistance while also reducing water absorption. |
| Mold Release Agents | Mold release agents are sprayed or coated on the surface of molds to prevent a substrate from bonding to a molding surface. Several types of mold release agents, including silicone, lubricant, wax, fluorocarbons, and others, are used based on the type of substrates, including metals, steel, wood, rubber, plastic, and others. |
| Polyaspartic | Polyaspartic is a subset of polyurea. Polyaspartic floor coatings are typically two-part systems that consist of a resin and a catalyst to ease the curing process. It offers high durability and can withstand harsh environments. |
| Polyurethane | Polyurethane is a plastic material that exists in various forms. It can be tailored to be either rigid or flexible and is the material of choice for a broad range of end-user applications, such as adhesives, coatings, building insulation, etc. |
| Reactive Adhesives | A reactive adhesive is made of monomers that react in the adhesive curing process and do not evaporate from the film during use. Instead, these volatile components become chemically incorporated into the adhesive. |
| Rebar Protectors | In concrete structures, rebar is one of the important components, and its deterioration due to corrosion is a major issue that affects the safety, durability, and life span of buildings and structures. For this reason, rebar protectors are used to protect against degrading effects, especially in infrastructure and industrial construction. |
| Repair and Rehabilitation Chemicals | Repair and Rehabilitation Chemicals include repair mortars, injection grouting materials, fiber wrapping systems, micro-concrete mortars, etc., used to repair and restore existing buildings and structures. |
| Residential Construction | Residential construction involves constructing new houses or spaces like condominiums, villas, and landed homes. |
| Resin Fixing | The process of using resins like epoxy and polyurethane for grouting applications is called resin fixing. Resin fixing offers several advantages, such as high compressive and tensile strength, negligible shrinkage, and greater chemical resistance compared to cementitious fixing. |
| Retarder | Retarders are admixtures used to slow down the setting time of concrete. These are usually added with a dosage rate of around 0.2% -0.6% by weight of cement. These admixtures slow down hydration or lower the rate at which water penetrates the cement particles by making concrete workable for a long time. |
| Sealants | A sealant is a viscous material that has little or no flow qualities, which causes it to remain on surfaces where they are applied. Sealants can also be thinner, enabling penetration to a certain substance through capillary action. |
| Sheet Waterproofing Membranes | Sheet membrane systems are reliable and durable thermoplastic waterproofing solutions that are used for waterproofing applications even in the most demanding below-ground structures, including those exposed to highly aggressive ground conditions and stress. |
| Shrinkage Reducing Admixture | Shrinkage-reducing admixtures are used to reduce concrete shrinkage, whether from drying or self-desiccation. |
| Silicone | Silicone is a polymer that contains silicon combined with carbon, hydrogen, oxygen, and, in some cases, other elements. It is an inert synthetic compound that comes in various forms, such as oil, rubber, and resin. Due to its heat-resistant properties, it finds applications in sealants, adhesives, lubricants, etc. |
| Solvent-borne Adhesives | Solvent-borne adhesives are mixtures of solvents and thermoplastic or slightly cross-linked polymers such as polychloroprene, polyurethane, acrylic, silicone, and natural and synthetic rubbers. |
| Surface Treatment Chemicals | Surface treatment chemicals are chemicals used to treat concrete surfaces, including roofs, vertical surfaces, and others. They act as curing compounds, demolding agents, rust removers, and others. They are cost-effective and can be used on roadways, pavements, parking lots, and others. |
| Viscosity Modifier | Viscosity Modifiers are concrete admixtures used to change various properties of admixtures, including viscosity, workability, cohesiveness, and others. These are usually added with a dosage of around 0.01% to 0.1% by weight of cement. |
| Water Reducer | Water reducers, also called plasticizers, are a type of admixture used to decrease the water-to-cement ratio in the concrete, thereby increasing the durability and strength of concrete. Various water reducers include refined lignosulfonates, gluconates, hydroxycarboxylic acids, sugar acids, and others. |
| Water-borne Adhesives | Water-borne adhesives use water as a carrier or diluting medium to disperse resin. They are set by allowing the water to evaporate or be absorbed by the substrate. These adhesives are compounded with water as a dilutant rather than a volatile organic solvent. |
| Waterproofing Chemicals | Waterproofing chemicals are designed to protect a surface from the perils of leakage. A waterproofing chemical is a protective coating or primer applied to a structure's roof, retaining walls, or basement. |
| Waterproofing Membranes | Waterproofing membranes are liquid-applied or self-adhering layers of water-tight materials that prevent water from penetrating or damaging a structure when applied to roofs, walls, foundations, basements, bathrooms, and other areas exposed to moisture or water. |


Research Methodology
Mordor Intelligence follows a four-step methodology in all our reports.
- Step-1: Identify Key Variables: The quantifiable key variables (industry and extraneous) pertaining to the specific product segment and country are selected from a group of relevant variables & factors based on desk research & literature review; along with primary expert inputs. These variables are further confirmed through regression modeling (wherever required).
- Step-2: Build a Market Model: In order to build a robust forecasting methodology, the variables and factors identified in Step-1 are tested against available historical market numbers. Through an iterative process, the variables required for market forecast are set and the model is built on the basis of these variables.
- Step-3: Validate and Finalize: In this important step, all market numbers, variables and analyst calls are validated through an extensive network of primary research experts from the market studied. The respondents are selected across levels and functions to generate a holistic picture of the market studied.
- Step-4: Research Outputs: Syndicated Reports, Custom Consulting Assignments, Databases & Subscription Platforms


