Clove Market Size and Share
Clove Market Analysis by Mordor Intelligence
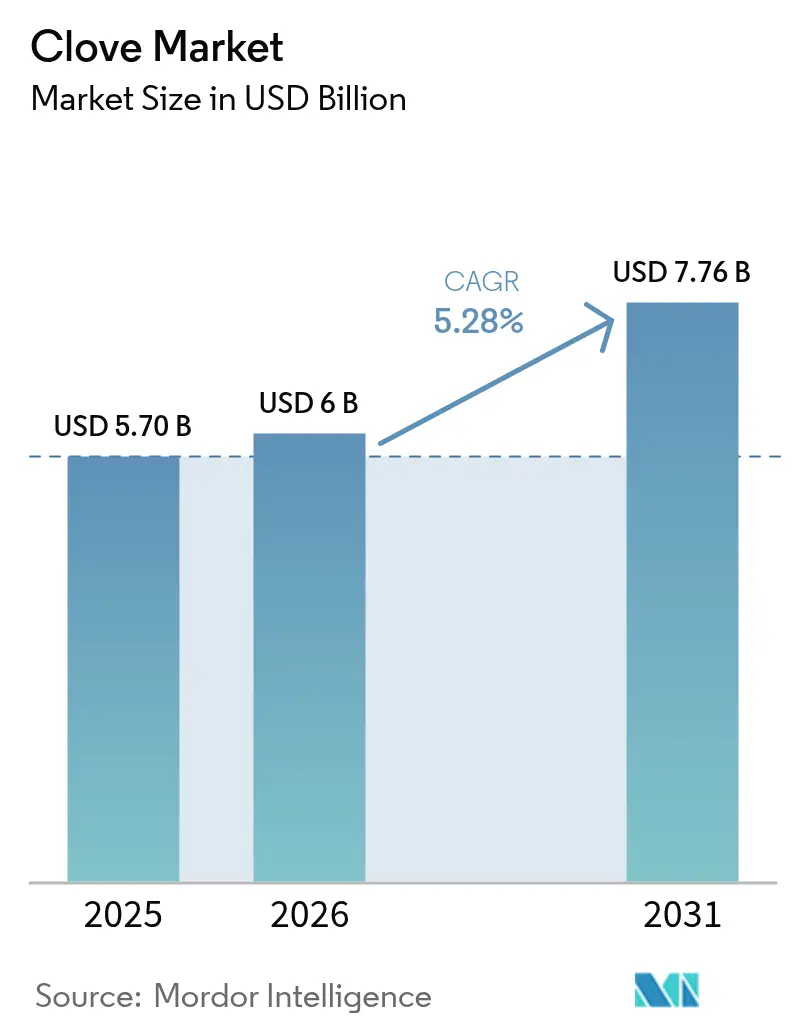
The Clove Market size was valued at USD 5.7 billion in 2025 and estimated to grow from USD 6 billion in 2026 to reach USD 7.76 billion by 2031, at a CAGR of 5.28% during the forecast period (2026-2031). Demand remains anchored in Indonesia’s kretek-tobacco sector, yet wider adoption in food preservation, personal care, and drug discovery are widening revenue streams and reducing cyclic risk. Rising preference for natural preservatives in North America and Europe, combined with stricter limits on synthetic additives, is accelerating the uptake of clove essential oil in active packaging and convenience foods. Parallel investments in agro-rejuvenation across Madagascar and Tanzania are improving output quality, positioning Africa as a challenger in premium export niches. Meanwhile, blockchain-enabled traceability is carving a certified segment that can command a price in the European Union and Japan.
Key Report Takeaways
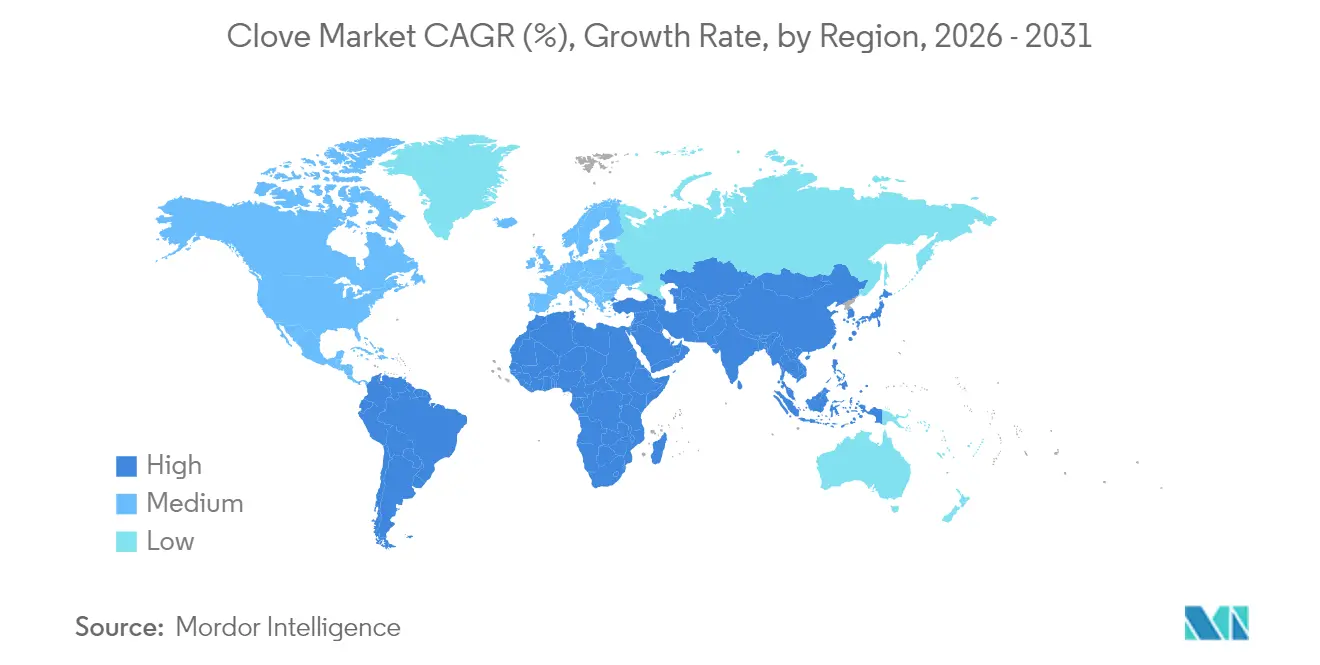
- By region, Asia-Pacific led with a 69.35% revenue share of the clove market in 2025; Africa is projected to expand at a 8.76% CAGR through 2031.
Note: Market size and forecast figures in this report are generated using Mordor Intelligence’s proprietary estimation framework, updated with the latest available data and insights as of 2026.
Global Clove Market Trends and Insights
Drivers Impact Analysis*
| Drivers | (~) % Impact on CAGR Forecast | Geographic Relevance | Impact Timeline |
|---|---|---|---|
| Rising demand from Indonesia's kretek-tobacco industry | +1.8% | Indonesia, Asia-Pacific | Medium term (2-4 years) |
| Expanding use as natural preservative and essential-oil source | +1.2% | Global, with emphasis on Europe and North America | Long term (≥ 4 years) |
| Growth of convenience-food spice blends | +0.8% | North America, Europe, Urban Asia-Pacific | Medium term (2-4 years) |
| Blockchain traceability premiums for certified cloves | +0.6% | Europe, North America, Japan | Long term (≥ 4 years) |
| Replanting subsidies in Madagascar and Tanzania | +0.5% | Africa | Long term (≥ 4 years) |
| Pharmaceutical interest in eugenol-based actives | +0.7% | Global, with emphasis on North America and Europe | Long term (≥ 4 years) |
| Source: Mordor Intelligence | |||
Expanding Use as Natural Preservative and Essential Oil Source
Food manufacturers are reducing synthetic preservatives in favor of essential oils rich in antimicrobials. Clove oil, composed of 90% eugenol, has demonstrated efficacy against Shigella flexneri and Salmonella enterica, extending shelf life for meat, dairy, and baked goods. Active-packaging innovators embed clove actives into polymer films, adding safety without altering product flavor[1]Source: Antioxidants Journal, “Emerging Extraction Technologies for Clove Oil,” mdpi.com. Rising demand from clean-label product developers is pushing food-grade clove oil consumption upward, widening the revenue pool beyond the commodity spice trade.
Growth of Convenience-Food Spice Blends
Urban households in Europe, North America, and Asia increasingly purchase ready-to-use seasoning mixes that replicate restaurant flavors. These blends often combine cloves, cinnamon, and other warming spices, translating culinary heritage into easy pantry staples. Remote-work culture has lengthened home cooking occasions, and producers price blend formats at 35% above raw clove equivalents, improving per-unit returns. Product development teams thus seek stable clove supplies with consistent volatile oil profiles to maintain flavor precision.
Blockchain Traceability Premiums for Certified Cloves
Blockchain platforms record each transaction from farm to buyer, deterring adulteration and validating organic status. European and North American importers pay 18% premiums for batches carrying immutable digital certificates that detail origin, pesticide tests, and moisture levels. Producers leveraging IoT moisture sensors and real-time geo-tagged shipping data achieve faster customs clearance and secure forward contracts from multinational food and pharma buyers.
Rising Demand from Indonesia’s Kretek-Tobacco Industry
Indonesia's kretek cigarette industry represents a paradoxical market force, consuming 95% of the country's cigarette market while driving global clove demand despite health concerns. As the world's second-largest cigarette market, with over 300 billion cigarettes consumed annually, Indonesia's domestic clove consumption creates a unique market dynamic where the country must import additional cloves despite being the largest producer. The industry's economic significance extends beyond consumption, employing millions of Indonesians and contributing to excise taxes, representing about 10% of government tax revenue. The recent expansion of operations by Philip Morris International in Indonesia further solidifies this demand pattern, as the company adapts global tobacco technologies to local production while marketing kretek as cultural commodities rather than health hazards.[2]Source: London School of Economics and Political Science, "Kretek Capitalism: Making, Marketing, and Consuming Clove Cigarettes in Indonesia."
Restraints Impact Analysis*
| Restraint | (~) % Impact on CAGR Forecast | Geographic Relevance | Impact Timeline |
|---|---|---|---|
| Weather-driven price volatility | −0.9% | Indonesia, Madagascar, Tanzania | Short term (≤ 2 years) |
| Adulteration and inconsistent quality | -0.7% | Global, with emphasis on developing markets | Short term (≤ 2 years) |
| Stricter EU pesticide / aflatoxin limits | -0.6% | Europe, with impact on global exporters | Medium term (2-4 years) |
| Synthetic eugenol substitutes | -0.5% | Global, primarily affecting essential oil market | Long term (≥ 4 years) |
| Source: Mordor Intelligence | |||
Weather-Driven Price Volatility
Cyclones in Madagascar cut 2024 output. Similar drought episodes in Tanzania tighten regional supply, forcing spot buyers to renegotiate at elevated rates. Price unpredictability discourages long-term contracts for food processors and heightens the risk of substitution by synthetic eugenol or alternative spices.
Adulteration and Inconsistent Quality
Visual inspection alone cannot detect spent cloves or artificial coloring. European laboratories, therefore, test eugenol concentrations, expecting genuine oil to hold 80% purity. Non-compliant shipments face rejection or deep discounts, eroding producer margins. Investment in chromatographic testing and digital certification is increasing, yet uneven adoption across smallholder supply chains prolongs the authenticity challenge.
*Our forecasts treat driver/restraint impacts as directional, not additive. The impact forecasts reflect baseline growth, mix effects, and variable interactions.
Geography Analysis
Asia-Pacific dominates the global clove market, with Indonesia accounting for over 70% of global production. Sri Lanka and China follow with production volumes of 5,722 and 1,320 metric tons, respectively, in recent harvests. Indonesia's market leadership stems from its position as both a major producer and consumer, with its domestic kretek cigarette industry consuming 85-90% of local production. The region has expanded into clove essential oil extraction, with Indonesia developing new processing facilities to increase raw material value. In 2023, Indonesia exported primarily to Saudi Arabia, India, Bangladesh, the United Arab Emirates, the United States, and Pakistan, with Saudi Arabia and India as the principal importers.
Africa represents the fastest-growing regional market, with a projected CAGR of 8.76% between 2026-2031, supported by investments in production capacity and processing infrastructure. Madagascar, Tanzania, and Comoros maintain significant production levels. The region benefits from replanting programs and government subsidies designed to renovate aging plantations and enhance yield quality. Tanzania's Morogoro Region produced about 2,000 metric tons of cloves in 2022, contributing substantially to national output through the Southern Agricultural Corridor of Tanzania (SAGCOT) initiative.
Europe maintains a substantial import market for cloves, with the Netherlands functioning as the main trade hub, followed by Germany, the UK, France, Spain, and Poland. Regional demand increases from the rising popularity of Asian cuisines and the increased use of specialized spice blends in convenience foods. European imports from developing countries grew by 2.5% annually between 2018 and 2022, reaching 3,500 metric tons in 2021, with Madagascar serving as a primary supplier to the Netherlands and Germany.


Competitive Landscape
Recent Industry Developments
- March 2025: The Global Environment Facility approved USD 10 million to strengthen climate-smart spice value chains in Comoros, including extensive clove farmer support.
- February 2025: GEM Aromatics expanded production capacity in India under the National Production Linked Incentive framework, focusing on high-purity pharmaceutical clove oil.
- December 2024: The European Commission enforced stricter pesticide maximum residue limits for imported cloves, elevating compliance costs but opening premium lanes for certified suppliers.


Research Methodology Framework and Report Scope
Market Definitions and Key Coverage
Our study defines the global clove market as the traded value and volume of dried Syzygium aromaticum flower buds sold whole, ground, or distilled into oil that move through commercial channels for food, beverage, personal care, pharmaceutical, and industrial uses. According to Mordor Intelligence, stems and leaves processed exclusively for on-farm compost or non-commercial craft applications fall outside this boundary.
Scope exclusion: finished consumer products in which clove is only a minor ingredient, such as toothpaste tubes or kretek cigarettes, are not valued within the market total.
Segmentation Overview
-
By Geography (Production Analysis (Volume), Consumption Analysis (Volume and Value), Import Analysis (Volume and Value), Export Analysis (Volume and Value), and Price Trend Analysis)
-
North America
- United States
- Canada
-
Europe
- Germany
- France
- United Kingdom
- Italy
- Netherlands
- Spain
-
Asia-Pacific
- Indonesia
- India
- China
- Sri Lanka
- Vietnam
- Malaysia
- Singapore
-
South America
- Brazil
- Argentina
- Chile
-
Middle East
- Saudi Arabia
- United Arab Emirates
-
Africa
- Comoros
- Kenya
- Tanzania
- Madagascar
-
North America
Detailed Research Methodology and Data Validation
Primary Research
Seasoned exporters, plantation agronomists, spice-blend processors, and bulk oil distillers across Southeast Asia, East Africa, Europe, and North America shared insights on farm-gate yields, quality premiums, contract pricing, and emerging organic certification trends. These interviews and short surveys helped us validate secondary signals and adjust conversion ratios between dried buds, powder, and oil.
Desk Research
Mordor analysts started with public statistical repositories such as FAOSTAT, UN Comtrade, the International Trade Center Trade Map, the Indonesian Ministry of Agriculture, USDA GAIN reports, and the Spices Board of India to pinpoint production, trade, and price curves. We then drew supporting context from peer-reviewed journals on eugenol extraction, regional spice trade associations, and major media archived through Dow Jones Factiva. Company financial snapshots from D&B Hoovers and customs shipment tallies enriched supply-side granularity. This list illustrates core references; many other credible sources informed data checks and clarifications.
Market-Sizing & Forecasting
A top-down reconstruction links national production and net trade flows to apparent consumption, followed by selective bottom-up cross-checks from sampled processor revenues and average selling prices. Key model drivers include harvested area, yield per hectare, kretek cigarette clove demand index, average export price (USD /kg), share of buds diverted to oil distillation, and retail penetration of organic spices. Multivariate regression, benchmarked against historical weather anomalies, projects each driver. ARIMA smoothing handles short data gaps before results are currency adjusted and inflation neutralized.
Data Validation & Update Cycle
Outputs pass a two-step peer review, anomaly flags prompt a revisit of sources, and variance beyond predefined bands triggers follow-up calls with respondents. Reports refresh every twelve months, with interim updates when material events, such as cyclones, export bans, or tariff shifts, occur; a final analyst check ensures clients receive the most current view.
Why Mordor's Clove Market Baseline Remains Trusted
Published estimates often diverge because firms pick different product mixes, price references, and refresh cadences. Our disciplined scope, live field inputs, and annual re-benchmarks keep the baseline steady yet responsive.
Key gap drivers include exclusion of high-value clove oil by some publishers, blanket average selling prices that miss regional premiums, and models locked to outdated FAO harvest tables without weather-led corrections.
Benchmark comparison
| Market Size | Anonymized source | Primary gap driver |
|---|---|---|
| USD 5.70 B (2025) | Mordor Intelligence | - |
| USD 5.88 B (2025) | Global Consultancy A | limited primary validation of producer inventory swings |
| USD 1.32 B (2024) | Industry Association B | excludes distilled oil and value-added derivatives |
| USD 6.10 B (2024) | Regional Consultancy C | uniform ASP, no inflation or currency normalization |
The comparison shows that when scope breadth, variable selection, and timely audits converge as they do in Mordor's approach, decision-makers gain a balanced, transparent baseline they can confidently reference.


Key Questions Answered in the Report
What is the present value of the cloves market and how fast is it growing?
The cloves market is valued at USD 6 billion in 2026 and is forecast to expand at a 5.28% CAGR, reaching USD 7.76 billion by 2031.
Which region currently leads global clove production?
Asia-Pacific leads, with Indonesia alone contributing about 70% of world output while retaining most supply for its kretek-tobacco industry.
Why is clove oil demand rising in the pharmaceutical sector?
Clove oil’s high eugenol content exhibits antimicrobial, anti-inflammatory, and analgesic properties, prompting new formulations in topical medicines, oral-care products, and controlled-release drug carriers.
How does blockchain technology benefit clove exporters?
Blockchain records secure provenance data, reduces fraud, and meets European and North American buyer requirements, allowing certified batches to earn 15-20% price premiums.
What risks threaten stable clove supply?
Harvest fluctuations due to weather conditions in Madagascar and Tanzania, combined with oil adulteration issues, result in price volatility and unreliable supply for spice processors and food manufacturers.
What price advantage do organic cloves achieve over conventional lots?
Certified organic cloves command 25-30% premiums, with an extra 5-10% when blockchain verification accompanies the certification.
Page last updated on:


