
Market Overview
| Study Period | 2020 - 2031 |
|---|---|
| Market Size (2026) | USD 11.45 Billion |
| Market Size (2031) | USD 32.45 Billion |
| Growth Rate (2026 - 2031) | 23.15 % |
| Fastest Growing Market | Asia Pacific |
| Largest Market | North America |
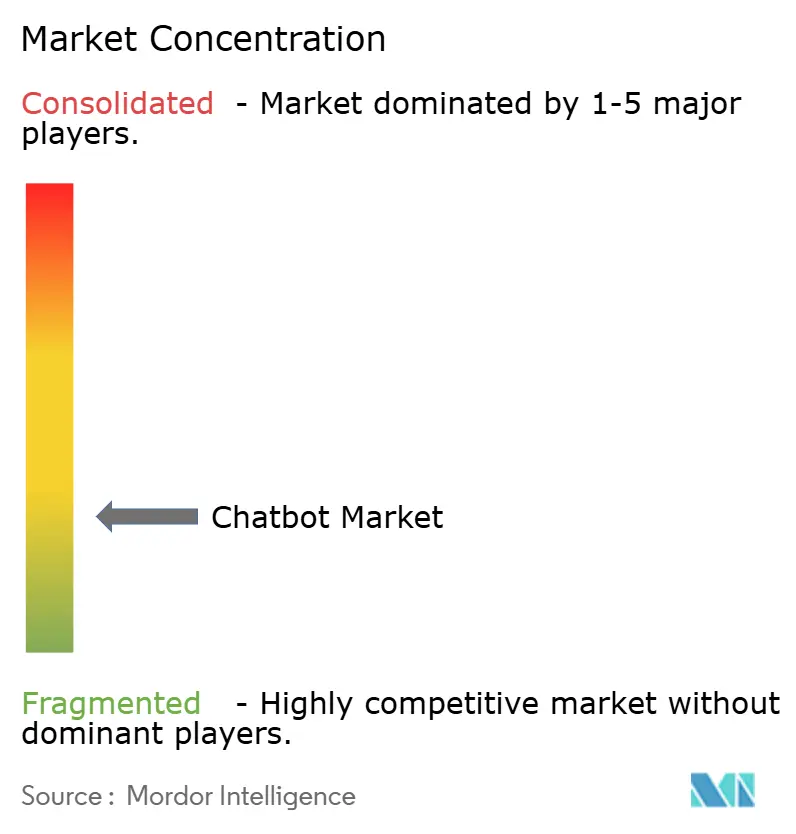
| Market Concentration | Low |
Major Players *Disclaimer: Major Players sorted in no particular order Image © Mordor Intelligence. Reuse requires attribution under CC BY 4.0. | |
Chatbot Market Analysis by Mordor Intelligence
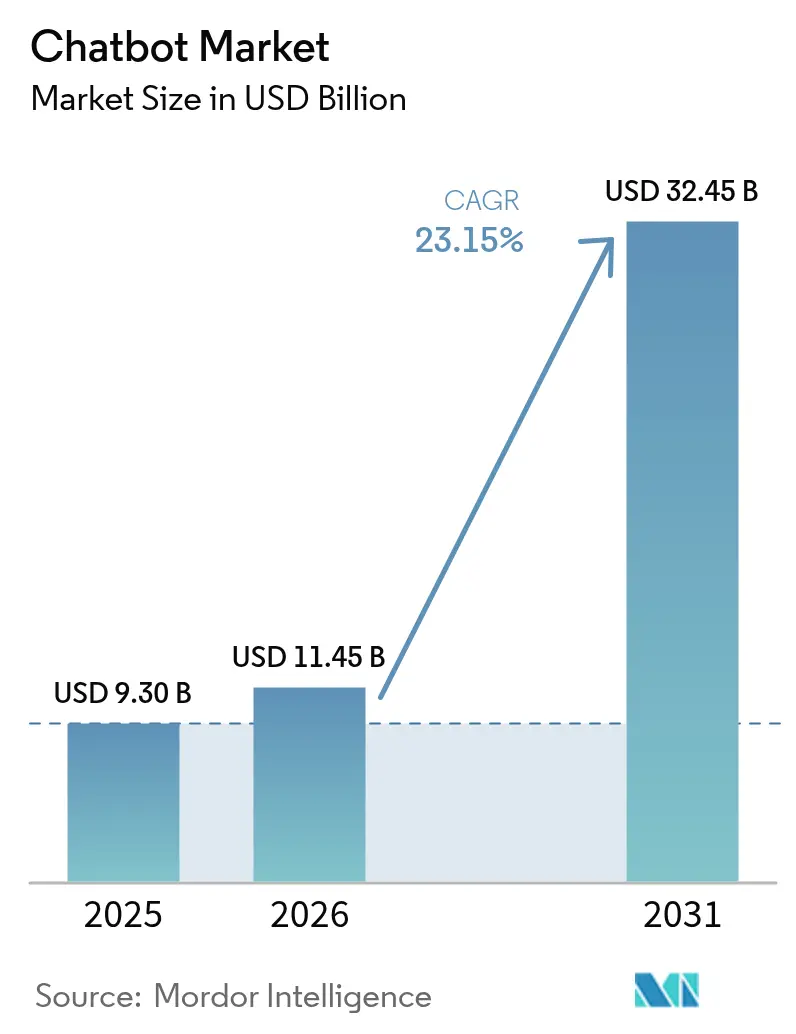
The Chatbot market size is expected to grow from USD 9.30 billion in 2025 to USD 11.45 billion in 2026 and is forecast to reach USD 32.45 billion by 2031 at 23.15% CAGR over 2026-2031. This sustained expansion is propelled by ubiquitous messaging-app reach, rapid advances in large-language-model performance, and mounting cost pressures on traditional contact-center operations. Customer experience leaders now prioritize autonomous, always-on channels that lower service costs while sustaining human-like interactions across voice, text, and multimodal interfaces. Platform vendors respond by embedding retrieval-augmented generation, multilingual models, and fine-tuned domain agents that reduce development cycles and democratize deployment. As enterprises seek measurable ROI, vendors emphasize outcome-linked pricing, proactive compliance tooling, and verticalized knowledge packs that accelerate time-to-value in regulated industries. Competitive intensity is rising as global hyperscalers, independent specialists, and CX outsourcers consolidate capabilities through acquisitions, partnerships, and strategic capital infusions.
Key Report Takeaways
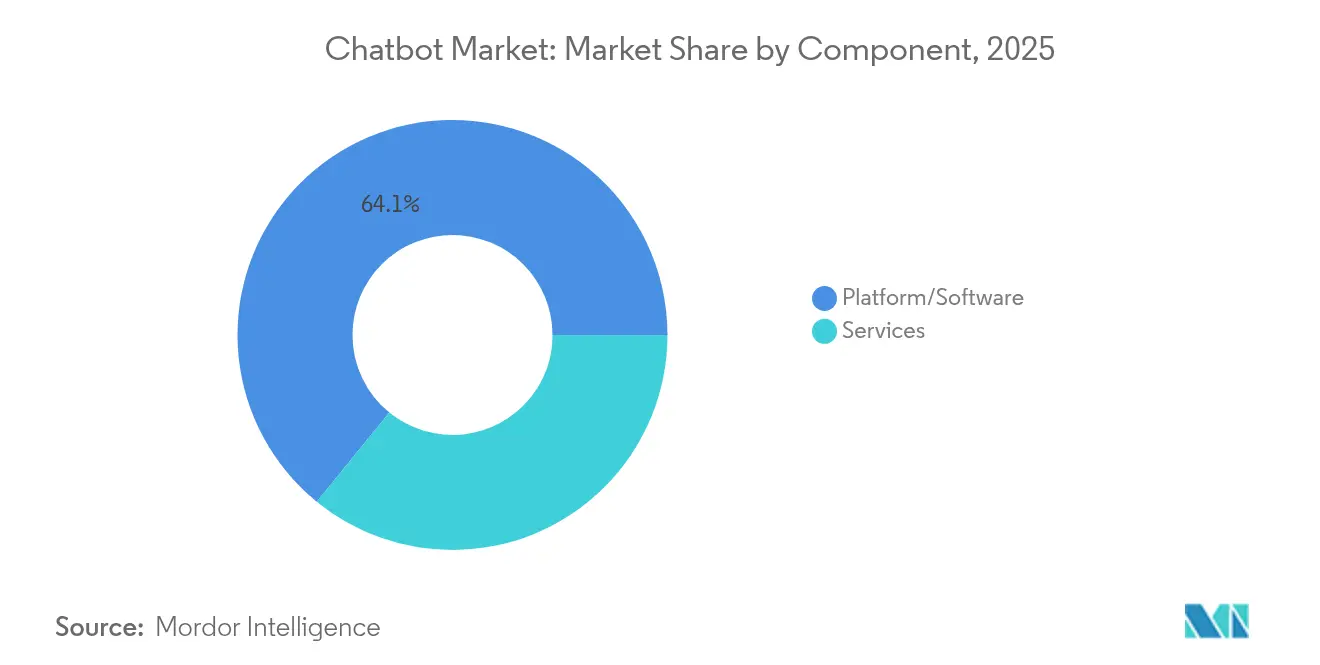
- By component, platform, and software, captured 64.12% revenue share of the Chatbot market in 2025; services are projected to expand at a 24.12% CAGR through 2031.
- By application, customer support accounted for 41.82% of the Chatbot market size in 2025, while HR and recruiting are advancing at a 24.86% CAGR to 2031.
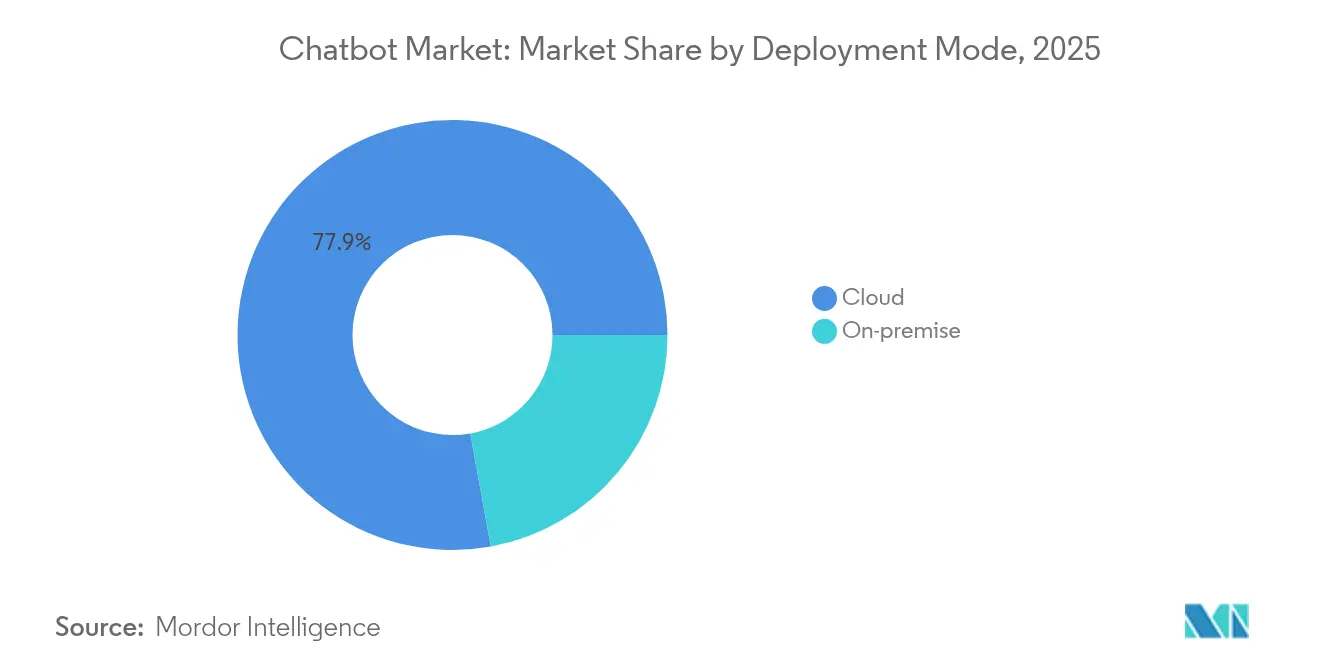
- By deployment mode, cloud maintained 77.85% share of the Chatbot market in 2025 and is forecast to grow at 24.05% CAGR through 2031.
- By organization size, large enterprises led with 67.45% of Chatbot market share in 2025; small and medium enterprises record the highest projected CAGR at 24.58% through 2031.
- By end-user industry, retail and eCommerce held 27.95% revenue share of the Chatbot market in 2025; healthcare is poised to register a 24.97% CAGR through 2031.
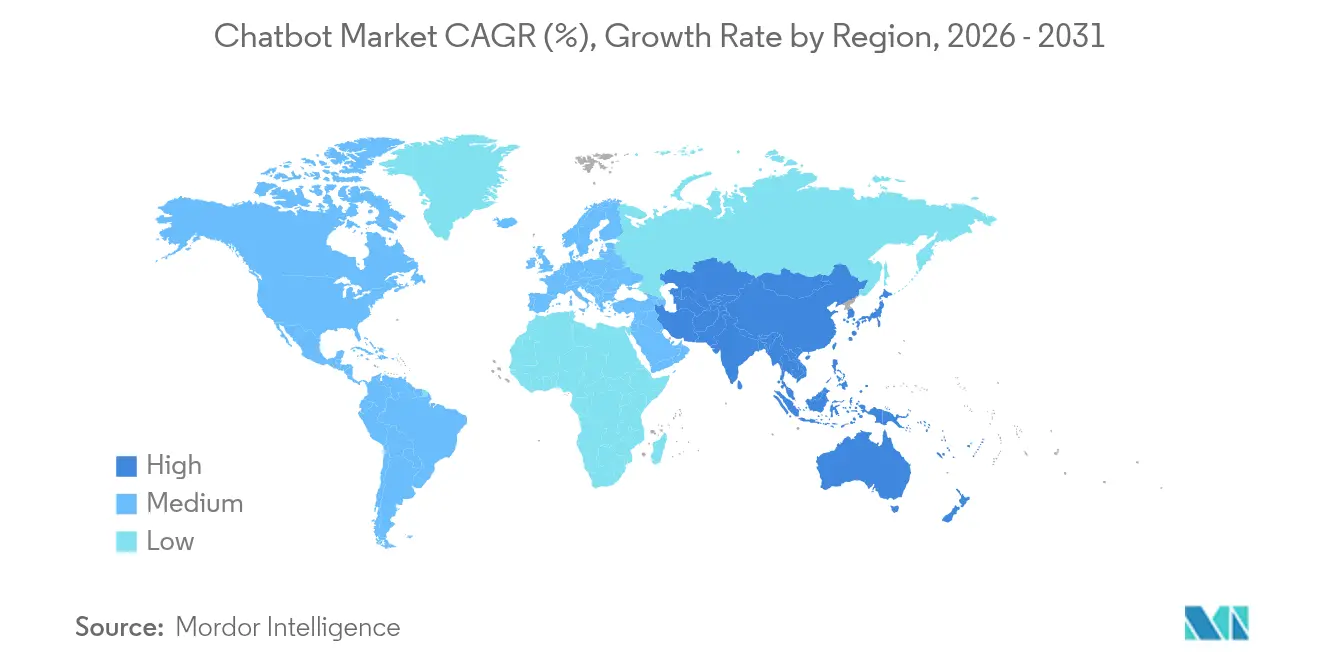
- By geography, North America commanded 38.72% of the Chatbot market size in 2025, while Asia-Pacific is expanding at a 24.71% CAGR to 2031.
Note: Market size and forecast figures in this report are generated using Mordor Intelligence’s proprietary estimation framework, updated with the latest available data and insights as of 2026.
Market Trends and Insights
Drivers Impact Analysis of Chatbot Market*
| Driver | (~) % Impact on CAGR Forecast | Geographic Relevance | Impact Timeline |
|---|---|---|---|
| Explosion of messaging-app user base | +4.2% | Global, with APAC leading adoption | Medium term (2-4 years) |
| Breakthroughs in large-language-model (LLM) NLP | +5.8% | North America and the EU core, expanding globally | Short term (≤ 2 years) |
| 24/7 customer-support cost pressure | +3.9% | Global, particularly in high-labor-cost regions | Short term (≤ 2 years) |
| Self-service mandates in digital CX strategies | +3.1% | North America and the EU, spreading to APAC | Medium term (2-4 years) |
| Voice-first and multimodal bot convergence | +2.7% | Global, with early adoption in North America | Long term (≥ 4 years) |
| LLM-powered internal knowledge automation | +3.3% | Enterprise-focused, primarily North America and the EU | Medium term (2-4 years) |
| Source: Mordor Intelligence | |||
Explosion of Messaging-App User Base
WhatsApp now serves 3 billion users and supports 175 million daily business conversations, giving the Chatbot market an immense, ready-made distribution channel. [1]Sinch Team, “Not Using Chatbots? Why Small Businesses Are Missing Out!,” Sinch, sinch.com Businesses have opened 764 million WhatsApp Business accounts that achieve 98% open rates versus 20% for email, dramatically lowering acquisition costs. The broader messaging ecosystem engages more than 200 million businesses worldwide, creating strong network effects that improve bot ROI across retail, banking, and healthcare. Firms leverage rich-media templates that shift interactions from marketing prompts to full-funnel transactions without requiring app downloads. As user familiarity rises, message-based journeys become the default interface for service queries, order tracking, and in-channel payments.
Breakthroughs in Large-Language-Model NLP
The launch of GPT-4.5 and expected GPT-5 models enabled chatbots to manage complex multi-turn dialogues with near-human fluency. [2]MKDev Editorial, “ChatGPT & EU AI Act: AI Literacy for Business,” MKDev, mkdev.me Enterprises such as Morgan Stanley showcased GPT-4 for internal knowledge retrieval, reducing advisor search time and boosting compliance confidence. Vendors embed retrieval-augmented generation so bots pull real-time data yet maintain conversation flow, addressing historical knowledge-cutoff limits. Yellow.ai orchestrates multi-LLM pipelines over 16 billion annual conversations, selecting specialized models per query to optimize cost and accuracy. These innovations cut training-data demands and open advanced conversational AI to SMEs lacking large labeled datasets.
24/7 Customer-Support Cost Pressure
AI chatbots deliver savings of USD 4.13 per interaction compared with human agents, driving 70% cost reductions for Vodafone and USD 150 million annual savings for Alibaba. Klarna’s AI agent now performs the workload of 700 humans, illustrating scalable economics. Beyond labor, organizations save on training, attrition, and shift-premium outlays while maintaining response times under 5 seconds. The cost gap widens as wages climb, compelling firms in retail, telecom, and travel to accelerate deployment of autonomous frontline agents.
Self-Service Mandates in Digital CX Strategies
Customer experience roadmaps now center on self-service, with 96% of shoppers believing firms should offer chatbots for support. Sixty-four percent of CX leaders plan to enhance bot capabilities by 2025 to satisfy digital-first preferences and reduce call volumes. Internal users mirror consumer expectations, pushing organizations to roll out knowledge bots for HR, IT, and finance help desks. High adoption correlates with higher Net Promoter Scores and lower abandonment rates, reinforcing investment momentum.
Restraints Impact Analysis of Chatbot Market*
| Restraint | (~) % Impact on CAGR Forecast | Geographic Relevance | Impact Timeline |
|---|---|---|---|
| Integration complexity and legacy data silos | -2.8% | Global, particularly in established enterprises | Medium term (2-4 years) |
| Privacy/regulatory compliance concerns | -3.4% | EU and North America leading, global expansion | Short term (≤ 2 years) |
| Hallucination-driven brand-risk | -2.1% | Global, with higher impact in regulated industries | Short term (≤ 2 years) |
| Scarcity of vertical-grade training datasets | -1.9% | Global, with acute shortages in specialized domains | Long term (≥ 4 years) |
| Source: Mordor Intelligence | |||
Integration Complexity and Legacy Data Silos
Enterprises with decades-old systems face month-long timeline overruns when wiring chatbots into mainframes, CRMs, and ERPs. [3]BotsCrew Insights, “How Enterprise Chatbot Solutions & AI Are Shaping the Future of Big Businesses,” botscrew.com Forty-seven percent of firms build generative AI in-house to control data pipelines, reflecting integration anxiety. Middleware orchestration, real-time synchronization, and stringent security vetting inflate project budgets and delay full rollout, especially in banking and telecom, where data fragmentation is acute. As a result, greenfield digital-native firms gain time-to-market advantage, pressing incumbents to invest in API modernization.
Privacy/Regulatory Compliance Concerns
The EU AI Act, effective August 2024, mandates transparency notices, illegal-content safeguards, and human oversight, with fines up to EUR 35 million or 7% of global turnover for violations. Fortune 500 adoption of ChatGPT continues despite legal ambiguity, illustrating tension between innovation and risk. High-profile missteps, including Air Canada’s chatbot publishing erroneous fare policies and NYC municipal bots offering unlawful advice, spotlight brand exposure. Annual compliance outlays near EUR 29,277 per AI system, reshaping vendor selection criteria toward auditability and governance features.
*Our forecasts treat driver/restraint impacts as directional, not additive. The impact forecasts reflect baseline growth, mix effects, and variable interactions.
Chatbot Market Segment Analysis
By Component:
Services Surge Despite Platform DominancePlatform and software offerings retained a 64.12% share of the Chatbot market in 2025, underscoring their role as foundational infrastructure. Services, however, outpace overall growth at a 24.12% CAGR through 2031. Enterprises increasingly seek advisory, integration, and optimization expertise as conversational AI complexity rises. Yellow.ai packages full-lifecycle support covering strategy, custom model tuning, and ongoing governance, driving services demand. For clients, expert partners mitigate integration pain points and ensure compliance, turning vendor know-how into tangible business outcomes that justify premium fees.
Implementation consulting is often bundled with managed-service SLAs that guarantee uptime, retraining, and quarterly performance reviews. This shift nudges revenue mix toward recurring service contracts, smoothing vendor cash flows. As AI tooling matures, differentiation hinges less on base technology and more on outcome-driven engagement, favoring providers with deep vertical playbooks and robust partner ecosystems. The Chatbot market expects continued platform consolidation alongside a flourishing services layer that captures expanding wallet share.



By Application:
HR Automation Accelerates Beyond Customer SupportCustomer support commanded 41.82% of the Chatbot market share in 2025, reflecting high ticket volumes and proven ROI. HR and recruiting use cases, however, register the quickest rise with a 24.86% CAGR through 2031. Bots prescreen candidates, schedule interviews, and answer policy questions, freeing HR teams for high-touch activities. Enterprises report 90% automation of repetitive inquiries and accelerated time-to-hire, translating into measurable productivity gains.
Sales and marketing bots nurture leads via personalized drip conversations, while IT service-desk agents reset passwords and diagnose hardware issues. Emerging internal knowledge assistants aggregate structured and unstructured content, cutting search cycles. This functional diversification underscores conversational AI’s versatility and cements its status as a core automation pillar rather than a niche support add-on.
By Deployment Mode:
Cloud Dominance Reinforces Scalability PreferencesCloud deployments accounted for 77.85% of the Chatbot market in 2025 and are expanding at a 24.05% CAGR. Elastic compute, pay-as-you-grow economics, and managed security updates resonate with firms scaling traffic peaks. Vendors strengthen data-residency guarantees and bring-your-own-key encryption to soothe sovereignty concerns. Enterprises facing stringent rules adopt hybrid designs that keep sensitive data on-premises while invoking cloud GPUs for inference. Nearly half of large enterprises still pursue on-premise builds to safeguard proprietary models, yet rising infrastructure expense curbs widespread uptake.
By Organization Size:
SME Adoption Accelerates Market DemocratizationLarge enterprises held 67.45% of the Chatbot market share in 2025, leveraging budgets to deploy multi-channel, multilingual agents. Small and medium enterprises nevertheless drive the fastest expansion at 24.58% CAGR.
Low-code builders and subscription pricing remove technical and financial barriers, letting SMEs deploy bots in days. One study found SMEs trimmed average response times by 96% and lifted qualified-lead capture after rolling out chatbots. Regulatory clarity under the EU AI Act creates standardized guardrails that benefit resource-constrained firms, narrowing compliance gaps relative to larger peers.
By End-user Industry:
Healthcare Surge Outpaces Retail LeadershipRetail and eCommerce maintained a 27.95% share of the Chatbot market revenue in 2025, propelled by order-tracking, product discovery, and promo-code bots. Healthcare, however, records a 24.97% CAGR as providers adopt 24/7 triage and scheduling assistants that alleviate staff shortages. MediBuddy achieved 90% satisfaction scores through automated symptom checks, while U.S. hospital chains use intake bots to streamline admissions.
BFSI continues steady uptake for balance inquiries and KYC tasks, and government agencies pilot citizen-service bots that cut queue times. Industry diversification demonstrates the technology’s widening acceptance across mission-critical workflows.
Geography Analysis
North America and LATAM Chatbot Market
North America contributed 38.72% to the Chatbot market size in 2025, anchored by early LLM adoption and high labor costs that sharpen automation payback. U.S. financial institutions and retailers implement advanced voice-plus-vision agents, and Canadian enterprises tap GPT-4 for internal knowledge retrieval. Mature digital infrastructure and vibrant venture funding support continuous experimentation that spills over into Latin America through nearshore service hubs.
APAC Chatbot Market
Asia-Pacific posts the fastest 24.71% CAGR through 2031 as governments back AI investments and mobile commerce proliferates. China poured USD 2.1 billion into AI projects, India’s chatbot segment grows 25% annually, and Singapore positions itself as an AI governance testbed. High smartphone penetration and super-app ecosystems generate massive conversational traffic, accelerating adoption in banking, travel, and public services. Local vendors tailor multilingual bots to regional dialects, fostering inclusive digital access.
EMEA and South America Chatbot Market
Europe advances under the shadow of the EU AI Act, balancing innovation with rigorous compliance. Germany, France, and the U.K. integrate chatbots into manufacturing, healthcare, and public administration, with annual compliance budgets absorbed into total cost of ownership calculations. Standardized governance frameworks enhance cross-border collaborations and set de-facto global norms. Emerging regions, South America, the Middle East, and Africa benefit from falling cloud costs and expanding broadband, unlocking greenfield deployments across telecom, energy, and transport.

Regulatory Landscape
Globally, chatbot deployments are shifting from voluntary trust and safety guidance to binding AI transparency and governance requirements. In the EU, the AI Act (Regulation (EU) 2024/1689) entered into force on August 1, 2024, and includes explicit transparency obligations for systems that interact directly with natural persons, including chatbots, under Article 50. The Act also sets enforcement stakes, including significant administrative fines, which increases pressure for vendors to build disclosure, human oversight, and audit-ready controls into chatbot platforms used in customer support, HR, and public-sector interfaces.
Regulatory approaches remain uneven across major markets, increasing compliance design and operating complexity for global rollouts. In the United States, a December 2025 Executive Order directs the development of a uniform federal AI policy framework intended to reduce fragmentation across state-level requirements. In the United Kingdom, Ofcom guidance published in December 2025 clarifies that AI chatbots on user-to-user and search services must align with the Online Safety Act, reinforcing the need for content safety, user transparency, and governance workflows within conversational AI deployments.
Value Chain Analysis
The chatbot value chain spans (1) compute and hosting (cloud infrastructure and accelerated hardware), (2) development toolchains (frameworks, orchestration, and observability), (3) data and knowledge assets (enterprise content, curated datasets, and governance artifacts), (4) foundation and fine-tuned models (LLMs, speech models, and domain agents), and (5) application delivery (web, mobile, contact center, and messaging channels), with integration and managed services layered throughout. Production deployments increasingly use modular, microservices-based architectures so teams can scale the NLU/LLM layer, API and integration services, and data stores independently. Retrieval-augmented generation patterns also depend on vector databases to ground responses in enterprise knowledge.
Downstream distribution and monetization are shaped by ecosystems that already own customer conversations, particularly messaging platforms and telecom operators, alongside CRM and contact-center stacks. In 2026, telco-led partnerships highlighted how the application layer is bundling agentic customer care with operator channels and service operations, including SoftBank partnering with Sierra in Japan and Yes (YTL Communications) working with YTL AI Labs to provide consumer access to an AI service. This shift raises demand for integration partners, secure data pipelines, and governance tooling, while supplier leverage concentrates around model providers, cloud platforms, and specialized speech and agentic AI vendors that can meet latency, privacy, and localization requirements at scale.
Competitive Landscape
The Chatbot market remains moderately fragmented yet shows rising concentration as incumbents and disruptors vie for scale. LivePerson leverages partnerships with Google Cloud and Avaya to deliver enterprise-grade engagement hubs, while Yellow.ai secures USD 75 million funding to refine its multi-LLM architecture. [4]LeadsOnTrees News Desk, “Yellow.ai Secures $75 Million in Funding to Revolutionize Customer Conversations Worldwide,” leadsontrees.com Kore.ai attracted USD 150 million with Nvidia backing to accelerate domain-specific autonomous agents. CX outsourcers embed proprietary bots into managed-service contracts, tightening platform-service synergies.
Competitive differentiation centers on model transparency, domain tuning, and integration breadth instead of baseline chatbot capability. Providers embed explainable AI dashboards and red-team testing to address hallucination risk and satisfy regulators. Strategic M&A targets include knowledge-base curation startups and low-code orchestration tools that shrink deployment timelines. Vendors courting regulated industries highlight certified data centers, role-based access, and audit trails. As revenue shifts from license to consumption-based metrics, durable advantage will favor platforms that combine extensible APIs, robust governance, and ecosystem marketplaces.
Chatbot Industry Leaders
LivePerson, Inc.
Kore.ai, Inc.
Ada Support Inc.
Intercom, Inc.
Drift.com, Inc.
- *Disclaimer: Major Players sorted in no particular order
Chatbot Market Companies Covered in this Report
- LivePerson, Inc.
- Kore.ai, Inc.
- Ada Support Inc.
- Intercom, Inc.
- Drift.com, Inc.
- Yellow.ai Pvt. Ltd.
- Cognigy GmbH
- Freshworks Inc.
- Gupshup Technology India Pvt. Ltd.
- Boost.ai AS
- Rasa Technologies GmbH
- SnatchBot SA
- Tidio Poland Sp. z o.o.
- Chatfuel, Inc.
- Aivo Technologies, Inc.
- Inbenta Holdings, Inc.
- Senseforth.ai Labs Pvt. Ltd.
- BotsCrew, Inc.
- Quiq, Inc.
- LiveChat Software S.A.
- Zendesk, Inc.
- Artificial Solutions International AB

Market Opportunities and Future Outlook
A clear whitespace area is the expansion from text-first bots to real-time, voice-centric and multimodal assistants that can sit inside high-volume service environments such as telecom, travel, retail, and healthcare. Product moves in mid-2026 indicate a faster path for enterprises to deliver more natural conversational experiences, including OpenAI releasing full-duplex voice models designed for simultaneous speaking and listening. These capabilities link directly to contact-center automation and mobile-first markets where voice remains the dominant interaction mode, while also increasing platform differentiation around speech quality, latency, and safe real-time behavior.
Another opportunity is demand for enterprise-grade governance, sovereignty, and data-retention controls as regulators tighten transparency obligations for human-facing AI interactions. The EU AI Act framework and related guidance around the definition of an AI system and transparency expectations are driving purchases of built-in disclosures, audit trails, and human oversight, alongside deployment patterns that support residency and controlled retention. In 2026, commercial activity also shows deeper operational embedding beyond standalone chat widgets, such as Deutsche Telekom scaling a partnership with OpenAI into production use across internal tools and live voice calls, which points to enterprise appetite for integrated agent workflows connected to core systems, knowledge bases, and operational processes rather than isolated Q&A experiences.
Recent Industry Developments in Chatbot Market
- July 2026: Kore.ai partnered with Atos to deliver sovereign agentic AI solutions for UK enterprises. The collaboration targets regulated and large organizations that need tighter control over where data and models operate, aligning agent deployments with governance and compliance requirements. It also expands enterprise go-to-market reach through a major IT services partner that can bundle integration and managed services.
- May 2026: Kore.ai launched the Artemis edition of the Kore.ai Agent Platform, initially available on Microsoft Azure. The release emphasized building, governing, and optimizing enterprise AI agents, reflecting a shift from basic chatbots to managed, lifecycle-based agent platforms. Azure availability also strengthens alignment with cloud procurement and security controls common in large enterprises.
- December 2024: Yellow.ai raised USD 75 million to scale generative AI customer-service automation across additional geographies. The funding supported product expansion and capacity to serve more enterprise conversation volume with multi-LLM orchestration and verticalized deployments. It also intensified competitive pressure on platform vendors to pair core tooling with implementation and ongoing governance services.


Chatbot Market Report Scope and Research Methodology
Market Definition and Coverage
For this methodology, the chatbot market is counted as the global revenue earned from chatbot software platforms and related services that enable automated, conversational interactions through text or voice across digital channels.
Scope exclusions: We exclude general call center labor, generic CRM licenses that do not include chatbot functionality, and one-off internal prototypes that are not monetized as a product or service.
Segments Covered in This Report
- By Component
- Platform/Software
- Services
- By Application
- Customer Support
- Sales and Marketing
- HR and Recruiting
- IT Service Management
- Others
- By Deployment Mode
- Cloud
- On-premise
- By Organization Size
- Small and Medium Enterprises (SMEs)
- Large Enterprises
- By End-user Industry
- Retail and eCommerce
- BFSI
- Healthcare
- Travel and Hospitality
- Telecom and IT
- Government and Public Sector
- Other End-user Industries
- By Geography
- North America
- United States
- Canada
- Mexico
- South America
- Brazil
- Argentina
- Chile
- Rest of South America
- Europe
- Germany
- United Kingdom
- France
- Italy
- Spain
- Rest of Europe
- Asia-Pacific
- China
- India
- Japan
- South Korea
- Malaysia
- Singapore
- Australia
- Rest of Asia-Pacific
- Middle East and Africa
- Middle East
- United Arab Emirates
- Saudi Arabia
- Turkey
- Rest of Middle East
- Africa
- South Africa
- Nigeria
- Rest of Africa
- Middle East
- North America
Data Sources, Market Sizing, and Validation
Desk Research
Desk research starts with building the basic fact base on digital adoption, customer contact volumes, and enterprise software spending so the model has a realistic demand pool. We rely on public sources such as the International Telecommunication Union (internet and mobile usage), World Bank macro indicators, OECD digital economy statistics, and US Census Bureau and Eurostat services data for context on business activity.
To keep the model grounded in the technology side, we also review sources such as USPTO and WIPO patent publications, peer reviewed AI and NLP papers, and government or regulator releases on data privacy and AI governance that affect deployments. This is then complemented with company annual reports, earnings call transcripts, investor presentations, and reputable press coverage to map pricing logic and product packaging. Where needed, paid database subscriptions are used for company financials and intelligence, news and financials, and patent databases, mainly to reduce gaps for private companies and track deal and funding signals. These examples are not exhaustive, and many other public sources were reviewed for collection, cross-checking, and clarification.
Primary Interviews and Surveys
Primary work is used to test the revenue definitions, adoption timing, and pricing patterns that desk research often cannot confirm cleanly. We speak with product leaders, system integrators, customer experience owners, and procurement or operations managers across APAC, EMEA, and the Americas so assumptions can be adjusted to match how chatbots are actually purchased and deployed in different industries.
Distribution of primary research fieldwork respondents
| Company type | Respondent position | Region |
|---|---|---|
| Top tier: 31% | CXOs: 17% | APAC: 48% |
| Mid tier: 47% | Functional/Unit leaders: 40% | EMEA: 33% |
| Smaller Players: 22% | Managers: 43% | Americas: 19% |
Market-Sizing & Forecasting
Sizing is built using a top-down and bottom-up approach, starting with enterprise software and customer engagement spend, which is then reconstructed into a chatbot demand pool through adoption and penetration assumptions by region and end use. For credibility checks, we corroborate totals using selective bottom-up approximations like sampled vendor revenue ranges, channel checks with implementers, and sanity checks using average contract value times estimated active deployments, and then totals are adjusted if the two views do not reconcile.
Key model inputs include the installed base of digital customer touchpoints, contact center automation rates, cloud adoption levels for customer experience stacks, typical pricing models (subscription, usage based, and services attach rates), and the mix shift from rule-based bots toward AI driven conversational systems that changes average selling prices over time. Where public information is thin, gaps are handled by using ranges agreed during expert calls and applying conservative assumptions for smaller vendors, before being stress tested with sensitivity checks.
Forecasting is run through scenario analysis supported by light multivariate regression on drivers such as digital service usage, enterprise IT spending trends, and AI tooling adoption, and then the trajectory is reviewed with interview feedback to avoid over projecting short-term spikes. The final forecast keeps the year-to-year pattern realistic by checking that implied spend per deploying enterprise does not jump in a way that experts would not expect.
Data Validation & Update Cycle
Validation is done through multiple passes, where model outputs are compared against independent signals such as public company revenue commentary, reported contract sizes, regional enterprise software growth, and changes in AI regulation that can delay or accelerate rollouts. Outliers are investigated, and if a variance cannot be explained through scope or timing, assumptions are revisited and the relevant experts are re-contacted to confirm the direction.
Before sign-off, the dataset and calculations go through an analyst review step that checks currency conversions, year alignment, and logic consistency across segments and regions. Reports are refreshed annually, and interim updates are triggered when material events occur, such as major platform shifts, policy changes, or abrupt pricing moves. Right before delivery, a fresh pass is completed so clients receive the latest updated view rather than an older cut of the model.
Mordor Intelligence's Global Chatbot Market Sizing Compared With Other Published Estimates
Published chatbot market numbers can look far apart because teams do not count the same revenue streams, and they also anchor their models to different base years and price assumptions. Geography splits, services attachment, and the way free or bundled chatbot features are treated tend to be the biggest practical reasons behind the spread.
Some published figures fold a wider conversational stack into the chatbot total, or they start from a different time base that reflects earlier adoption. In the Mordor Intelligence estimate, the value is tied to vendor revenues from chatbot platform or software and related services, and it does not expand into adjacent contact center labor or generic software licenses unless chatbot functionality is explicitly monetized.
Benchmark comparison
| Source | Market Size | Gaps in Research Methodology |
|---|---|---|
| Mordor Intelligence | USD 11.45 B (2026) | |
| Industry Publisher A | USD 9.20 B (2024) | Uses a different base year and a broader segmentation lens that can pull in more offering types and channel integrations, which changes the effective pricing mix and timing versus a 2026 anchored model. |
| Research Firm B | USD 7.20 B (2024) | Provides limited clarity on what revenue streams are included, so totals may exclude services attach rates or certain deployment models, and currency timing and conversion assumptions are not fully transparent. |
The table indicates that year choice and scope clarity explain most of the gap, more than any single growth assumption. By keeping inclusions specific to monetized chatbot software and services, and by cross-checking pricing and deployment indicators before finalizing totals, the estimate stays traceable to inputs that can be reviewed and repeated.


Key Questions Answered in the Report
How fast is the Chatbot market projected to grow to 2031?
Revenue is forecast to rise from USD 11.45 billion in 2026 to USD 32.45 billion by 2031, reflecting a 23.15% CAGR.
Which region offers the quickest growth opportunity?
Asia-Pacific leads with a projected 24.71% CAGR, fueled by large user bases, mobile commerce adoption, and government AI programs.
Where do enterprises see the greatest cost savings?
Customer support automation delivers up to 92% cost reduction, saving USD 4.13 per interaction compared with human agents.
What deployment model do most organizations prefer?
Cloud deployments hold 77.85% share thanks to elastic scaling and managed security, though hybrid models are gaining in regulated sectors.
Which application is growing fastest beyond customer service?
HR and recruiting chatbots are expanding at 24.86% CAGR as firms automate candidate screening, onboarding, and policy inquiries.
How does regulation impact European adoption?
The EU AI Act imposes transparency and safety mandates; annual compliance costs near EUR 29,277 per AI system but also provide standardized governance that encourages responsible scaling.
Page last updated on:




