
Casino Hotels Market Size and Share
Market Overview
| Study Period | 2020 - 2031 |
|---|---|
| Market Size (2026) | USD 165.17 Billion |
| Market Size (2031) | USD 211.26 Billion |
| Growth Rate (2026 - 2031) | 5.05 % |
| Fastest Growing Market | Asia-Pacific |
| Largest Market | North America |
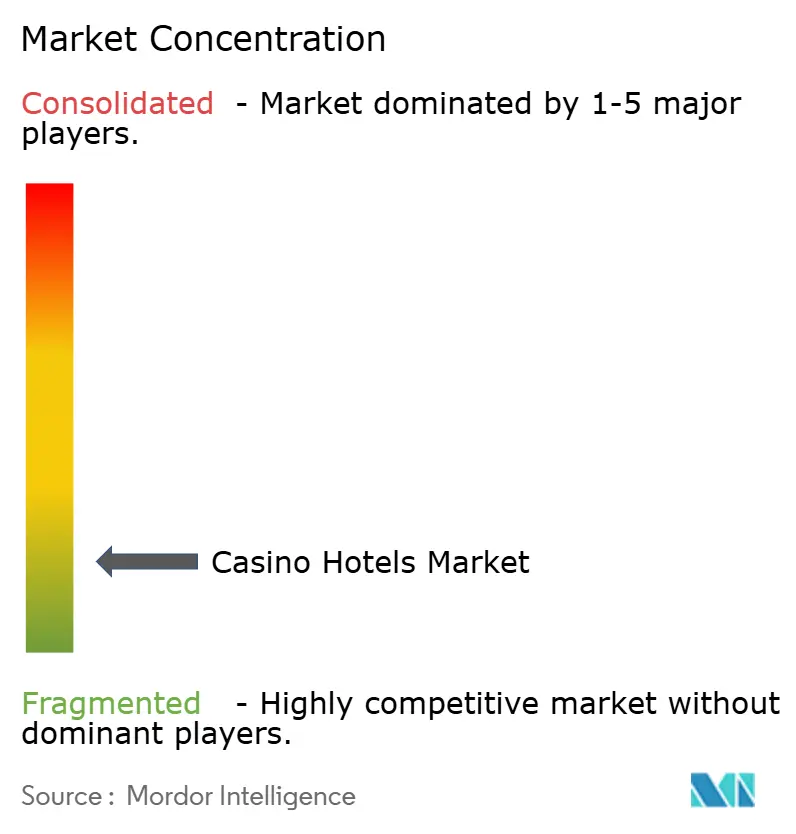
| Market Concentration | Low |
Major Players *Disclaimer: Major Players sorted in no particular order Image © Mordor Intelligence. Reuse requires attribution under CC BY 4.0. | |
Casino Hotels Market Analysis by Mordor Intelligence
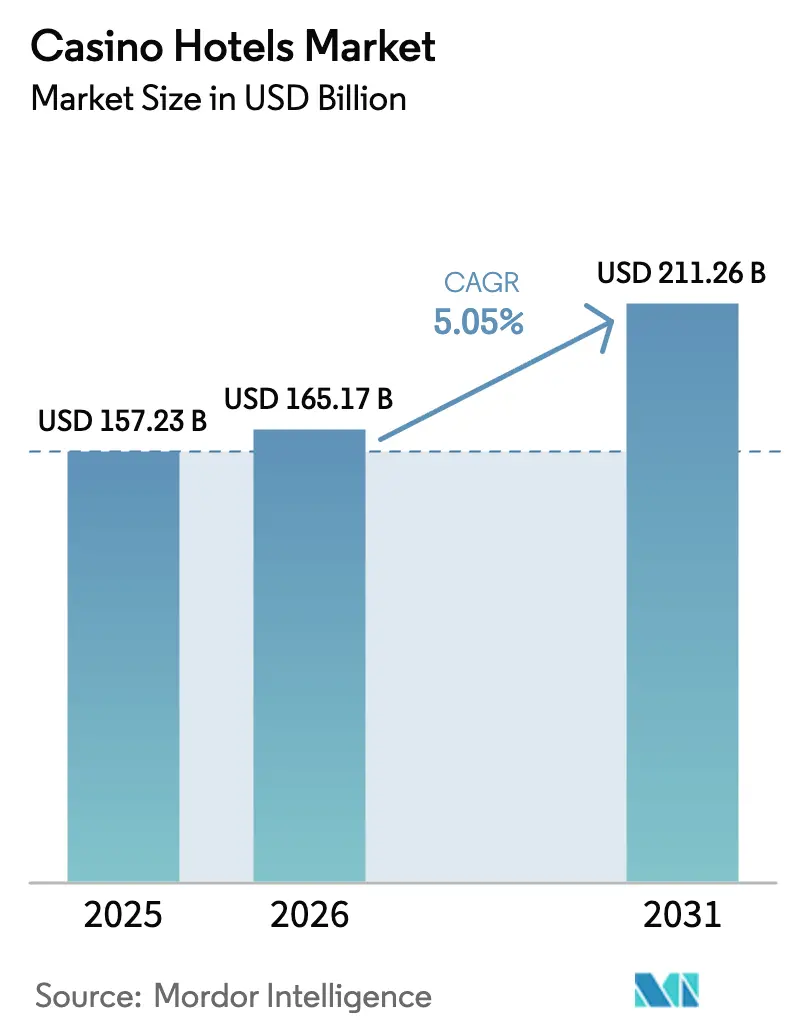
The casino hotels market size is expected to grow from USD 157.23 billion in 2025 to USD 165.17 billion in 2026 and is forecast to reach USD 211.26 billion by 2031 at 5.05% CAGR over 2026-2031. The casino hotels market benefits from pent-up leisure demand, destination marketing, and new regulatory openings. Operators are deploying asset-light digital capabilities, rolling out AI-driven pricing engines, and intensifying loyalty-program linkages to capture higher customer lifetime value. Integrated resort pipelines in the UAE, Greece, and Thailand highlight investors’ appetite for multi-use entertainment districts, while established hubs such as Las Vegas continue to surpass pre-pandemic gaming revenue records. Supply discipline, targeted renovation,s and disciplined cost controls support margin resilience, even as wage and utility costs rise in major markets.
Key Report Takeaways
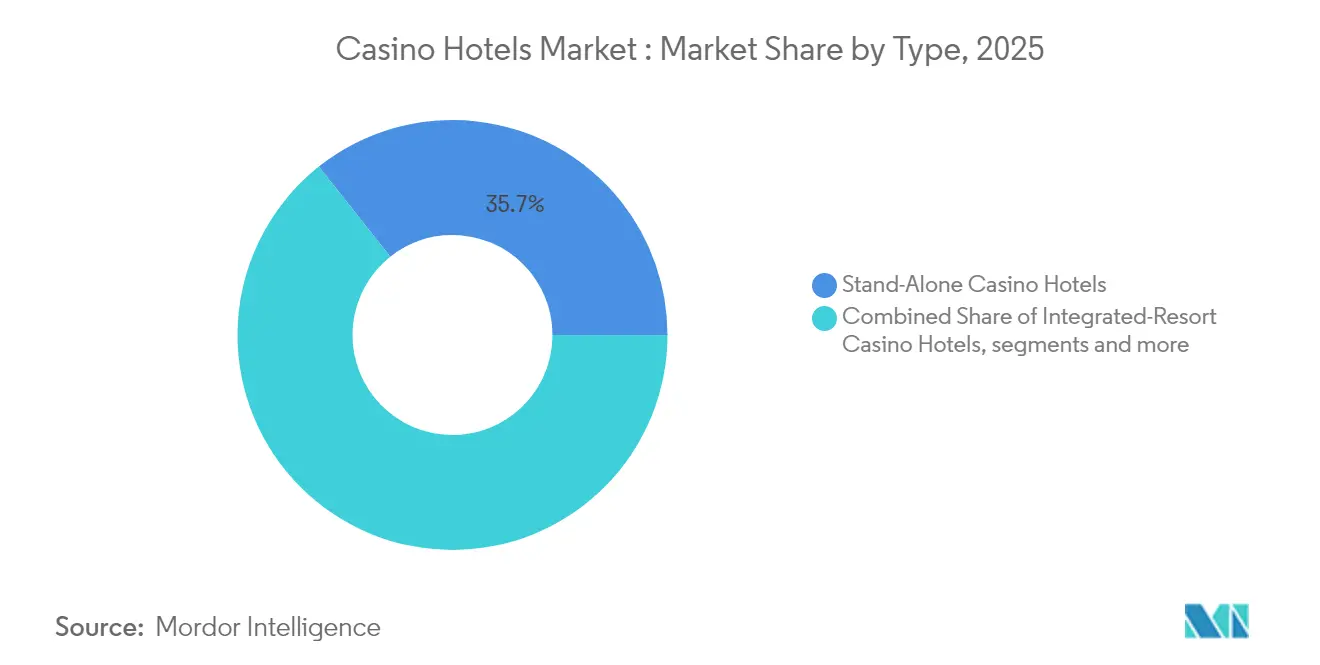
- By type, stand-alone properties led with 35.68% revenue in 2025, whereas integrated resorts are set to expand at 7.02% CAGR through 2031 in the casino hotels market.
- By revenue source, gaming held 46.25% of the casino hotels market share in 2025; non-gaming is growing at 8.28% CAGR to 2031.
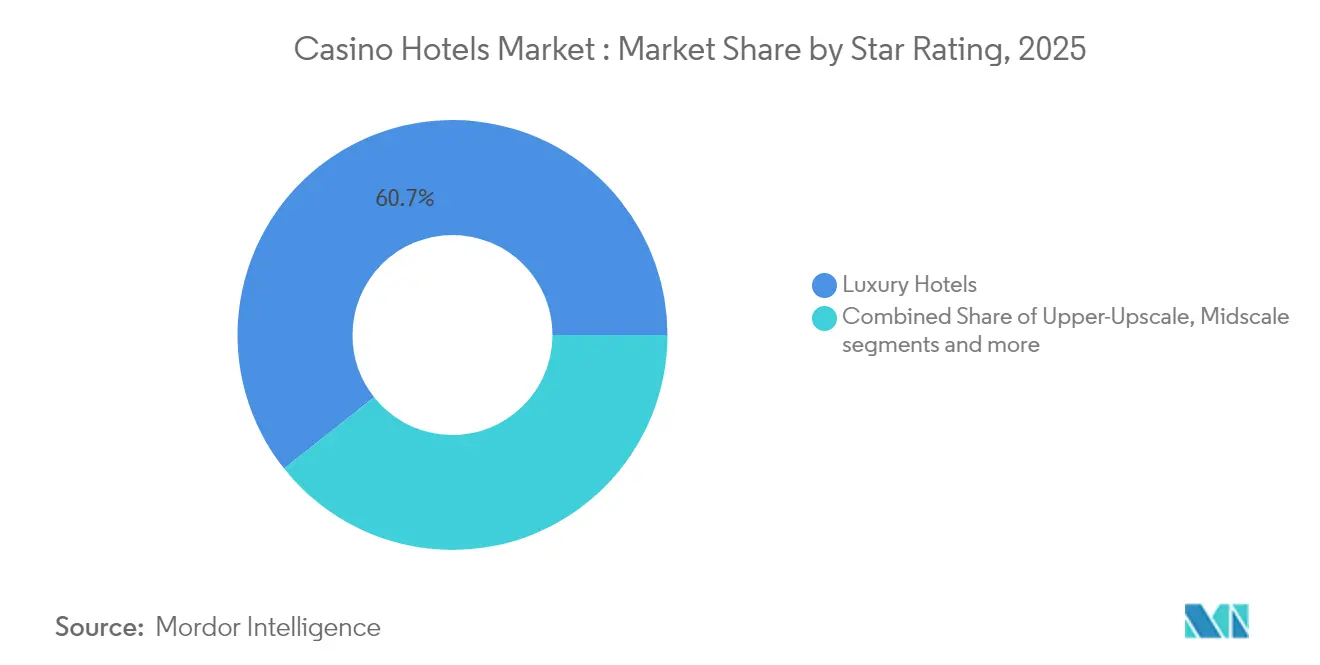
- By star rating, luxury hotels accounted for 60.67% of the casino hotels market size in 2025 and are advancing at 7.42% CAGR.
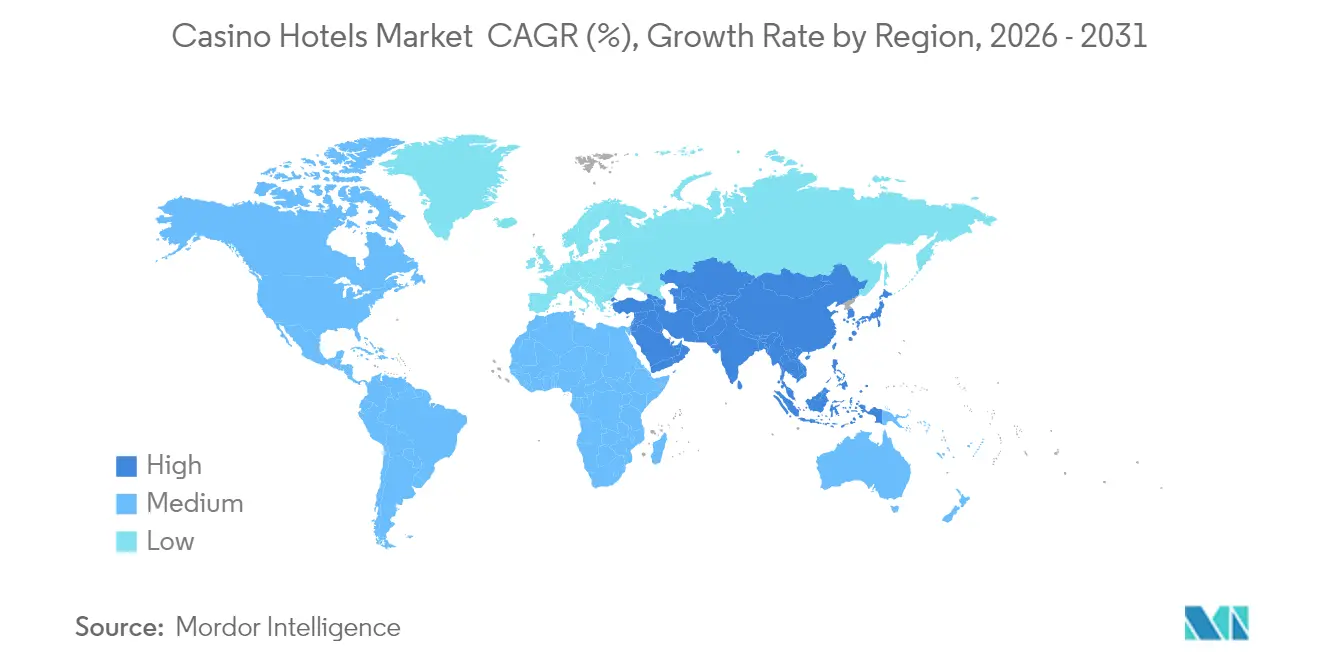
- By geography, North America commanded 42.10% revenue share in 2025, while Asia-Pacific is forecast to post the fastest 7.95% CAGR in the casino hotels market.
- Five leading operators, MGM Resorts, Las Vegas Sands, Caesars Entertainment, Wynn Resorts, and Galaxy Entertainment, collectively controlled a dominant position in 2024.
Note: Market size and forecast figures in this report are generated using Mordor Intelligence’s proprietary estimation framework, updated with the latest available data and insights as of 2026.
Market Trends and Insights
Drivers Impact Analysis of Casino Hotels Market *
| Driver | (~) % Impact on CAGR Forecast | Geographic Relevance | Impact Timeline |
|---|---|---|---|
| Rising legalization of casino gambling in emerging markets | +1.2% | Asia-Pacific, Latin America, Middle East | Medium term (2-4 years) |
| Recovery and growth in international tourism post-pandemic | +0.9% | Global, with concentration in Asia-Pacific and Europe | Short term (≤ 2 years) |
| Integrated resorts' diversified non-gaming revenue streams | +0.8% | Global, led by Asia-Pacific and North America | Long term (≥ 4 years) |
| Advanced data analytics & AI optimizing total-revenue management | +0.6% | North America, Europe, developed APAC markets | Medium term (2-4 years) |
| Growing demand for e-sports & experiential MICE at casino resorts | +0.4% | North America, Europe, urban Asia-Pacific | Long term (≥ 4 years) |
| Government-led destination mega-projects attracting investment | +0.7% | Middle East, Southeast Asia, selected Latin America | Long term (≥ 4 years) |
| Source: Mordor Intelligence | |||
Rising Legalization of Casino Gambling in Emerging Markets
Thailand’s draft Entertainment Complex Bill requires a minimum THB 100 billion (USD 2.8 billion) investment and proposes a 17% GGR tax, positioning the country to tap an estimated USD 5 billion annual gaming opportunity. Brazil implemented Law 14,790/2023 in January 2025, mandating BRL 30 million (USD 5.5 million) paid-in capital and a 12% GGR tax for licensees. The UAE is debuting the region’s first integrated resort, Wynn Al Marjan Island, forecast to secure at least USD 1.33 billion in annual gaming revenue. Such openings create white-space expansion paths for global operators seeking casino hotels market diversification.
Recovery and Growth in International Tourism Post-Pandemic
International visitor arrivals to Las Vegas climbed to 4.7 million in 2023, signaling a re-acceleration of cross-border demand. Singapore welcomed 13.6 million tourists who spent USD 27.2 billion, with its two integrated resorts contributing 1-2% of GDP. Macau recorded 34.9 million arrivals in 2024, lifting the average daily GGR to MOP 620 million. Variations in recovery by source market, such as Chinese visitation to Macau recovering to only 61% of 2019 levels in Q2 2024, are encouraging operators to widen their geographic marketing mix. Dynamic room pricing and targeted promotions are improving RevPAR while sustaining capacity utilization.
Integrated Resorts Diversified Non-Gaming Revenue Streams
Cornell Hospitality Quarterly notes that added retail, dining and entertainment facilities materially lift slot-machine volumes, though table-game volumes show marginal change. Macau concessionaires exhibit lower diversification than Las Vegas peers, yet each 1-point rise in non-gaming share typically enhances net profit margin by 0.3 points. Las Vegas Sands has committed USD 4.5 billion to non-gaming cultural attractions in Macao, while Marina Bay Sands is spending USD 1.75 billion on suite upgrades and new F&B venues. Revenue stability from non-gaming streams shields earnings from table-volume fluctuations.
Advanced Data Analytics & AI Optimizing Total-Revenue Management
Hotels adopting AI achieve accurate occupancy forecasts, predict utility use, and expedite personalized offers. Caesars Entertainment runs dynamic room-pricing algorithms that update every 15 minutes, while Wynn Las Vegas uses AI-driven in-room controls to moderate energy consumption. The 2023 Formula 1 Las Vegas Grand Prix delivered USD 1.3 billion in economic impact and allowed hotels to package premium race-viewing suites at more than USD 1 million. Predictive hospitality programs are boosting average guest satisfaction scores by 6-10 points.
Restraints Impact Analysis of Casino Hotels Market *
| Restraint | (~) % Impact on CAGR Forecast | Geographic Relevance | Impact Timeline |
|---|---|---|---|
| Stringent licensing regimes & political opposition to gambling | -0.8% | Global, particularly Europe and conservative jurisdictions | Long term (≥ 4 years) |
| Heightened social-responsibility & problem-gambling regulations | -0.5% | North America, Europe, developed Asia-Pacific | Medium term (2-4 years) |
| Younger generations' shift to online & mobile gaming | -0.6% | North America, Europe, developed Asia-Pacific | Medium term (2-4 years) |
| Rising climate & ESG risks for coastal casino-resort assets | -0.4% | Coastal regions globally, particularly Caribbean, Southeast Asia, US G | Long term (≥ 4 years) |
| Source: Mordor Intelligence | |||
Stringent Licensing Regimes & Political Opposition to Gambling
Germany’s Interstate Treaty on Gambling 2021 imposed a 5.3% tax on player stakes and local-data-hosting rules. The EU’s AML regulation, effective July 2027, will standardize enhanced due diligence obligations for casinos. Macau’s Law 7/2024 restricts junket promoters, and Law 20/2024 tightens penalties for unlicensed gaming[1]. The Czech Republic’s 2024 amendment raised the minimum capital to CZK 50 million (USD 2.2 million) and lifted the GGR tax to 30%. Heightened compliance costs discourage smaller operators and can slow green-field developments in highly regulated jurisdictions.
Younger Generations’ Shift to Online & Mobile Gaming
Generation Z prioritizes digital-first convenience, eco-awareness, and authentic local experiences. AR, VR, and 5G now support immersive mobile gaming, while blockchain ensures secure, friction-free transactions. Cloud gaming eliminates hardware barriers, and biometric check-in reduces queue times and improves security. Penn Entertainment’s emphasis on online sports betting contributed to nearly USD 1 billion in 2024 losses, prompting activist calls for strategic realignment. Casino hotels must integrate robust digital touchpoints while preserving the social atmosphere that distinguishes physical resorts.
*Our forecasts treat driver/restraint impacts as directional, not additive. The impact forecasts reflect baseline growth, mix effects, and variable interactions.
Casino Hotels Market Segment Analysis
By Type:
Integrated Resorts Drive Premium GrowthIntegrated-resort properties contributed 33.05% of 2025 revenue and are expanding at 7.02% CAGR, the fastest among all formats. The casino hotels market rewards their diversified income models, with F&B, retail, and entertainment often generating more than 55% of property EBITDA. Stand-alone casino hotels maintain a 35.68% leading slice of 2025 revenue due to lower capital hurdles and faster development timelines, making them attractive in mid-tier urban corridors and tribal jurisdictions.
Cruise and riverboat gaming remains niche but strategically important in heavily regulated land-based environments; mobility allows operators to redeploy tonnage to follow disposable-income trends. Jamaica welcomed its first casino at the 2,037-room Princess Grand Jamaica in 2025, highlighting the pathway for leisure islands to enter the casino hotels market. Tribal expansions such as Enterprise Rancheria’s USD 2-4 billion enlargement of Hard Rock Sacramento depict the sector’s confidence in regional drive-up demand.

By Revenue Source:
Non-Gaming Acceleration Reshapes Business ModelsGaming still delivered 46.25% of aggregate 2025 revenue, yet non-gaming streams are pacing an 8.28% CAGR through 2031. Each percentage-point rise in non-gaming contribution typically reduces earnings volatility and lengthens average stays. Rooms revenue has benefited from a record-high USD 193.16 ADR on the Las Vegas Strip in 2024. Chef-driven dining, theaters and branded retail improve cross-spend; the Formula 1 Las Vegas Grand Prix illustrated how large-scale events can add USD 1.3 billion of local economic value and raise RevPAR 25-40% during race week. Strategic alliances such as MGM Resorts’ tie-up with Marriott, generating 140,000 incremental bookings within months, signal the importance of partnership ecosystems.
By Star Rating:
Luxury Segment Commands Premium PositioningLuxury units captured 60.67% of revenue in 2025 and are charting a 7.42% CAGR to 2031, underscoring travelers’ willingness to pay for exclusive amenities. Luxury revPAR surpassed pre-pandemic peaks across Las Vegas and Macau portfolios in late 2024, aided by curated dining and wellness experiences. Upper-upscale complexes deliver balanced growth, bridging aspirational and midpoint consumer segments. Midscale and economy tiers face margin compression as they compete with short-term rentals and lifestyle hostels that resonate with younger travelers. Wynn Resorts’ planned USD 5 billion themed entertainment hub reinforces premiumization strategies.
By End-User:
International Travelers Drive Growth AccelerationDomestic leisure travelers accounted for 54.05% of 2025 check-ins, reflecting strong intra-regional tourism and drive-to demand during travel-restriction years. International leisure arrivals, however, are forecast to post an 7.78% CAGR, fueled by the reopening of long-haul flight corridors and rapid e-visa issuance in Southeast Asia. MGM Resorts recorded a 43% year-over-year surge in convention bookings in December 2024 as MICE demand rebounded. High-roller and VIP gamers, though smaller in volume, generate outsized EBITDA owing to premium-table minimums and bespoke services such as private jet charters.
Geography Analysis
North America Casino Hotels Market
North America retained 42.10% of 2025 revenue. The region’s casino hotels market size gains momentum from resilient domestic spending, tax-efficient tribal arrangements and a robust events calendar. Las Vegas reached USD 13.5 billion in 2024 GGR, anchoring its role as the global gaming epicenter. Urban revitalization projects in Chicago and New York promise incremental supply, and stringent bidding processes limit speculative entrants. ,
APAC and Middle East Casino Hotels Market
Asia-Pacific is the chief growth engine, forecasting an 7.95% CAGR through 2031, supported by Macau’s 9% EBITDA growth outlook and multi-billion-dollar developments across Japan, the Philippines, and Thailand. Wynn Al Marjan Island, slated for a 2027 debut, will set the blueprint for integrated resorts in the Middle East. Singapore’s integrated resorts contributed up to 2% of national GDP in 2024, demonstrating the fiscal upside of well-regulated environments.
Europe, South America and Africa Casino Hotels Market
Europe presents a bifurcated scene: legacy hubs such as Monaco and the UK grapple with tax hikes and safer-gaming mandates, whereas Greece’s EUR 1.5 billion Hellinikon project showcases Southern Europe’s tourism-led revival. Brazil’s legal market launch in 2025 marks a watershed for South America, with global brands lining up to access Latin America’s largest economy. Africa’s prospects remain nascent but Abu Dhabi-based sovereign funds are evaluating North African coastal resorts.
Regulatory Landscape
Casino hotels operate under layered gambling, hospitality, and financial-crime compliance regimes that shape market entry and operating economics. In the United States, state gaming regulators such as the Nevada Gaming Control Board and Nevada Gaming Commission set licensing, suitability, and internal-control requirements that extend beyond the casino floor. Co-licensing and background-check expectations can also apply to non-gaming hospitality functions housed within the same operating structure. In April 2026, Nevada adopted amendments to Regulations 5 and 25, reinforcing compliance accountability and tightening controls around independent agents, which raises governance and oversight expectations for multi-property operators.
AML/CFT obligations are tightening alongside gaming-specific controls, increasing the cost and complexity of operating large, cash-intensive resorts. FinCEN issued a Notice of Proposed Rulemaking on April 10, 2026, which would require casinos to designate a US-based responsible officer for AML/CFT compliance and to obtain board-level approval for AML/CFT programs, elevating board oversight and documentation standards. In Europe, the EU AML framework moving toward a July 2027 effective timeline adds another layer for multinational operators with cross-border customer flows. At the same time, individual jurisdictions such as Germany under its Interstate Treaty on Gambling 2021 maintain local restrictions, including data-hosting rules and taxes, that can influence property-level profitability and technology stack choices.
Value Chain Analysis
The casino hotel value chain combines high-frequency gaming operations with hotel rooms, food and beverage, retail, entertainment, and MICE, coordinated through centralized revenue management and procurement. Core activities cover customer acquisition and loyalty enrollment, player and guest onboarding, casino operations (table games, slots, cage, surveillance), hotel operations (rooms, housekeeping, facilities), and event programming that drives non-gaming spend. Support activities increasingly depend on digital infrastructure such as casino management systems (CMS) and player-tracking platforms that connect gaming and hospitality data to total revenue management, pricing, and personalized marketing.
On the supply side, integrated resorts use bulk procurement and multi-vendor contracting to secure economies of scale across consumables, premium ingredients for signature dining, and high-end goods for luxury retail boutiques. Logistics and sourcing are global for many resort inputs, while local vendors remain important for perishables, staffing services, and property maintenance. Regulatory compliance, including suitability oversight for certain third-party relationships and stricter controls over independent agents highlighted by Nevada's April 2026 updates, can affect vendor selection, contracting, and audit cadence across both gaming and non-gaming departments.
Competitive Landscape
The casino hotel market is moderately concentrated. The top five groups, MGM Resorts, Las Vegas Sands, Caesars Entertainment, Wynn Resorts, and Galaxy Entertainment, leveraged scale advantages in loyalty ecosystems, data analytics, and balance-sheet strength to safeguard share. MGM Resorts posted a record USD 17.2 billion in 2024 revenue, buoyed by 94% Strip occupancy[3]. Wynn Resorts secured USD 2.4 billion in financing for its UAE resort, the largest single hospitality financing in the Gulf.
M&A appetite is underscored by Bally’s USD 4.6 billion go-private transaction with Standard General and Boyd Gaming’s approach to Penn Entertainment. Asset-light REIT structures, typified by VICI Properties’ USD 300 million One Beverly Hills investment, illustrate investors’ preference for stable triple-net leases. Technology adoption is a competitive differentiator: Caesars’ dynamic pricing engine lifted blended ADR 6% in 2024, while Galaxy Entertainment integrated facial recognition boarding in its Cotai VIP entrances.
White-space opportunities in newly legal markets reward operators with proven regulatory-engagement track records. Thailand’s THB 100 billion capital bar will favor global giants over local newcomers. Brazil’s BRL 30 million capitalization rule is modest by international standards, potentially fostering a fragmented field ripe for roll-ups within five years.
Casino Hotels Industry Leaders
-
Las Vegas Sands Corporation
-
MGM Resorts International
-
Caesars Entertainment Corporation
-
Galaxy Entertainment Group
-
Wynn Resorts Limited
- *Disclaimer: Major Players sorted in no particular order
Casino Hotels Market Companies Covered in this Report
- MGM Resorts International
- Caesars Entertainment Corporation
- Las Vegas Sands Corporation
- Wynn Resorts Limited
- Melco Resorts & Entertainment
- Galaxy Entertainment Group
- Genting Berhad
- SJM Holdings Limited
- Hard Rock International
- Penn Entertainment Inc.
- Boyd Gaming Corporation
- Sun International Limited
- Crown Resorts Limited
- NagaCorp Ltd.
- Marina Bay Sands Pte. Ltd.
- Mohegan Gaming & Entertainment
- Foxwoods Resort Casino
- Resorts World Sentosa (Genting Singapore)
- Bally's Corporation
- NOVOMATIC AG
Market Opportunities and Future Outlook
New-build and reinvestment cycles in integrated resorts continue to create whitespace for suppliers and operators that can monetize non-gaming at scale. A clear proof point is Las Vegas Sands' development program in Singapore, where the company is advancing an ultra-luxury resort plan that includes a 15,000-seat arena and has been framed as an approximately USD 8 billion investment. Large arena and entertainment capacity expands the addressable mix for ticketed events, premium hospitality packages, and MICE spillover, supporting the market shift toward non-gaming revenue streams already gaining share.
Portfolio optimization and consolidation also create opportunities in asset repositioning, technology integration, and loyalty ecosystem expansion. The announced all-cash agreement for Fertitta Entertainment to acquire Caesars Entertainment (approximately USD 17.6 billion) points to continued platform-scale M&A, which typically triggers property-level capex prioritization, vendor re-tendering, and the rollout of unified guest data and pricing systems across acquired portfolios. As compliance requirements tighten, including FinCEN's April 2026 AML/CFT proposal and Nevada's April 2026 regulation updates, operators and technology vendors can differentiate through audit-ready workflows that link player tracking, payments, host management, and hotel operations while maintaining frictionless guest experiences.
Recent Industry Developments in Casino Hotels Market
- July 2026: Caesars Entertainment has received regulatory clearance for its acquisition by Fertitta Entertainment in an all-cash transaction valued at approximately $17.6 billion. The consolidation expands scale and enhances the destination footprint across major casino hotel clusters, enabling broader loyalty and capital allocation advantages. The move strengthens balance sheet flexibility and accelerates asset integration to capture cross-market synergies.
- July 2026: Boyd Gaming's Sam's Town Hotel and Casino Shreveport is being sold to Bally’s Corporation following approval by the Louisiana Gaming Control Board. The transaction accelerates portfolio consolidation in regional properties and expands Bally’s footprint in a strategic market. The deal enables Bally's to optimize its regional network and leverage integrated marketing and operating efficiencies.
- June 2026: PENN Entertainment opened a new $100 million, 203-room hotel tower at Hollywood Casino Columbus on June 12, 2026. The addition expands non-gaming amenities and increases gate value for destination travelers. The development enhances the property’s competitive appeal and supports incremental non-gaming revenue streams.
Casino Hotels Market Report Scope and Research Methodology
Market Definition and Coverage
For this study, the market covers the revenues generated by properties that combine paid lodging with on-site casino gaming, where the hotel and gaming operations are positioned together as one guest destination.
Scope exclusions: It does not count standalone casinos without lodging, cruise ship casinos, online gambling, or pure hotel stays where gaming is not offered on the same property.
Segments Covered in This Report
- By Type
- Integrated-Resort Casino Hotels
- Stand-Alone Casino Hotels
- Tribal Casino Hotels
- Cruise & Riverboat Casino Hotels
- By Revenue Source
- Gaming Revenue
- Non-Gaming Revenue
- Rooms
- Food & Beverage
- Entertainment & Retail
- By Star Rating
- Luxury
- Upper-Upscale
- Midscale
- Economy & Budget
- By End-User / Traveller Type
- Domestic Leisure Travellers
- International Leisure Travellers
- Business & MICE Travellers
- High-Roller / VIP Gamers
- By Geography
- North America
- Canada
- United States
- Mexico
- South America
- Brazil
- Peru
- Chile
- Argentina
- Rest of South America
- Asia-Pacific
- India
- China
- Japan
- Australia
- South Korea
- South East Asia (Singapore, Malaysia, Thailand, Indonesia, Vietnam, and Philippines)
- Rest of Asia-Pacific
- Europe
- United Kingdom
- Germany
- France
- Spain
- Italy
- BENELUX (Belgium, Netherlands, and Luxembourg)
- NORDICS (Denmark, Finland, Iceland, Norway, and Sweden)
- Rest of Europe
- Middle East and Africa
- United Arab Emirates
- Saudi Arabia
- South Africa
- Nigeria
- Rest of Middle East and Africa
- North America
Data Sources, Market Sizing, and Validation
Desk Research
Desk research was used to map the overall travel demand backdrop and to ground the model in repeatable public indicators. We leaned on official tourism and macro series, such as UN Tourism for international arrivals trends, the World Bank and IMF for GDP and inflation context, and national tourism boards for hotel demand signals in major gaming destinations.
It also helped to pin down market structure and operating realities through sources such as government or regulator gaming releases, statistical agencies, and central bank FX series, supported by company filings, investor presentations, and reputable business press. Where needed, paid subscriptions covering company financials, news and financials, and patent databases were used to speed up cross-checks and to avoid missing material events. The sources listed here are illustrative, and many other public datasets and documents were reviewed to collect, validate, and clarify inputs.
Primary Interviews and Surveys
Primary interviews and structured surveys were used to test what the desk data could not fully explain, especially around revenue mix between rooms, gaming, and non-gaming spend, and the pace of price and occupancy normalization after demand shocks. We spoke with a mix of operators, asset managers, distributors and partners, and local experts across key regions so that assumptions could be challenged and adjusted before the model was finalized.
Distribution of primary research fieldwork respondents
| Company type | Respondent position | Region |
|---|---|---|
| Top tier: 25% | CXOs: 17% | APAC: 37% |
| Mid tier: 56% | Functional/Unit leaders: 24% | EMEA: 36% |
| Smaller Players: 19% | Managers: 59% | Americas: 27% |
Market-Sizing & Forecasting
Sizing starts with a top-down build where travel and lodging demand indicators are reconstructed by geography, then filtered through casino hotel penetration in destination markets. We corroborate totals with selective bottom-up checks, such as sampled property revenue ranges, room inventory context, and simple ASP times volume logic for key revenue lines. Where the two views do not align, the model is rebalanced to keep the implied hotel and gaming economics consistent.
Inputs used in the model include international and domestic visitor volumes in major casino destinations, hotel occupancy and average daily rate direction, gaming revenue intensity relative to visitation, FX movement for USD conversion timing, and the ramp-up profile of newly opened or expanded integrated resort capacity. Forecasting uses scenario analysis supported by expert consensus, because new license awards, tourism cycles, and regulation changes can shift the growth path quickly. Where bottom-up visibility is limited in smaller markets, gaps are handled through proxy ratios tied to comparable destinations and then pressure-tested in interviews.
Data Validation & Update Cycle
Outputs are validated through multiple passes that look for breakpoints, unusual jumps, and region-level share shifts that do not match travel and gaming signals. We compare results against independent indicators like tourism arrivals trends, reported gaming market direction in key jurisdictions, and observable hotel pricing momentum. If large variances appear, the figures are reviewed again by another analyst.
When a major event occurs, such as a new resort opening, a material policy update, or an abrupt demand disruption, assumptions are revisited and relevant experts are re-contacted. Reports are refreshed annually, and interim updates are made when changes are significant. Before delivery, a final check is completed so clients get the most current view available at that time.
Mordor Intelligence's Global Casino Hotels Market Size Compared With Other Published Estimates
Published market sizes for casino hotels can look far apart because authors often count different revenue lines, different property types, and sometimes different parts of the travel and gaming value chain.
The main gap comes from whether non-hotel gaming formats are blended in. Mordor Intelligence counts only revenues tied to properties with on-site lodging and casino operations, and it keeps FX timing and the 2026 to 2031 CAGR window consistent during updates.
Benchmark comparison
| Source | Market Size | Gaps in Research Methodology |
|---|---|---|
| Mordor Intelligence | USD 165.17 B (2026) | |
| Trade Journal A | USD 306.80 B (2026) | Often tracks integrated resorts as a wider entertainment bundle, which can fold in broader resort real estate and adjacent non-lodging gaming exposure, thereby inflating the addressable total versus casino hotels only. |
| Regional Consultancy B | USD 21.90 B (2025) | Typically uses a narrower definition closer to gaming hotels in limited geographies and may undercount non-gaming hotel revenue streams (rooms, food and beverage, events) that materially lift property economics. |
The spread in the table is mostly explained by how wide the scope is drawn around property types and revenue streams, and by differences in timing, currency conversion, and update cadence. Using clearly defined inclusion rules and cross-checks that tie back to travel demand and casino destination activity helps keep the estimate practical to replicate and easier to defend in planning discussions.
Key Questions Answered in the Report
What is the current value of the casino hotels market?
The casino hotels market stood at USD 165.17 billion in 2026 and is projected to climb to USD 211.26 billion by 2031 at a 5.05% CAGR.
Which type of casino hotel is growing the fastest?
Integrated resorts are growing the quickest, advancing at 7.02% CAGR thanks to diversified non-gaming revenue streams and larger average spend per guest.
Which is the fastest growing region in Casino Hotels Market?
Asia-Pacific is estimated to grow at the highest CAGR over the forecast period (2026-2031).
Why is Asia-Pacific considered the main growth engine?
Asia-Pacific combines Macau’s rebound, new legal markets in Thailand and the UAE and rising middle-class incomes, resulting in an 7.95% regional CAGR forecast.
How important is non-gaming revenue for operators?
Non-gaming revenue is expanding at 8.28% CAGR; each incremental point in its share typically improves margins while reducing dependence on table-game volumes.
Which companies dominate the casino hotels market?
MGM Resorts, Las Vegas Sands, Caesars Entertainment, Wynn Resorts and Galaxy Entertainment collectively hold the largest share through scale, loyalty programs and global expansion.