
Budget Hotel Market Size and Share
Market Overview
| Study Period | 2022 - 2031 |
|---|---|
| Market Size (2026) | USD 212.54 Billion |
| Market Size (2031) | USD 297.55 Billion |
| Growth Rate (2026 - 2031) | 6.96 % |
| Fastest Growing Market | Asia-Pacific |
| Largest Market | Asia-Pacific |
| Market Concentration | Medium |
Major Players *Disclaimer: Major Players sorted in no particular order Image © Mordor Intelligence. Reuse requires attribution under CC BY 4.0. | |
Budget Hotel Market Analysis by Mordor Intelligence
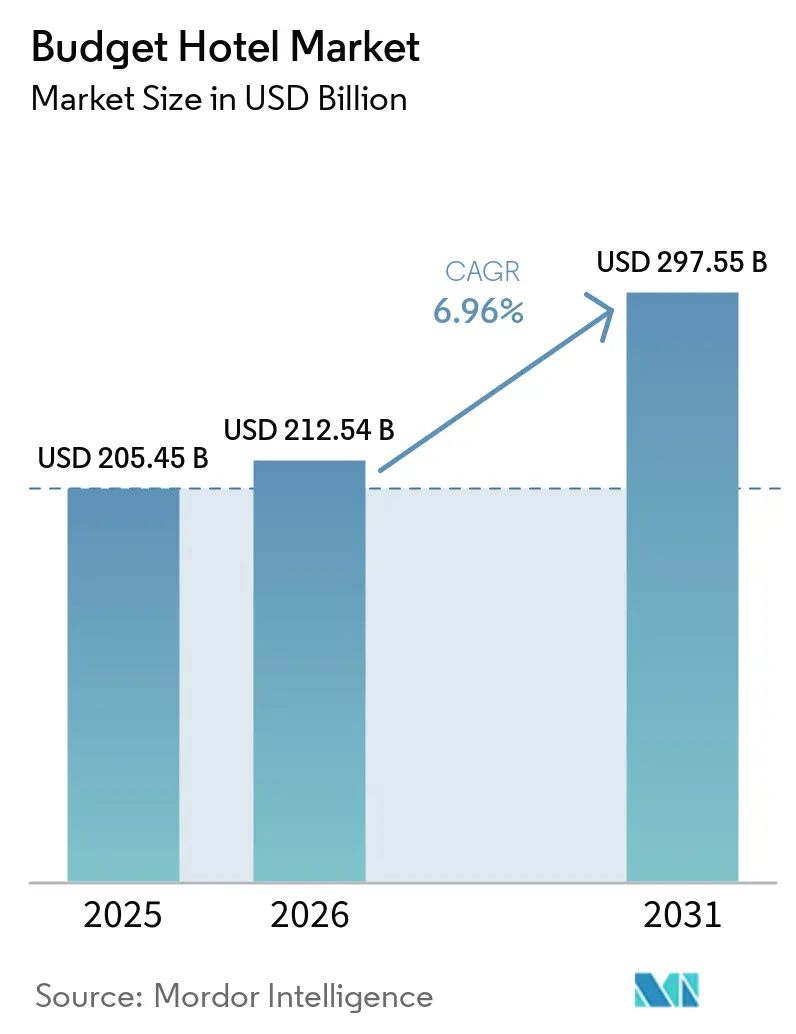
The Budget Hotel Market size was valued at USD 205.45 billion in 2025 and is estimated to grow from USD 212.54 billion in 2026 to reach USD 297.55 billion by 2031, at a CAGR of 6.96% during the forecast period (2026-2031).
A larger global consumer base, rising domestic and regional travel, and the steady expansion of branded low-cost accommodation formats support growth in the budget hotel market. The global middle class surpassed 4 billion people, widening the addressable pool for travel spending at value-led price points, which supports room demand in economy lodging formats. The budget hotel market is also benefiting from franchise-led expansion, which allows operators to scale with lower capital intensity and gives property owners access to reservation systems, standards, and brand visibility through established chains. At the same time, labor cost pressure and rising competition from alternative accommodations continue to shape profitability, underscoring the importance of scale, technology adoption, and a disciplined distribution strategy to performance across the budget hotel market.[1]
Key Report Takeaways
- By brand structure, chain-affiliated properties accounted for 58.62% of global revenue in 2025, and the segment is forecast to expand at a 7.59% CAGR through 2031.
- By property format, economy hotels accounted for 48.12% of the budget hotel market in 2025, while extended-stay budget hotels are projected to record the fastest CAGR of 8.45% through 2031.
- By primary application, leisure travelers accounted for 52.21% of revenue in 2025, while contract and long-stay guests are expected to grow at an 8.64% CAGR through 2031.
- By booking channel, online travel agencies captured 38.42% of revenue in 2025, while direct booking is projected to grow at a 9.57% CAGR through 2031.
- By geography, Asia-Pacific held 31.53% of the budget hotel market share in 2025, and the region is also expected to post the fastest CAGR at 9.14% through 2031.
Note: Market size and forecast figures in this report are generated using Mordor Intelligence’s proprietary estimation framework, updated with the latest available data and insights as of January 2026.
Global Budget Hotel Market Trends and Insights
Drivers Impact Analysis*
| Drivers | (~) % Impact on CAGR Forecast | Geographic Relevance | Impact Timeline |
|---|---|---|---|
| Rising Middle-Class Population and Democratization of Travel | +1.8% | Global, with the strongest effect in the Asia-Pacific and spillover to the Middle East, Africa, and South America | Medium term (2-4 years) |
| Expansion Of Digital Booking and OTA Visibility | +1.2% | Global | Short term (≤ 2 years) to medium term (2-4 years) |
| Inflation and Price Sensitivity | +1.0% | Global, with a stronger effect in North America and Europe | Short term (≤ 2 years) |
| Low-Cost Carrier Proliferation | +0.7% | Asia-Pacific, the Middle East and Africa, and Europe | Medium term (2-4 years) |
| Growth of Domestic Tourism and Staycations | +0.6% | Asia-Pacific, South America, and parts of Europe | Medium term (2-4 years) |
| Asset-Light Franchise Model Expansion | +0.5% | Global, led by advanced and organized hotel markets | Long term (≥ 4 years) |
| Source: Mordor Intelligence | |||
Rising Middle-Class Population and Democratization of Travel
The budget hotel market is gaining from the continued expansion of middle-income households, especially in travel-active emerging economies. The global consumer class crossed 4 billion people in 2025, and World Data Lab expects another 1 billion people to join by 2031, creating a larger base of first-time and price-conscious travelers. In the budget hotel market, this matters because many new travelers enter the formal lodging market through economy and budget options rather than full-service brands. Asia remains the main demand center in this pattern, and the region is expected to account for two-thirds of the global middle class by 2030, supporting sustained room demand in value-led lodging. The effect is especially relevant for branded operators that can reach first-time travelers in secondary cities before loyalty patterns are fully established.
Expansion of Digital Booking and OTA Visibility
Digital discovery remains a core demand enabler for the budget hotel market because smaller properties and low-cost brands depend heavily on broad online visibility. Online travel agencies already accounted for the largest share of global hotel booking value in 2024, and they remained an important source of room nights in 2026, supporting conversion for budget brands that lack large direct marketing budgets. In the budget hotel market, online travel agencies also reduce search friction for travelers by allowing them to compare room rates, locations, reviews, and cancellation terms in one place. That access is commercially useful for both chain-affiliated hotels and smaller operators, even though commissions remain a margin headwind. The result is that digital distribution expands demand reach, raises price transparency, and makes visibility a decisive operating factor across the budget hotel market.
Inflation And Price Sensitivity
The budget hotel market has also benefited from a wider trade-down effect in corporate and leisure travel since 2024. Higher travel costs encouraged both companies and households to place greater weight on nightly room rates, shifting demand toward economy and limited-service formats. This pattern was visible in franchise development activity, with Choice Hotels reporting a 13% year-on-year increase in U.S. economy transient franchise agreements in 2025. For the budget hotel market, this is not only a short-term occupancy gain, because lower travel budgets often reset procurement behavior and keep rate ceilings tighter even after broader inflation moderates. That creates a more durable demand base for operators that can deliver consistent service at lower effective price points.
Low-Cost Carrier Proliferation
Low-cost airline expansion continues to widen the catchment area for the budget hotel market by making short-haul and regional travel more frequent and more affordable. IATA projected global air travel demand to more than double by 2050, and Asia-Pacific was expected to record the fastest regional growth at a 3.8% CAGR, which supports long-run lodging demand in cost-sensitive formats. ACI World also forecasts global passenger traffic at 9.9 billion in 2025, up 4.8% year on year, indicating continued growth in travel volumes to major and secondary destinations. In the Middle East, low-cost carriers increased their seat capacity share from 13% in 2014 to 29% in 2024, underscoring the need for affordable accommodation as new air links create additional demand. In the budget hotel market, the practical outcome is stronger occupancy support around airports, transit corridors, secondary cities, and leisure routes, where travelers closely manage total trip costs.[2]
Restraints Impact Analysis*
| Restraints | (~) % Impact on CAGR Forecast | Geographic Relevance | Impact Timeline |
|---|---|---|---|
| Labor Shortages and Wage Inflation | -1.2% | North America and Europe | Short term (≤ 2 years) to medium term (2-4 years) |
| Rate Compression from Alternative Accommodations | -0.9% | North America and Europe, with spillover to leisure-driven Asia-Pacific markets | Medium term (2-4 years) to long term (≥ 4 years) |
| Infrastructure Constraints in Developing Regions | -0.7% | Asia-Pacific, the Middle East and Africa, and South America | Long term (≥ 4 years) |
| Supply Chain Tariffs and Utility Costs | -0.5% | Global, with higher exposure in North America | Short term (≤ 2 years) |
| Source: Mordor Intelligence | |||
Labor Shortages and Wage Inflation
Labor remains one of the clearest constraints on the budget hotel market because lower room rates leave less room to absorb higher staffing costs. In the United States, hotel cost per occupied room rose to USD 48.32 in 2025 from USD 42.82 in 2024, while Q4 2025 wage cost per occupied room increased 21.1% year on year. The American Hotel and Lodging Association also reported around 200,000 unfilled positions across 64,000 U.S. hotels in 2025, with annual turnover still at 70% to 80%. For the budget hotel market, this pressure is especially heavy because limited-service properties have fewer ancillary revenue streams to offset payroll inflation. The result is faster adoption of self-check-in, keyless entry, leaner housekeeping models, and scheduling tools that help large chains manage labor intensity more effectively than many stand-alone operators.
Rate Compression from Alternative Accommodations
Alternative accommodations continue to pressure the budget hotel market, especially in leisure-driven destinations and seasonal travel markets. The budget hotel market is vulnerable because leisure travelers account for 52.21% of revenue, and that is the same traveler group most exposed to apartment rental comparisons on trip-planning platforms. The original draft also noted that budget hotels can lose up to 15% in average daily rate in markets with dense short-term rental supply, which shows how price-led competition can reduce yield during periods that once supported margin recovery. As comparison tools place hotels and rentals side by side, operators must compete more directly on nightly price, review quality, and convenience of location.
*Our forecasts treat driver/restraint impacts as directional, not additive. The impact forecasts reflect baseline growth, mix effects, and variable interactions.
Segment Analysis
By Brand Structure: Chain Affiliation Drives Brand Economics and Owner Adoption
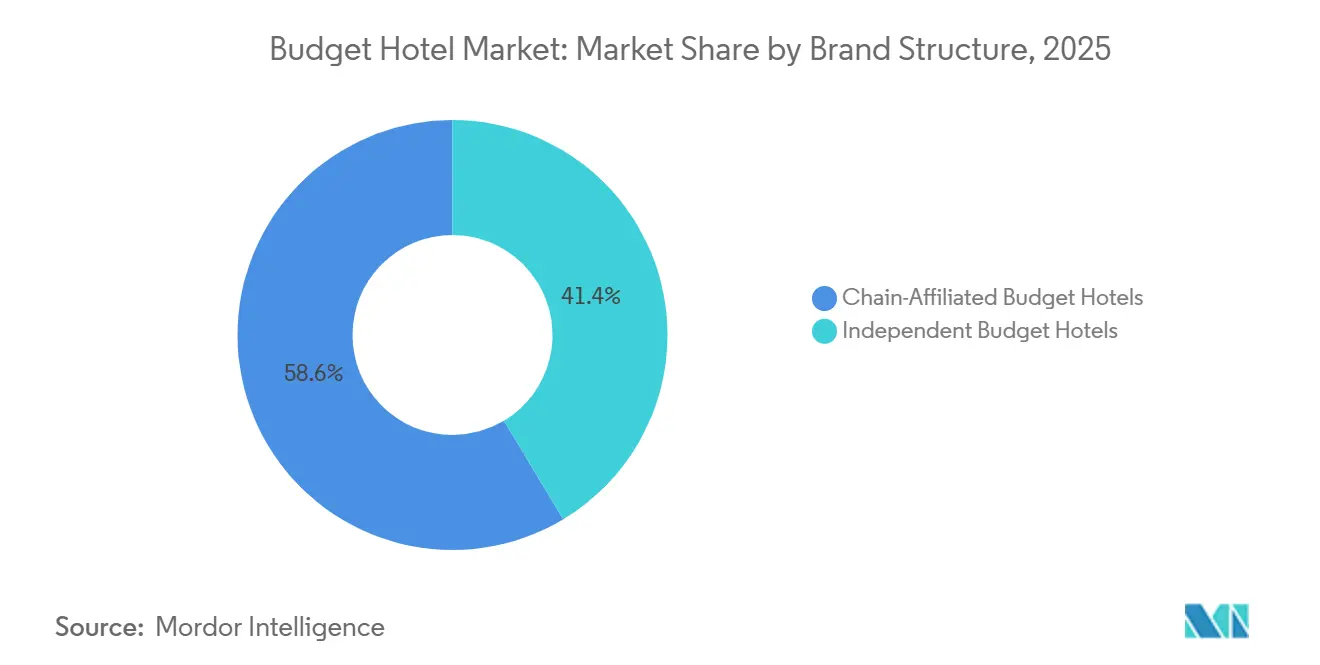
Chain-affiliated properties captured 58.62% of revenue in 2025, and this segment is projected to grow at a 7.59% CAGR through 2031. That lead shows how strongly the budget hotel market is moving toward standardized, organized formats that provide owners with greater visibility and a more repeatable operating model. Branded systems offer central reservation support, loyalty-linked demand, procurement benefits, and quality standards that help owners compete in a price-sensitive environment. These advantages matter more as digital booking becomes more concentrated and as travelers rely heavily on reviews, search ranking, and cancellation flexibility when selecting low-cost rooms. For many owners, affiliation is no longer just a growth choice; it is also a way to remain commercially relevant in the budget hotel market.
The same shift is evident in the operating model decisions of major hotel groups. Choice Hotels reported strong growth in franchise agreements in 2025, while Wyndham continued to expand through a large global pipeline that spans both established and emerging lodging markets. In this context, chain affiliation supports faster conversion of independent stock into branded rooms, which improves quality consistency and booking confidence. It also gives brands a way to grow in underpenetrated locations without taking direct ownership risk. Across the budget hotel market, that combination of owner economics and system support keeps chain affiliation ahead of the independent segment.

By Property Format: Economy Hotels Anchor the Market as Extended Stay Redefines Long-Term Value
Economy hotels accounted for 48.12% of revenue in 2025, confirming their position as the base format of the budget hotel market. These hotels remain the most scalable option for cost-sensitive travelers because they offer standard accommodations, broad geographic coverage, and lower nightly rates than full-service alternatives. The format is closely aligned with domestic leisure travel, short business trips, road travel, and urban demand from guests who prioritize value and convenience. It also fits the franchise model well, because room design, service delivery, and operating procedures are easier to standardize at scale. That explains why economy properties continue to form the broadest revenue pool within the budget hotel market.
At the same time, extended-stay budget hotels are forecast to grow at a 8.45% CAGR through 2031, making them the fastest-growing property format. This reflects demand from contract workers, long-duration business assignments, infrastructure project teams, and guests needing temporary housing for several weeks rather than several nights. Choice Hotels reported 30,600 extended stay rooms in the pipeline as of full-year 2025, and Wyndham has also continued to build its extended-stay platform through ECHO Suites Extended Stay by Wyndham. In the budget hotel market, this format stands out because it combines lower service intensity with longer average length of stay and more stable occupancy. It also widens the addressable demand base beyond short leisure trips, making the segment less dependent on high weekend seasonality.
By Primary Application: Leisure Demand Anchors Revenue As Long-Stay Guests Accelerate
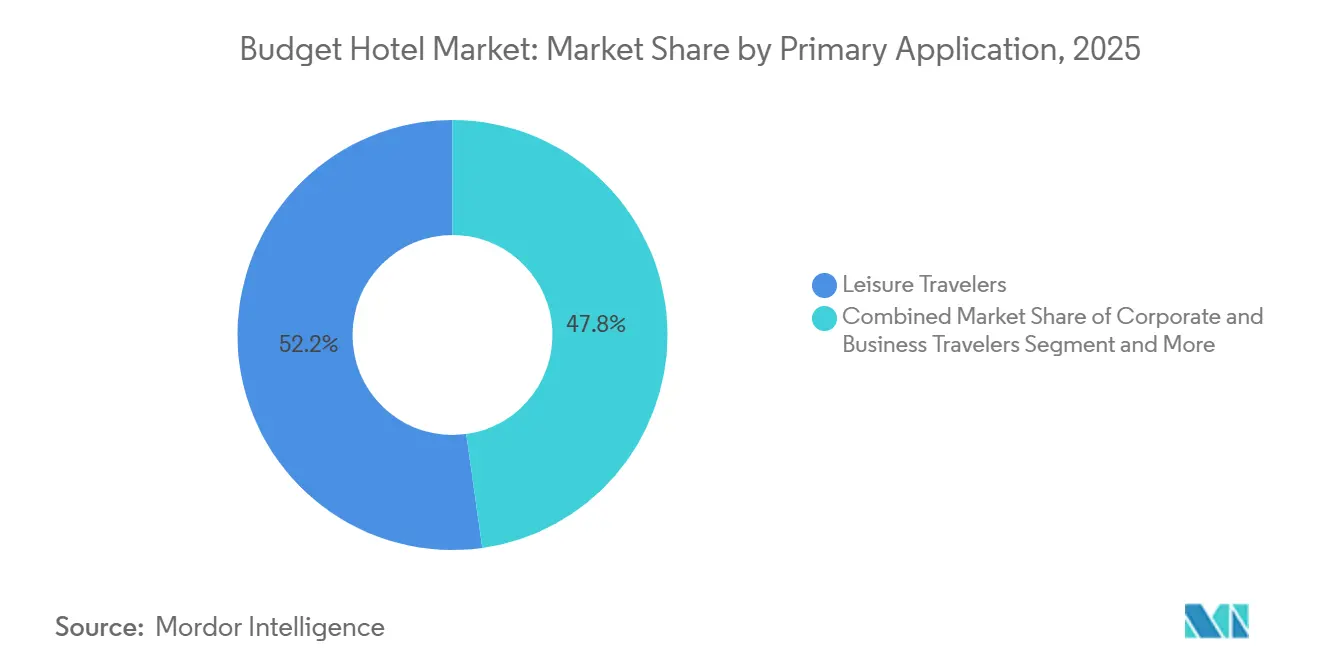
Leisure travelers accounted for 52.21% of revenue in 2025, which means the budget hotel market remains anchored by domestic and regional tourism. This demand base favors properties that are easy to book, competitively priced, and available across business districts, transport corridors, pilgrimage circuits, and city-edge leisure locations. The leisure segment also helps explain why online reviews, photo quality, and search ranking have become central to conversion in the budget hotel market. Demand is broad, frequent, and dispersed across destinations, which supports a large room network rather than concentration in a few premium urban centers. That makes leisure the most important stabilizer of occupancy for the budget hotel market.
Contract and long-stay guests are expected to grow at a 8.64% CAGR through 2031, making them the fastest-growing application segment. This reflects the increasing role of project-led mobility, temporary assignments, and semi-residential stays in shaping room demand across budget formats. The budget hotel market is well-positioned for this shift, as extended-stay and limited-service hotels can meet these needs at lower price points than midscale alternatives. As companies maintain closer control over accommodation budgets, lower-cost hotels are playing a larger role in workforce travel and project deployment. Over time, this should diversify demand beyond short discretionary trips and improve weekday occupancy for operators with the right room mix and location strategy.
By Booking Channel: OTAs Lead Distribution As Direct Booking Gains Ground
Online travel agencies captured 38.42% of booking channel revenue in 2025, giving them the largest share in the budget hotel market. This lead reflects the central role of comparison-led booking behavior, in which travelers sort options by price, ratings, and location within a single search flow. For low-cost accommodation, that model is especially powerful because purchase decisions are often fast, practical, and highly rate-sensitive. It also explains why the budget hotel market continues to depend on third-party platforms for customer acquisition, especially among independent properties and newer brands. In its current structure, OTAs remain the primary distribution channel for a large share of the budget hotel market.
Direct booking, however, is projected to expand at a 9.57% CAGR through 2031, which makes it the fastest-growing booking channel. Major chains are pushing this shift through loyalty programs, mobile apps, and proprietary technology that help them improve conversion while reducing commission leakage. Wyndham Rewards crossed 112 million enrolled members, and the company also expanded use of its Wyndham Connect platform across North America to support incremental direct revenue. In the budget hotel market, even a small increase in direct mix can materially improve margins because OTA commissions weigh more heavily on lower-rate room products. The result is a gradual but meaningful rebalancing in which brands aim to maintain OTA reach while strengthening their own customer relationships and repeat booking base.
Geography Analysis
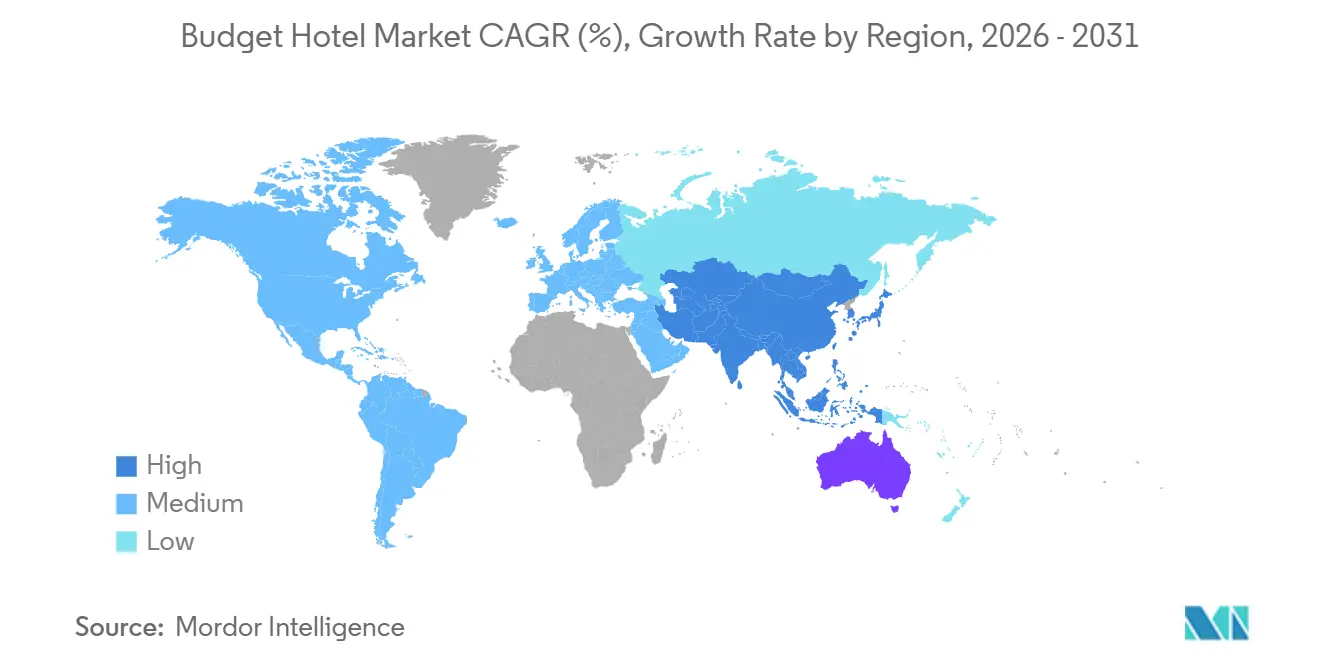
Asia-Pacific accounted for 31.53% of global revenue in 2025, and it is expected to expand at a 9.14% CAGR through 2031. This gives the region the largest contribution to future growth in the budget hotel market and also the widest spread of demand drivers. The region benefits from rising middle-class travel participation, dense domestic mobility, and a wide need for value-led accommodation in both urban and non-urban destinations. Japan also provided strong operating evidence in the original draft, indicating that lower-cost organized lodging remains highly relevant even in mature travel markets. For India, the regional picture is especially important because Asia-Pacific leadership supports continued investor attention to branded-economy expansion, franchise conversion, and supply creation in travel corridors that remain underserved by organized rooms.
North America remained the second-largest regional revenue segment in 2025, and the region continues to matter because of its large base of road travel, airport lodging, and extended-stay demand. The budget hotel market in the United States has strong brand penetration and a well-developed franchise ecosystem, which helps organized players scale quickly through conversions and standardized operating systems. Choice Hotels continued to expand its global and extended-stay pipeline. At the same time, Wyndham maintained one of the largest room development pipelines in the sector, and both moves support ongoing supply growth in the organized segment. Europe remains a stable but increasingly consolidated region for the budget hotel market, with established brands expanding through asset-light structures and targeted market entry. The region is less about rapid demand takeoff and more about system efficiency, brand consistency, and the conversion of fragmented supply into organized networks.
South America, the Middle East, and Africa remain smaller in absolute terms, but each region offers selective opportunities for the budget hotel market. In the Middle East, low-cost carriers expanded their seat capacity share from 13% to 29% between 2014 and 2024, supporting more affordable travel flows and creating additional demand corridors for economy lodging. In South America, the opportunity is more tied to conversion and brand rollout than to a fully mature, organized hotel base, which keeps the market open to franchisors with flexible operating models. Asia-Pacific still leads the budget hotel market share. Still, the next phase of global expansion is likely to include more cross-border growth into these emerging regional pockets where formal budget supply remains limited.[3]
Competitive Landscape
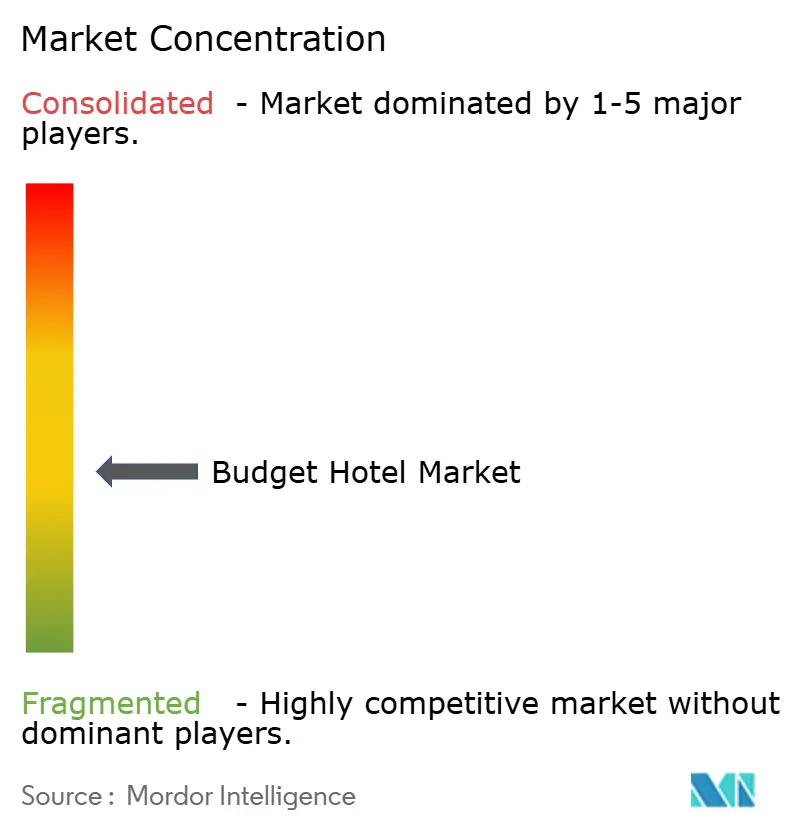
The competitive structure of the budget hotel market is split between fragmented property ownership and increasingly concentrated brand systems. Large groups hold an advantage in distribution, loyalty, procurement, and operating standards, while individual hotel ownership often remains dispersed across franchisees and local owners. This means competition in the budget hotel market is driven less by direct ownership concentration and more by the strength of reservation platforms, brand recognition, and conversion capability. Wyndham Hotels & Resorts, Choice Hotels, Accor, Jin Jiang, OYO, and other major players continue to shape the organized end of the category through room network scale and targeted brand expansion. In practical terms, the budget hotel market is becoming harder for many stand-alone operators to navigate without some form of brand, technology, or distribution support.
Strategic moves since 2024 show that scale expansion is centered on acquisitions, franchise rollout, and new operating formats. OYO completed the USD 525 million acquisition of G6 Hospitality, adding Motel 6 and Studio 6 to its portfolio and strengthening its presence in North America. IHG also completed the acquisition of Ruby in 2025, which strengthened its position in affordable urban lifestyle lodging and showed how operators are expanding their reach across the classic budget and midscale categories. Wyndham's official reporting indicates that the 80% occupancy milestone applies to its "most established locations" that have been open for six months or more. These examples show that the budget hotel market is not static, because product design, channel control, and brand architecture are evolving quickly.
Technology and conversion capability are becoming the main differentiators in the budget hotel market. Brands that can improve direct booking, integrate revenue tools, and maintain service consistency across a wide network are better positioned to defend margins under rate pressure. Wyndham Connect and loyalty-led direct booking efforts illustrate how brand systems are trying to reduce OTA dependence while preserving demand reach. Choice Hotels also continued entering new geographies through direct franchise agreements, which suggests organized operators still see meaningful white space in under-branded markets. Overall, the budget hotel market remains fragmented at the property level. Still, the competitive edge is shifting decisively toward scaled systems that combine brand standards, technology, and owner-friendly asset-light growth.
Budget Hotel Industry Leaders
-
Wyndham Hotels and Resorts, Inc.
-
Accor S.A.
-
Whitbread PLC
-
Choice Hotels International, Inc.
-
OYO Rooms (Oravel Stays)
- *Disclaimer: Major Players sorted in no particular order
Recent Industry Developments
- June 2026: Hilton launched the Spark by Hilton brand in India. The company aims to develop a pipeline of 150 Spark hotels across the country. This initiative is designed to address the surging demand for reliable, high-value, and standardized budget accommodation in India’s rapidly growing domestic travel market.
- April 2026: Wyndham Hotels & Resorts reported a record-high global development pipeline of over 259,000 rooms and 2,200-plus hotels as of Q1 2026, up 3% year on year, with international rooms growing 9% and direct-franchised rooms in the Asia Pacific region expanding 12%.
- February 2026: Choice Hotels International reported full-year 2025 results showing global franchise agreements growing 22% year on year and a record adjusted EBITDA of USD 625.6 million, up 3.6%. International net rooms grew 12.5% to nearly 160,000, while hotel openings increased 82% year on year.
- February 2025: IHG officially acquired the European "urban micro" lifestyle brand Ruby Hotels, adding it to its global portfolio as the 20th brand.
Global Budget Hotel Market Report Scope
| Chain-Affiliated Budget Hotels |
| Independent Budget Hotels |
| Economy Hotels |
| Limited-Service Hotels |
| Extended Stay Budget Hotels |
| Other Budget Hotel Types(Airport & Transit Budget Hotels,Capsule Hotels & Pod Hotels etc.) |
| Leisure Travelers |
| Corporate & Business Travelers |
| Contract & Long-Stay Guests |
| Transit/Layover Guests |
| Direct Booking |
| Online Travel Agencies (OTAs) |
| Travel Agencies & Tour Operators |
| Corporate & Institutional Booking |
| North America | Leisure Travelers |
| Business Travelers | |
| Backpackers & Solo Travelers | |
| South America | Family Travelers |
| Students & Youth Travelers | |
| By Geography | |
| Argentina | |
| Rest of South America | |
| Europe | United Kingdom |
| Germany | |
| France | |
| Spain | |
| Italy | |
| BENELUX (Belgium, Netherlands, and Luxembourg) | |
| NORDICS (Denmark, Finland, Iceland, Norway, and Sweden) | |
| Russia | |
| Rest of Europe | |
| Asia-Pacific | India |
| China | |
| Japan | |
| Australia | |
| South Korea | |
| South East Asia (Singapore, Malaysia, Thailand, Indonesia, Vietnam, and Philippines) | |
| Rest of Asia-Pacific | |
| Middle East and Africa | United Arab Emirates |
| Saudi Arabia | |
| South Africa | |
| Nigeria | |
| Rest of Middle East and Africa |
| By Brand Structure | Chain-Affiliated Budget Hotels | |
| Independent Budget Hotels | ||
| By Property Format | Economy Hotels | |
| Limited-Service Hotels | ||
| Extended Stay Budget Hotels | ||
| Other Budget Hotel Types(Airport & Transit Budget Hotels,Capsule Hotels & Pod Hotels etc.) | ||
| By Primary Application | Leisure Travelers | |
| Corporate & Business Travelers | ||
| Contract & Long-Stay Guests | ||
| Transit/Layover Guests | ||
| By Booking Channel | Direct Booking | |
| Online Travel Agencies (OTAs) | ||
| Travel Agencies & Tour Operators | ||
| Corporate & Institutional Booking | ||
| By Geography | North America | Leisure Travelers |
| Business Travelers | ||
| Backpackers & Solo Travelers | ||
| South America | Family Travelers | |
| Students & Youth Travelers | ||
| By Geography | ||
| Argentina | ||
| Rest of South America | ||
| Europe | United Kingdom | |
| Germany | ||
| France | ||
| Spain | ||
| Italy | ||
| BENELUX (Belgium, Netherlands, and Luxembourg) | ||
| NORDICS (Denmark, Finland, Iceland, Norway, and Sweden) | ||
| Russia | ||
| Rest of Europe | ||
| Asia-Pacific | India | |
| China | ||
| Japan | ||
| Australia | ||
| South Korea | ||
| South East Asia (Singapore, Malaysia, Thailand, Indonesia, Vietnam, and Philippines) | ||
| Rest of Asia-Pacific | ||
| Middle East and Africa | United Arab Emirates | |
| Saudi Arabia | ||
| South Africa | ||
| Nigeria | ||
| Rest of Middle East and Africa | ||
Key Questions Answered in the Report
What is the size of the global budget hotel space in 2026, and where is it headed by 2031?
The global budget hotel market stands at USD 212.54 billion in 2026 and is projected to reach USD 297.55 billion by 2031 at a 6.96% CAGR.
Which region leads global budget hotel demand?
Asia-Pacific led with 31.53% revenue share in 2025 and is also forecast to grow the fastest at a 9.14% CAGR through 2031.
Which property format is growing fastest in budget hotels?
Economy hotels remained the largest format with 48.12% share in 2025, while extended stay budget hotels are projected to grow the fastest at an 8.45% CAGR.
Why are chain-affiliated hotels outperforming independent operators?
Chain-affiliated properties held 58.62% of revenue in 2025 because brands provide stronger booking systems, loyalty access, operating standards, and procurement support.
How important are online travel agencies in hotel distribution?
OTAs captured 38.42% of booking channel revenue in 2025, which makes them the largest distribution channel, although direct booking is expected to grow faster at a 9.57% CAGR.
What are the main risks affecting profitability in this category?
Labor shortages, wage inflation, and rate pressure from alternative accommodations remain the main risks, especially for operators that rely on lower room rates and limited ancillary income.