5G Device Testing Equipment Market Size and Share
Market Overview
| Study Period | 2021 - 2031 |
|---|---|
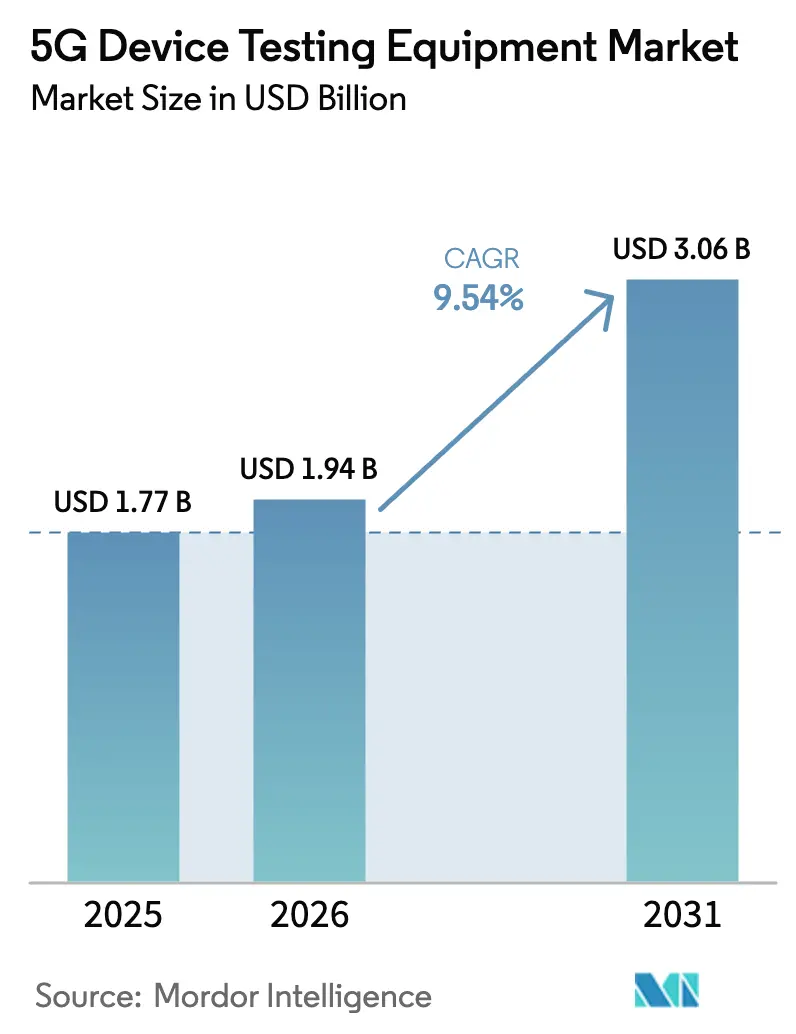
| Market Size (2026) | USD 1.94 Billion |
| Market Size (2031) | USD 3.06 Billion |
| Growth Rate (2026 - 2031) | 9.54% CAGR |
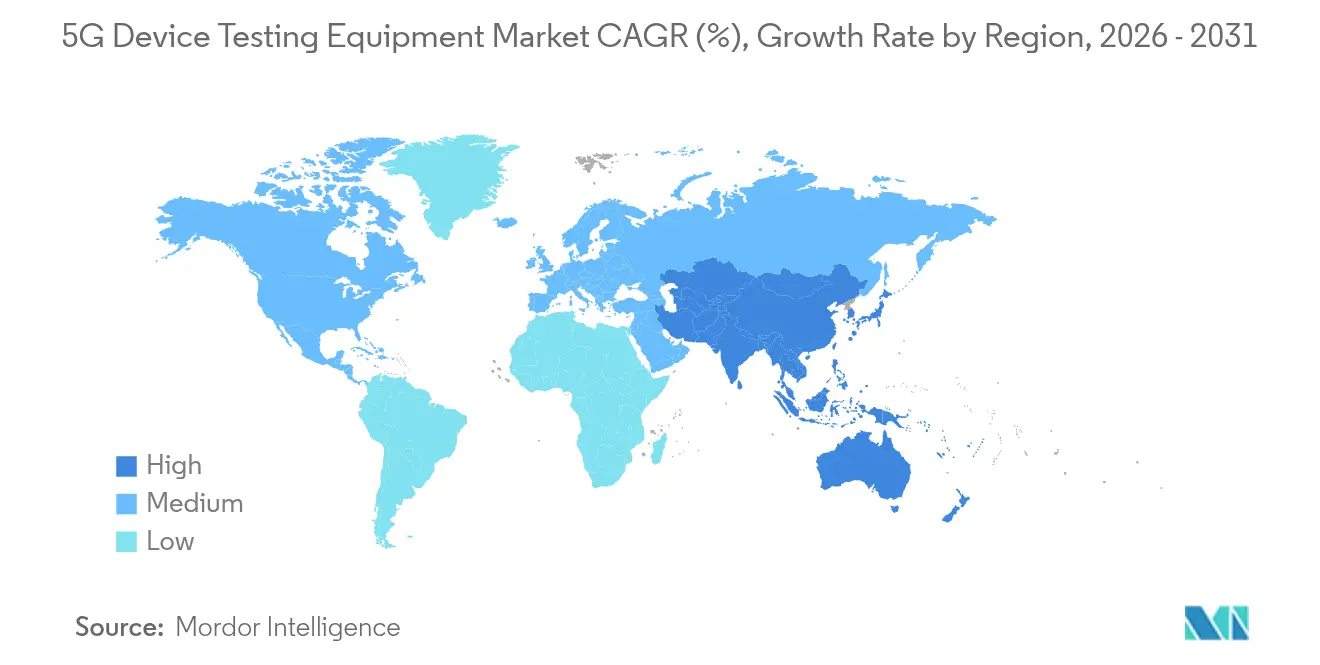
| Fastest Growing Market | Asia Pacific |
| Largest Market | North America |
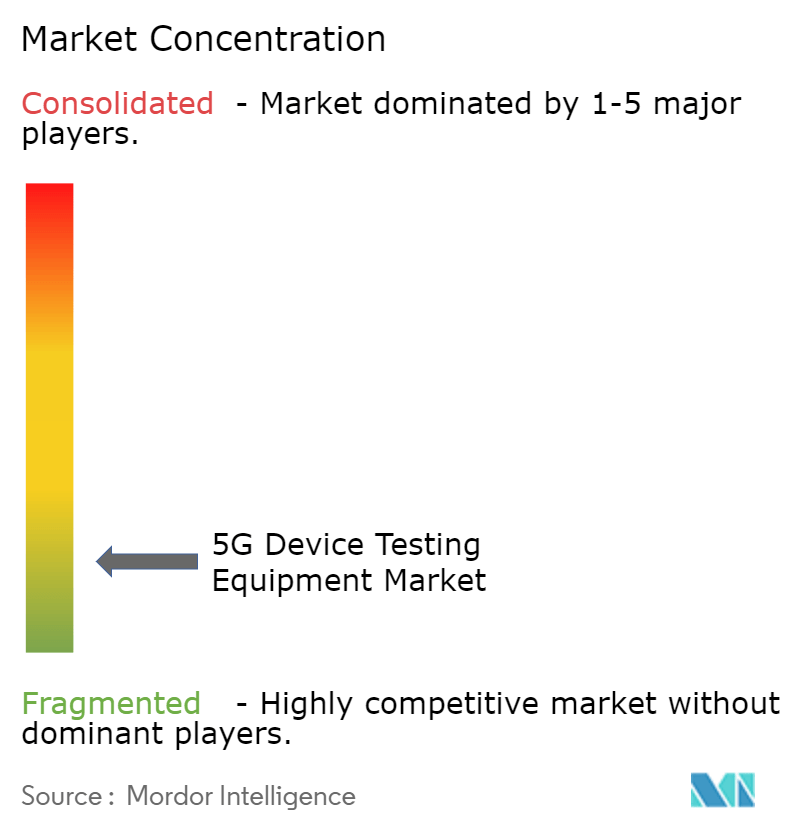
| Market Concentration | Medium |
Major Players *Disclaimer: Major Players sorted in no particular order Image © Mordor Intelligence. Reuse requires attribution under CC BY 4.0. | |
5G Device Testing Equipment Market Analysis by Mordor Intelligence
The 5G device testing equipment market size is expected to grow from USD 1.77 billion in 2025 to USD 1.94 billion in 2026 and is forecast to reach USD 3.06 billion by 2031 at 9.54% CAGR over 2026-2031.[1]Ericsson, “Ericsson Mobility Report 2024,” ericsson.com The upward trajectory mirrors the swift commercial rollout of standalone 5G networks, wider adoption of mmWave-enabled devices, and operators’ shift toward virtualized and open-architecture networks. Growing demand for over-the-air beamforming verification, satellite-to-device Non-Terrestrial Network (NTN) validation, and AI-assisted automation further expands the addressable base for the 5G device testing equipment market. Equipment makers focus on software-defined instrumentation and modular PXI systems to keep pace with evolving 3GPP releases, while operators invest in lab virtualization and cloud-native testbeds to streamline device and network certification. Persistent export-control rules on sub-THz equipment and a visible shortage of highly skilled RF engineers moderate the growth curve yet open avenues for shared labs and managed test services that offset capital barriers.
Key Report Takeaways
- By product type, oscilloscopes led with 27.35% revenue share in 2025, while RF channel emulators are forecast to expand at a 12.67% CAGR through 2031.
- By end user, telecom equipment manufacturers held 41.25% of the 5G device testing equipment market share in 2025; telecom service providers recorded the fastest projected CAGR at 11.22% to 2031.
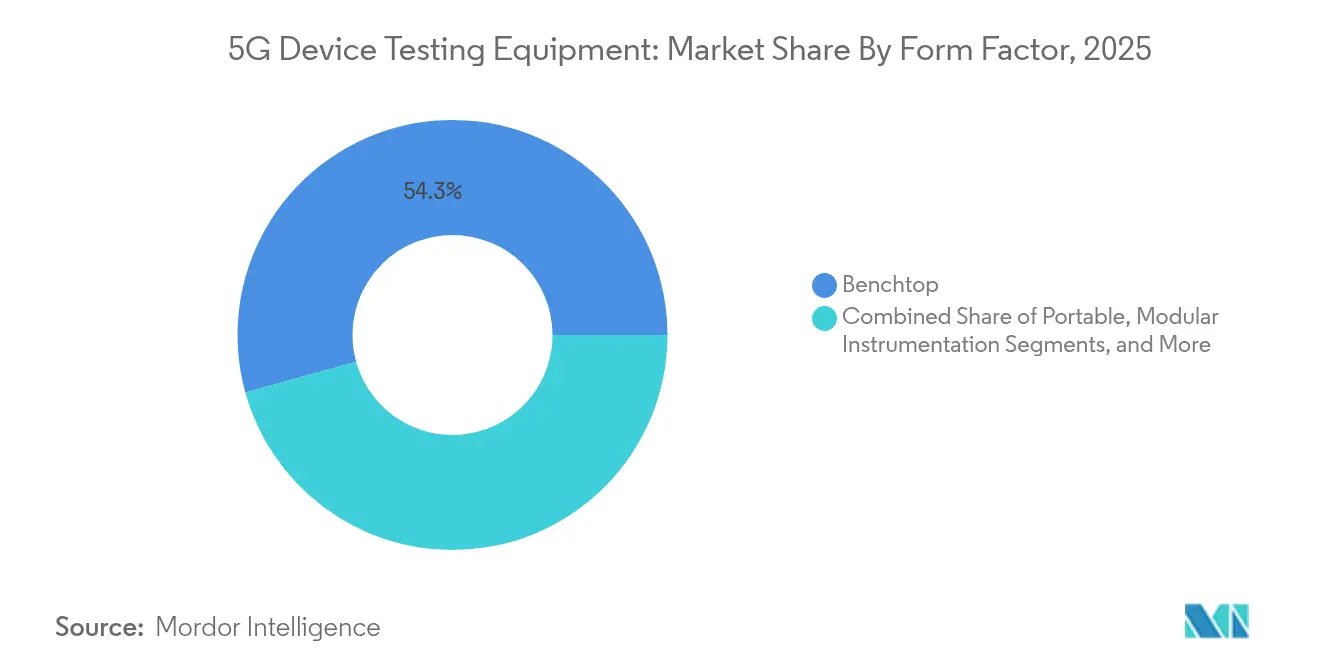
- By form factor, benchtop instruments accounted for 54.30% share of the 5G device testing equipment market size in 2025, whereas modular PXI systems grow at a 9.98% CAGR between 2026-2031.
- By frequency range, FR1 (<7 GHz) captured 45.60% market share in 2025, yet FR2 mmWave systems advance at a 15.18% CAGR toward 2031.
- By geography, North America commanded 34.55% revenue share in 2025, while Asia Pacific is projected to log a 12.94% CAGR through 2031.
Note: Market size and forecast figures in this report are generated using Mordor Intelligence’s proprietary estimation framework, updated with the latest available data and insights as of 2026.
Global 5G Device Testing Equipment Market Trends and Insights
Drivers Impact Analysis*
| Driver | (~) % Impact on CAGR Forecast | Geographic Relevance | Impact Timeline |
|---|---|---|---|
| Rapid deployment of 5G SA networks | +2.1% | Global with early gains in North America, China, Europe | Medium term (2-4 years) |
| Surge in FR2 (mmWave) handset launches | +1.8% | North America and APAC core, spill-over to Europe | Short term (≤ 2 years) |
| Operator shift toward virtual RAN drive-testing | +1.4% | Global concentrated in developed markets | Medium term (2-4 years) |
| AI-enabled self-optimising test platforms | +1.2% | North America and EU expanding to APAC | Long term (≥ 4 years) |
| Open-RAN conformance mandates | +0.9% | Global regulatory-driven adoption | Medium term (2-4 years) |
| Satellite-to-device 5G NTN test demand | +0.6% | Global with early use in maritime and remote areas | Long term (≥ 4 years) |
| Source: Mordor Intelligence | |||
Rapid Deployment of 5G SA Networks
Standalone architecture replaces the LTE anchor, prompting a deep overhaul of protocol, security, and edge compute validation. By 2024, more than 60 operators had live SA networks, and SA subscriptions reached 1.2 billion in 2025, with China and India accounting for a substantial share. Vendors roll out slicing-aware testers that emulate core functions, verify orchestration APIs, and expose vulnerabilities before commercial launch. Automated test case libraries and AI-assisted log analysis shorten regression cycles and reduce time to revenue in the 5G device testing equipment market.
Surge in FR2 (mmWave) Handset Launches
Premium smartphones supporting 24-52 GHz bands intensify the need for multi-port anechoic and reverberation chambers. Device makers must evaluate hundreds of beam indices across thermal stress points, compelling purchase of high-frequency OTA scanners that integrate channel emulation and automated beam steering.[2]Microwave Journal, “Beamforming Test Evolution for 5G mmWave,” microwavejournal.com Rising device counts funnel recurring demand to the 5G device testing equipment market as manufacturers chase time-to-market advantages.
Operator Shift Toward Virtual RAN Drive-Testing
Cloud-native RAN allows network functions on commercial off-the-shelf hardware, driving a pivot from hardware-centric field kits to software-defined analyzers that measure service-level KPIs and slice health in real time. Flexible licensing models let operators scale throughput testing on demand, reinforcing the relevance of the 5G device testing equipment market in virtualized rollouts.
AI-Enabled Self-Optimising Test Platforms
Machine learning parses terabytes of IQ data to predict failures and optimise channel sounding routines. Partnerships such as VIAVI and Northeastern University’s digital-twin initiative demonstrate city-scale automation that reduces manual scripts and elevates repeatability. AI capability becomes a de-facto differentiator for suppliers competing in the 5G device testing equipment market.
Restraints Impact Analysis*
| Restraint | (~) % Impact on CAGR Forecast | Geographic Relevance | Impact Timeline |
|---|---|---|---|
| High capex of multi-port mmWave rigs | -1.6% | Global, impacting smaller labs | Short term (≤ 2 years) |
| Short hardware life-cycles vs. ROI | -1.2% | Global in fast-evolving zones | Medium term (2-4 years) |
| Skills shortage in RF/OTA automation | -0.8% | North America and EU, expanding globally | Long term (≥ 4 years) |
| Export-control curbs on sub-THz gear | -0.5% | China and restricted markets | Medium term (2-4 years) |
| Source: Mordor Intelligence | |||
High Capex of Multi-Port mmWave Rigs
A single multi-port chamber for 28 GHz beamforming tests can exceed USD 500,000, challenging start-ups and regional labs.[3]VIAVI Solutions, “Lab-as-a-Service for Open RAN,” viavisolutions.comVendors counter with pay-per-use Lab-as-a-Service yet access remains limited for resource-constrained players, slowing diffusion of advanced FR2 validation within the 5G device testing equipment market.
Skills Shortage in RF/OTA Automation
The RF workforce gap widens as 7,500 unfilled positions appear in 2025 across defense, automotive radar, and 5G verticals. Limited talent delays scripted automation and increases test cycle costs, tempering growth prospects for the 5G device testing equipment market.
*Our forecasts treat driver/restraint impacts as directional, not additive. The impact forecasts reflect baseline growth, mix effects, and variable interactions.
Segment Analysis
By Type: Oscilloscopes Lead Amid Channel Emulator Acceleration
Oscilloscopes held 27.35% of the 5G device testing equipment market share in 2025 due to their high bandwidth and multichannel visibility into aggregated NR waveforms. Vendors embed protocol decode options, jitter analysis, and real-time eye diagrams that shorten debug loops for handset and infrastructure OEMs. Signal analyzers and vector generators complement scopes in production lines by delivering precise EVM and NPR metrics across sub-6 GHz and mmWave bands.
RF channel emulators, the fastest-growing subsegment at 12.67% CAGR, mirror real-world fading, Doppler, and MIMO conditions that replace extensive drive-tests. Their rise aligns with open RAN interoperability checks and evolving NTN scenarios that must model multi-spot-beam handovers. OTA and antenna chambers ride the same wave as FR2 launches multiply, cementing the 5G device testing equipment market as a critical enabler for upcoming 5G-Advanced features.


By End User: Equipment Makers Dominate as Operators Accelerate
Telecom equipment manufacturers accounted for 41.25% revenue in 2025, supplying baseband units, RF front ends, and gNodeBs that mandate exhaustive conformance and performance checks. Field upgrades to standalone architectures spark fresh demand for end-to-end slice testing, keeping this cohort central to the 5G device testing equipment market.
Telecom service providers expand investment at an 11.22% CAGR to validate new spectrum, network slicing, and edge compute alignment. Lab virtualisation, shared test repositories, and AI analytics allow operators to benchmark QoE across vendors, widening the opportunity base for the 5G device testing equipment market size going forward.
By Form Factor: Benchtop Stability Meets Modular Growth
Benchtop instruments retained 54.30% value in 2025 thanks to unmatched phase noise, dynamic range, and deep memory that production houses require. Integrated displays and turnkey firmware simplify workflows for less-automated tasks.
However modular PXI platforms grow at a 9.98% CAGR as they let users add slots, scale bandwidth, and deploy software updates that align with new 3GPP releases. Modular systems enable cloud orchestration of hundreds of channels, reinforcing their pull on the 5G device testing equipment market.
By Frequency Range: FR1 Pull with FR2 Surge
FR1 bands below 7 GHz delivered 45.60% of 2025 revenue, given legacy macro deployments and extensive IoT adoption. Mature calibration routines and abundant reusable LTE assets keep acquisition costs low.
In contrast FR2 mmWave testers log a 15.18% CAGR on the back of enhanced mobile broadband, fixed wireless access, and automotive radar convergence. Vendors introduce unified platforms that span 24-52 GHz for beam management and link budget analysis, driving incremental sales within the 5G device testing equipment market.
Geography Analysis
North America contributed 34.55% to 2025 revenue. Defense primes engage in secure 5G research, automotive OEMs deepen V2X trials, and chipset giants funnel capex toward AI-integrated analyzers. Keysight’s Communications Solutions Group booked USD 894 million in Q4 2024, underscoring the region’s scale. Regulatory clarity around CBRS, C-band, and 37 GHz mmWave bands furthers test demand for the 5G device testing equipment market.
Asia Pacific leads growth at a 12.94% CAGR as China Mobile earmarks CNY 3 billion for 5G-Advanced coverage across 300 cities while other carriers pledge similar budgets. Foundries like TSMC expand mmWave probe and package test lines, bolstering local orders for the 5G device testing equipment market. Japan, South Korea, and Taiwan deploy NTN labs and private 5G factories, amplifying demand for satellite uplink emulators and low-orbit handover testers.
Europe maintains steady momentum through spectrum harmonization and open RAN trials. Germany’s nationwide SA coverage drives operator spend on slice, edge, and private network validation. EU grants for digital innovation hubs co-fund mmWave chambers and AI analytics, safeguarding regional freshness in the 5G device testing equipment market. Policy shifts favoring vendor diversity open windows for non-incumbent suppliers to enter public tenders.

Competitive Landscape
The market remains moderately concentrated, with a handful of players controlling the bulk of revenue yet facing nimble challengers in the software and cloud domains. Keysight, Rohde & Schwarz, Anritsu, and VIAVI use comprehensive portfolios, global service footprints, and active participation in 3GPP workgroups to defend market share. Keysight’s acquisition of Synopsys’ Optical Solutions Group and ongoing integration of Spirent’s channel emulation assets show a shift toward design-through-verification workflows that lock in recurring revenue.
Rohde & Schwarz expands enterprise niches by joining Ericsson’s partner program for private network test kits. VIAVI pioneers cloud-hosted VALOR labs that lower entry barriers for open RAN conformance. Emerging firms add AI analytics overlays that integrate with legacy boxes, driving disaggregation in the 5G device testing equipment market. Patent races speed up, with Samsung filing for AI traffic scheduling and XR optimizations that imply future test requirements.[4]Patent Archive, “Samsung AI-Based Traffic Scheduling,” patent.nweon.com
Strategic focus centers on modularity, subscription licensing, and ecosystem alliances. Vendors partner with chamber makers, probe card suppliers, and digital twin platforms to offer turnkey solutions. The competitive arena therefore balances strong incumbents and software-centric entrants, ensuring healthy innovation cycles that benefit users across the 5G device testing equipment market.
5G Device Testing Equipment Industry Leaders
Keysight Technologies, Inc.
Rohde & Schwarz GmbH & Co. KG
Anritsu Corporation
Tektronix Inc.
National Instruments Corporation
- *Disclaimer: Major Players sorted in no particular order

Recent Industry Developments
- February 2025: Continental Resources expanded 5G mobile device testing capacity using Rohde & Schwarz CMX500 and CMW500 testers to meet high-volume production needs.
- February 2025: TSMC advanced Arizona fab plans involving USD 165 billion for three facilities, raising demand for 3nm and 2nm RF-front-end wafer test lines.
- January 2025: VIAVI and Rohde & Schwarz built an NTN testbed for SKY Perfect JSAT, integrating TM500-AS2 and CMX500 to validate LEO, MEO, GEO links.
- December 2024: Keysight secured EU nods for its USD 1.5 billion Spirent buy, pending China’s final clearance and the divestiture of high-speed Ethernet assets.


Research Methodology Framework and Report Scope
Market Definitions and Key Coverage
Our study defines the 5G device testing equipment market as the annual revenue earned from selling electronic instruments, oscilloscopes, signal and spectrum analyzers, vector signal generators, channel emulators, and network analyzers used to verify the performance, compliance, and safety of 5G-enabled end-devices such as smartphones, CPEs, modules, and IoT nodes.
Scope exclusion: instruments dedicated solely to network infrastructure field testing or legacy 2G/3G validation are not counted.
Segmentation Overview
- By Type
- Signal Analyzers
- Spectrum Analyzers
- Real-time Spectrum Analyzers
- Signal Generators
- Vector Signal Generators
- Arbitrary Waveform Generators
- Oscilloscopes
- Network Analyzers
- Vector Network Analyzers
- Protocol Analyzers
- Channel and Network Emulators
- RF Channel Emulators
- Network Simulators / Emulators
- Power and Thermal Test Equipment
- Power-Consumption Analyzers
- Thermal / Environmental Chambers
- OTA and Antenna Test Systems
- Anechoic / Reverberation Chambers
- Near-field Antenna Scanners
- Other Types
- Bit-Error-Rate Testers (BERTs)
- Compliance / Conformance Software
- Signal Analyzers
- By End User
- Telecom Equipment Manufacturers (RAN / Core OEMs)
- Integrated Device Manufacturers (IDMs) and ODMs
- Semiconductor Foundries and Fabless Chip Vendors
- Telecom Service Providers / Mobile Network Operators
- Independent Certification and Test Labs
- Aerospace and Defense OEMs
- Automotive and Industrial IoT Device Makers
- Academic and Research Institutes
- By Form Factor
- Benchtop / Rack-mount Instruments
- Portable / Hand-held Instruments
- Modular Instrumentation (PXI / PXIe / AXIe)
- Cloud- or Software-defined Test Platforms
- By Frequency Range
- Sub-1 GHz (FR1 Low)
- 1 - 6 GHz (FR1 Mid)
- 6 - 24 GHz (FR3 Emerging)
- 24 - 40 GHz (FR2 Low mmWave)
- 40 - 52 GHz (FR2 High mmWave)
- 52 - 110 GHz (Sub-THz, D-band Prep)
- above 110 GHz (Terahertz and 6G R&D)
- By Geography
- North America
- United States
- Canada
- Mexico
- South America
- Brazil
- Argentina
- Chile
- Rest of South America
- Europe
- Germany
- United Kingdom
- France
- Italy
- Spain
- Netherlands
- Russia
- Rest of Europe
- Asia-Pacific
- China
- India
- Japan
- South Korea
- ASEAN
- Rest of Asia Pacific
- Middle East and Africa
- Middle East
- GCC (Saudi Arabia, UAE, Qatar, etc.)
- Turkey
- Rest of Middle East
- Africa
- South Africa
- Nigeria
- Kenya
- Rest of Africa
- Middle East
- North America
Detailed Research Methodology and Data Validation
Primary Research
Mordor analysts interviewed test-lab heads in North America, Asia, and Europe, procurement leads at telecom equipment manufacturers, and certification experts from accredited bodies. These conversations validated typical instrument utilization rates, mmWave adoption timelines, and average selling prices, filling gaps left by desk work and anchoring assumptions to real buying behavior.
Desk Research
Our team first assembled public reference points from bodies such as the International Telecommunication Union, 3GPP, the Federal Communications Commission, Eurostat trade data, and national customs statistics. We then reviewed engineering journals, patent families through Questel, and financial filings from listed test-instrument vendors. Premium sources, including D&B Hoovers and Dow Jones Factiva, supplied company-level revenue splits, while Asia Metal clarified mmWave component pricing. The sources named serve as key illustrations; many additional documents informed subsidiary checks.
Market-Sizing & Forecasting
We built a hybrid top-down and bottom-up view. Global 5G handset and module shipments set the demand pool, which is then aligned with device-to-rig penetration ratios, average port counts, and replacement cycles. Results are cross-checked against sampled supplier roll-ups and channel checks to fine-tune totals. Key model inputs include 5G SA device launches, FR2 (mmWave) share of designs, certified lab capacity additions, telecom CAPEX on conformance tools, and average selling price progression for multi-port analyzers. Forecasts use multivariate regression linked to those drivers, with scenario analysis around spectrum-auction delays. Data voids in supplier reporting are bridged by applying regional import values adjusted for duty and freight.
Data Validation & Update Cycle
Outputs pass variance checks against historical shipment curves and independent revenue statements before a senior analyst signs off. The model is refreshed every twelve months, with interim updates triggered by significant regulatory or M&A events, ensuring clients receive the most current baseline.
Why Mordor's 5G Device Testing Equipment Baseline Commands Reliability
Published estimates often diverge because firms choose different equipment scopes, pricing ladders, and refresh cadences.
Key gap drivers include whether services revenue is blended with hardware, how mmWave rigs are priced, and how quickly forecast models absorb new spectrum releases. Our disciplined scope, annual refresh, and dual-source ASP tracking mitigate those mismatches, giving decision-makers a balanced starting point.
Benchmark comparison
| Market Size | Anonymized source | Primary gap driver |
|---|---|---|
| USD 1.77 B | Mordor Intelligence | - |
| USD 2.80 B | Global Consultancy A | Includes network-testing gear and service fees |
| USD 2.19 B | Industry Data Provider B | Treats lab rentals and field testers as one pool |
| USD 1.01 B | Specialist Research House C | Counts only telecom OEM demand, omits ODM volume |
Taken together, the comparison shows that Mordor's clear scope boundaries and timely ASP audits deliver a credible, reproducible baseline that sits comfortably between aggressive and conservative views, offering clients a dependable reference point for planning.


Key Questions Answered in the Report
What is the current size of the 5G device testing equipment market?
The market is valued at USD 1.94 billion in 2026.
What compound annual growth rate is forecast for the market through 2031?
A 9.54% CAGR is projected between 2026 and 2031.
Which product category holds the largest revenue share today?
Oscilloscopes lead with 27.35% of 2025 revenue.
Which geographic region is expanding the fastest?
Asia Pacific is expected to rise at a 12.94% CAGR through 2031.
What primary factor fuels demand for RF channel emulators?
Operators are adopting virtual RAN and realistic channel modeling, spurring need for advanced emulation.
How are suppliers easing the high capital costs of mmWave test rigs?
Vendors promote modular PXI platforms and pay-per-use Lab-as-a-Service models to lower upfront spending.
Page last updated on:


