Market Overview
| Study Period | 2021 - 2031 |
|---|---|
| Forecast Data Period | 2026 - 2031 |
| Historical Data Period | 2021 - 2024 |
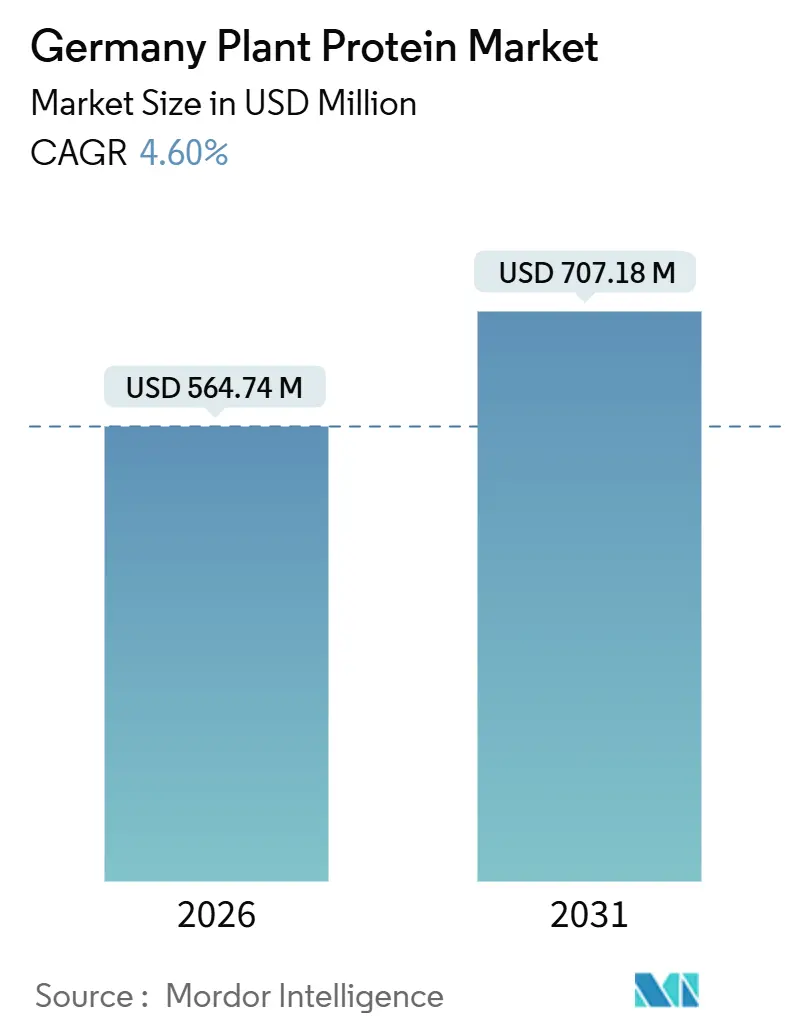
| Market Size (2026) | USD 564.74 Million |
| Market Size (2031) | USD 707.18 Million |
| Growth Rate (2026 - 2031) | 4.60% CAGR |
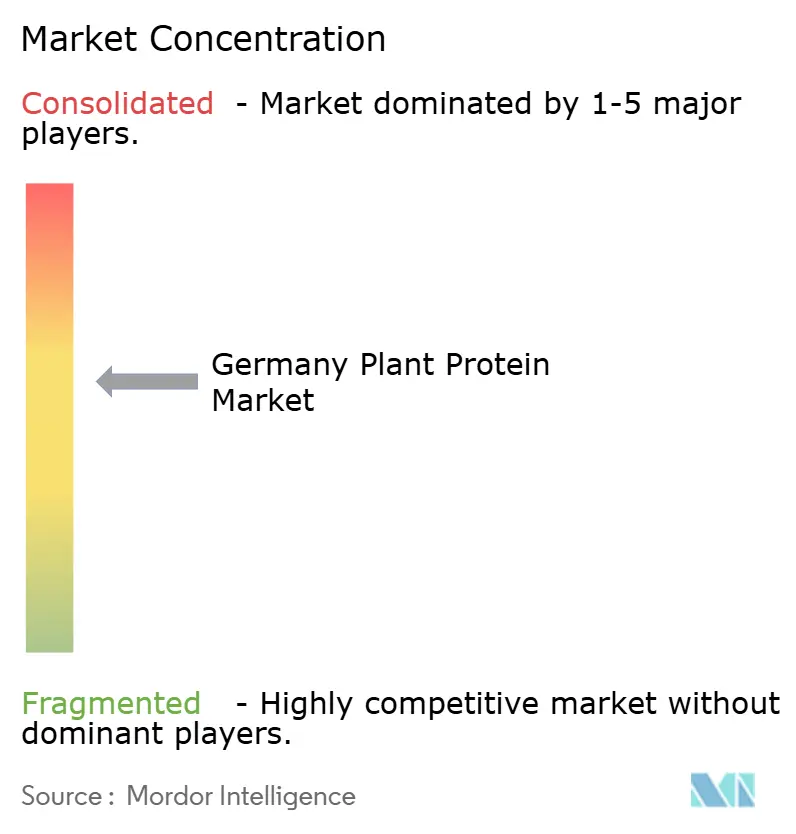
| Market Concentration | Medium |
Major Players*Disclaimer: Major Players sorted in no particular order Image © Mordor Intelligence. Reuse requires attribution under CC BY 4.0. | |
Germany Plant Protein Market Analysis by Mordor Intelligence
The Germany plant protein market size reached USD 564.74 million in 2026 and is projected to advance to USD 707.18 million by 2031, reflecting a 4.60% CAGR over the period. This expansion is anchored in the country’s large flexitarian population, government-funded protein-diversification programs, and a steady build-out of domestic extrusion and pulse-processing assets. Retail discounters intensify competition by pricing private-label pea and soy lines up to 30% below branded peers, while public research and development grants spur pilot projects that lower production costs for next-generation ingredients. German machinery makers have reduced lead times for high-moisture extrusion equipment, accelerating the launch cadence of meat analogues. Persistent headwinds include the 19% VAT on plant-based milk, EU Novel Food approval queues, and limited domestic legume acreage that keeps procurement costs elevated. Collectively, these tailwinds and friction points create a growth trajectory that is solid yet measured for the Germany plant protein market.
Key Report Takeaways
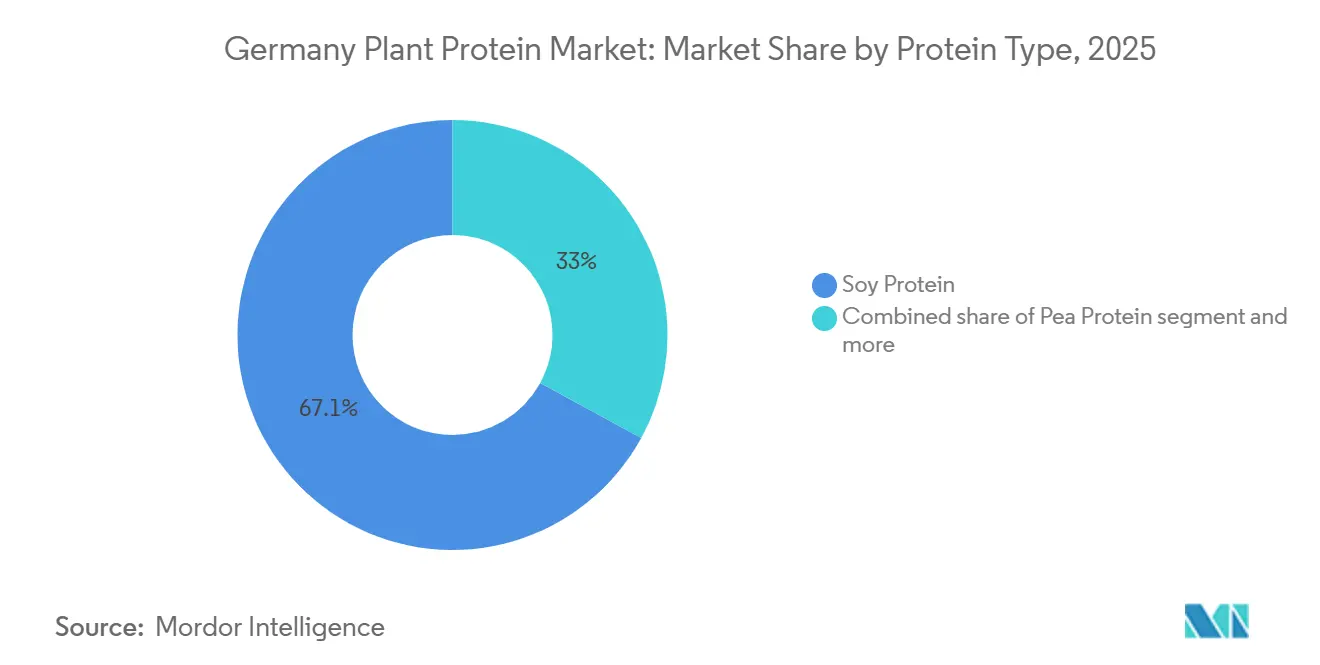
- By protein type, soy commanded 67.05% of Germany plant protein market share in 2025, while pea protein is forecast to grow at a 5.80% CAGR through 2031.
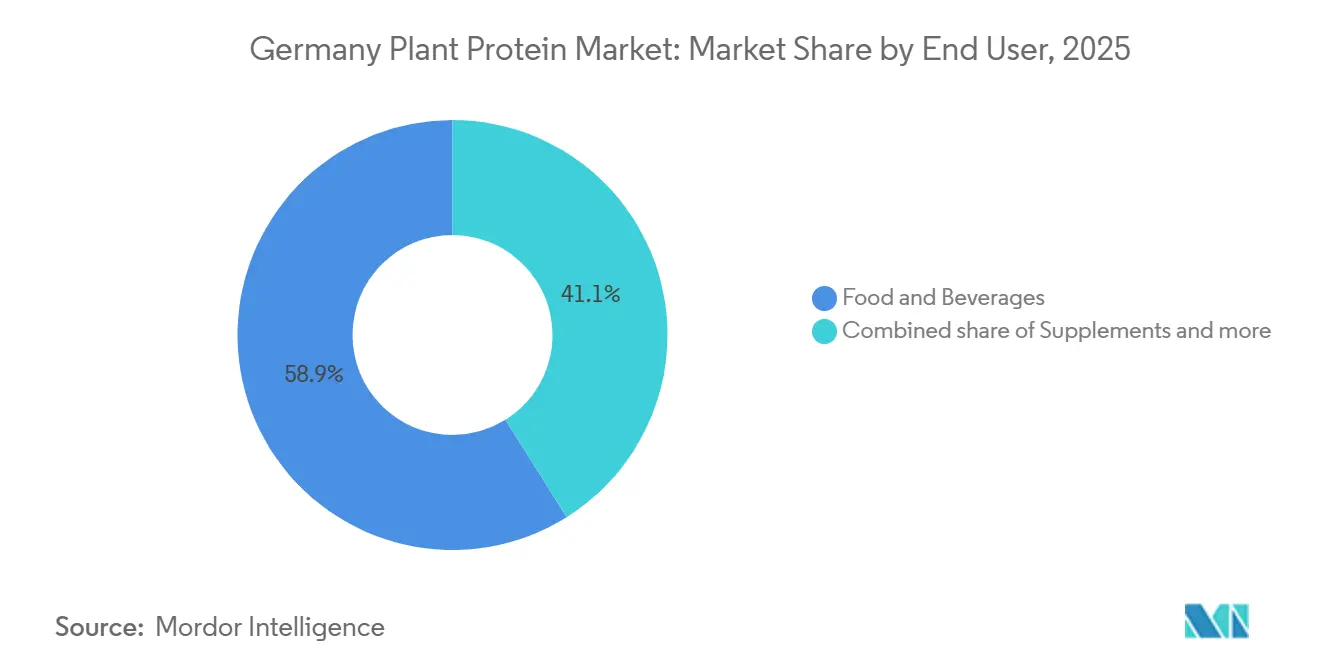
- By end user, food and beverages generated 58.91% of demand in 2025, while supplements are projected to advance at a 5.02% CAGR through 2031.
Note: Market size and forecast figures in this report are generated using Mordor Intelligence’s proprietary estimation framework, updated with the latest available data and insights as of 2026.
Germany Plant Protein Market Trends and Insights
Drivers Impact Analysis*
| Driver | (~) % Impact on CAGR Forecast | Geographic Relevance | Impact Timeline |
|---|---|---|---|
| Rising flexitarian and vegan population | +1.2% | National, with urban concentration in Berlin, Hamburg, Munich | Medium term (2-4 years) |
| Private-label affordability boom in the discounter channel | +0.9% | National, led by Aldi and Lidl store networks | Short term (≤ 2 years) |
| National protein strategy and public research and development grants | +0.8% | National, with cluster effects in North Rhine-Westphalia and Bavaria | Long term (≥ 4 years) |
| DGE 2024 guidelines cutting meat intake | +1.0% | National, influencing public catering and institutional foodservice | Medium term (2-4 years) |
| Domestic extrusion-equipment scale-up accelerates capacity | +0.6% | National, concentrated in Lower Saxony and Baden-Württemberg processing hubs | Medium term (2-4 years) |
| Valorisation of cereal and brewery side-streams for proteins | +0.4% | National, with pilot projects in Bavaria and Rhineland-Palatinate | Long term (≥ 4 years) |
| Source: Mordor Intelligence | |||


Rising flexitarian and vegan population
In 2024, 41% of Germany's population identified as flexitarian, a dietary choice that moderates, but doesn't completely eliminate, animal product consumption. This trend, highlighted by ProVeg International, underscores a growing demand for plant proteins, both in hybrid forms and fully plant-based products. These flexitarians prioritize taste, convenience, and price over strict ideological beliefs. As a result, food manufacturers are reformulating products like sausages, burgers, and deli slices, using pea and soy proteins to replicate meat's texture without sacrificing flavor. While the vegan demographic stands at a modest 2%, its influence on product innovation is significant, with brands vying for prominence on shelves in specialized retail chains like Veganz and Alnatura. Notably, younger consumers aged 18 to 34 are leading the charge in adopting plant proteins. This trend suggests that as these individuals age and their purchasing power grows, their preferences will have an even greater impact. Additionally, public health campaigns linking red meat to cardiovascular risks are helping to mainstream plant-forward diets, diminishing the stigma that once relegated vegetarian options to niche markets.
National protein strategy and public research and development grants
In 2024, the German Federal Ministry of Food and Agriculture earmarked EUR 38 million for alternative protein initiatives. These initiatives encompass research, infrastructure development, and programs aiding farmers in boosting domestic legume cultivation and processing. The funding backs pilot projects focusing on extrusion technology, fermentation-based protein production, and side-stream valorisation, thereby mitigating risks for private-sector investments in these novel processing lines. Collaborating with ingredient suppliers, public research institutions like the Fraunhofer Institute for Process Engineering and Packaging are working to enhance protein extraction yields from faba beans, lupins, and yellow peas, all while driving down production costs per kilogram. The strategy promotes crop rotation, weaving legumes into predominantly cereal farming systems. This not only addresses soil health issues but also fortifies regional protein supply chains. By 2027, the ministry aims for a 50% boost in domestic protein ingredient output, curbing Germany's dependence on soy and pea protein imports from North America and France.
DGE 2024 guidelines: cutting meat intake
In 2024, the German Nutrition Society (DGE) revised its dietary guidelines, advocating for 75% of daily food intake to come from plant sources[1]Source: German Nutrition Society, “DGE-Qualitätsstandard 2024,” dge.de. Additionally, it set a new limit on meat consumption at 300 grams per week, a notable reduction from earlier recommendations. These updated guidelines play a pivotal role in shaping public-sector catering contracts, influencing food provisions for schools, hospitals, and government cafeterias. This shift creates a heightened institutional demand for plant-protein ingredients, ensuring they meet specific nutritional benchmarks for protein density and amino-acid profiles. In response, food manufacturers are reformulating products to align with DGE standards, with a particular emphasis on pea and faba bean proteins, prized for their lysine content and neutral sensory profiles. Furthermore, the guidelines underscore the strategic value of protein blends that merge legume and cereal sources, aiming for a comprehensive amino acid profile. This emphasis is spurring increased research and development investments, particularly in co-texturization and flavor-masking technologies. In the retail arena, adherence to DGE recommendations is becoming a key marketing differentiator. Many brands are prominently showcasing their alignment with these guidelines on front-of-pack labels, enhancing their nutritional credibility.
Domestic extrusion-equipment scale-up accelerates capacity
The expansion of twin-screw extrusion capabilities by German machinery manufacturers and ingredient processors is emerging as a key driver for the Germany plant protein market. This development focuses on producing textured vegetable protein (TVP) and high-moisture meat analogues, addressing the growing demand for plant-based alternatives. By reducing lead times and logistics costs previously associated with importing extruded ingredients from the Netherlands and France, the market is becoming more competitive. In June 2023, Crespel & Deiters announced its investment in extrudate production lines at its Ibbenbüren facility, catering to food manufacturers seeking shorter supply chains and customized protein textures[2]Source: Crespel & Deiters, “Investition in Extrusionskapazität 2023,” crespel-deiters.de. High-moisture extrusion, which creates fibrous structures resembling whole-muscle meat, requires precise control of temperature, pressure, and moisture content. German engineering firms have successfully commercialized these capabilities through modular processing systems. This domestic capacity expansion supports rapid prototyping and small-batch production, accelerating the time-to-market for plant-based meat products. Additionally, equipment suppliers are fostering market growth by offering technical training and co-development partnerships, lowering entry barriers for mid-sized food companies entering the plant-protein category.
Restraints Impact Analysis*
| Restraint | (~) % Impact on CAGR Forecast | Geographic Relevance | Impact Timeline |
|---|---|---|---|
| 19% VAT on plant-based milk keeps price premium | -0.5% | National, affecting retail pricing across all states | Short term (≤ 2 years) |
| Soy-allergen/GMO perception issues | -0.3% | National, with heightened sensitivity in organic and health-focused consumer segments | Medium term (2-4 years) |
| Limited domestic legume acreage strains the raw material supply | -0.4% | National, with acute pressure in the Lower Saxony and Mecklenburg-Vorpommern farming regions | Medium term (2-4 years) |
| EU Novel-Food approval queues for fermentation-derived proteins | -0.3% | EU-wide, delaying market entry for German startups and ingredient suppliers | Long term (≥ 4 years) |
| Source: Mordor Intelligence | |||
19% VAT on plant-based milk keeps price premium
The Germany plant protein market faces a significant restraint due to the 19% value-added tax applied to plant-based milk, which is classified as a processed food, while dairy milk benefits from a reduced 7% tax rate. This tax disparity creates a 15% to 25% price premium for oat, soy, and almond milk, reducing affordability for price-sensitive households and limiting volume growth in the dairy-alternative segment, as reported by the Federal Ministry of Finance[3]Source: Federal Ministry of Finance, “Umsatzsteuergesetz 2024,” bmf.bund.de. Advocacy groups like ProVeg and the Good Food Institute Europe have advocated for tax parity, citing environmental and public health benefits. However, legislative reform efforts have stalled due to opposition from the dairy industry. The price gap disproportionately impacts lower-income consumers, who are more price-sensitive and often revert to dairy milk when household budgets tighten. Although retailers attempt to mitigate this issue through private-label offerings and promotional pricing, the structural tax disadvantage remains a significant growth barrier. Addressing this restraint would require federal legislative action, a process that typically spans multiple budget cycles and faces resistance from entrenched agricultural lobbies.
Soy-allergen/GMO perception issues
In 2025, soy protein commanded a dominant 67.05% market share. Yet, it grapples with consumer skepticism, primarily due to allergen concerns and perceptions surrounding genetically modified organisms (GMOs). This skepticism is especially pronounced among organic and health-conscious consumers. The European Union's regulations require GMO labeling for soy-derived ingredients. In Germany, the majority of soy protein is non-GMO, sourced either from local European suppliers or from South American suppliers with certified sustainable practices. Despite these measures, negative associations with soy persist. While only a small segment of the population is affected by soy allergenicity, it garners significant media attention. This heightened scrutiny has led food manufacturers to pivot, reformulating products with alternatives like pea, faba bean, or potato protein to sidestep labeling concerns. Such ingredient substitutions are diminishing soy protein's presence in premium and clean-label product lines, shifting growth momentum towards alternative protein sources. In response to these challenges, suppliers are adopting transparency measures, such as blockchain-enabled traceability and securing third-party non-GMO certifications. However, despite these efforts, soy protein's growth remains tethered to mature, cost-sensitive applications, including animal feed and industrial bakeries.
*Our forecasts treat driver/restraint impacts as directional, not additive. The impact forecasts reflect baseline growth, mix effects, and variable interactions.
Segment Analysis
By Protein Type: Pea Protein Gains on Allergen-Free Appeal
Pea protein is projected to grow at a 5.80% CAGR from 2026 to 2031, driven by its allergen-free nature, neutral flavor, and compatibility with clean-label formulations excluding soy and gluten. In February 2024, Roquette launched NUTRALYS S85M pea protein isolate for dairy-alternative yogurts and ice creams, targeting brands reformulating to replace soy protein in premium products. Its amino acid profile, rich in branched-chain amino acids, appeals to sports-nutrition formulators focused on muscle recovery and performance, a segment that grew in Germany through 2025. Soy protein, supported by its cost-effectiveness and established role in textured vegetable protein and meat analogues, held a 67.05% market share in 2025.
Potato protein, a by-product of starch processing, serves gluten-free bakeries and hypoallergenic infant formulas, aided by Emsland Group's vertical integration. Rice protein, popular in Asian cuisines and among allergen-sensitive consumers, requires blending with legume proteins to offset its lower lysine content. Wheat protein, primarily vital wheat gluten, dominates meat-analogue formulations needing fibrous texture but faces challenges from gluten-free trends driving demand for pea and faba bean alternatives. Hemp protein, though small in scale, is gaining traction for its omega-3 fatty acids and sustainability, with SunflowerFamily GmbH piloting hemp-protein ingredients in bakery and snack products. Other plant proteins, including faba bean, lupin, and sunflower, address specific needs: faba bean for emulsification, lupin for high-protein bakery, and sunflower for allergen-free positioning, though limited processing capacity and higher costs constrain growth.


By End User: Supplements Surge on Aging Demographics
Germany's aging population and growing fitness trends are driving the supplements segment to a 5.02% CAGR through 2031. Elderly nutrition and medical products increasingly use pea and rice protein isolates to address sarcopenia and protein deficiencies, adhering to ESPEN guidelines. Sports nutrition brands are reformulating protein powders and ready-to-drink shakes with plant proteins to target flexitarian athletes. Baby food and infant formula manufacturers are piloting pea and rice protein in hypoallergenic formulations, though EU regulatory scrutiny slows commercialization.
In 2025, food and beverages will account for 58.91% of demand, led by meat and poultry alternatives as brands like Planted and Veganz expand distribution. Dairy and dairy-alternative products, such as yogurt and ice cream, use pea and faba bean protein for texture, with Ferrero's Nutella Plant-Based launch signaling mainstream acceptance. Bakeries incorporate wheat and pea protein into bread and snacks to meet functional food demand. Beverages, including protein-fortified smoothies and plant-based milk, drive innovation in flavor masking and emulsion stability. Ready-to-eat meals use textured soy and pea protein in pasta sauces and frozen entrées, while condiments and snacks grow with protein-enriched dressings and extruded snacks. Animal feed absorbs lower-grade soy and pea protein as aquaculture and poultry producers replace imports with domestic plant proteins. Personal care products utilize hydrolyzed wheat and rice protein for hair and skin formulations. This diversification across food, nutrition, and non-food applications mitigates single-category volatility.
Geography Analysis
Germany functions as both a consumption hub and a processing center within the European plant-protein value chain, benefiting from advanced food-manufacturing infrastructure, a large flexitarian consumer base, and proximity to Northern European legume-growing regions. The country's plant-protein market reflects national demand patterns shaped by dietary guidelines, retail channel dynamics, and government-backed protein-diversification initiatives. Regional processing clusters in Lower Saxony, North Rhine-Westphalia, and Bavaria concentrate ingredient production, leveraging access to cereal and legume raw materials from domestic farms and neighboring France. BENEO's April 2025 opening of a EUR 50 million pulse-processing facility in Obrigheim, Baden-Württemberg, exemplifies investments that localize supply chains and reduce reliance on imported pea and faba bean protein from Canada and France.
Germany's domestic legume cultivation reached 285,000 hectares in 2024, nearly tripling since 2011, yet still falls short of processing demand during peak seasons, forcing manufacturers to source supplemental volumes from France, Lithuania, and Canada at elevated logistics costs, according to the Federal Statistical Office. This supply-demand imbalance elevates the strategic importance of side-stream valorisation projects that extract protein from brewery spent grain and cereal milling by-products, converting waste streams into functional ingredients. Regional pilot projects in Bavaria, supported by Fraunhofer Institute research, demonstrate the commercial viability of enzymatic protein extraction from barley and wheat side-streams, though yields remain below dedicated legume crops. Export activity centers on high-value protein isolates and specialty ingredients, with German suppliers serving food manufacturers across Western Europe, while bulk textured proteins face import competition from Dutch and French processors with larger extrusion capacity.
Urban centers, particularly Berlin, Hamburg, and Munich, exhibit higher per-capita consumption of plant-protein products, driven by younger demographics, higher incomes, and concentrated retail presence of specialized plant-based chains. Rural areas lag in adoption, constrained by limited product availability in traditional grocery formats and lower awareness of plant-protein benefits. This geographic disparity underscores the importance of discounter-channel expansion, as Aldi and Lidl's nationwide store networks democratize access to affordable plant-protein products in smaller towns and rural communities. Regulatory frameworks, including the DGE 2024 dietary guidelines and BMEL's national protein strategy, apply uniformly across states, yet implementation varies in public-sector catering, where municipal procurement practices influence institutional demand for plant-protein ingredients.
Competitive Landscape
Multinational ingredient suppliers, including Archer Daniels Midland, Ingredion Incorporated, and Kerry Group PLC, dominate the German plant protein market. These companies, with their diverse protein portfolios and established customer relationships, utilize technical services to aid in product reformulation. By leveraging global sourcing networks, they mitigate raw material volatility. Furthermore, they invest in application-development centers, collaborating with food manufacturers to co-create texturized proteins and functional blends. Meanwhile, regional specialists like Emsland Group (focusing on potato protein), Crespel & Deiters (wheat and pea protein), and Lantmännen (pea protein) carve out niche segments. They do this by offering shorter lead times, customized formulations, and being conveniently located near German food processors. A notable sign of the market's consolidation pressures is the November 2024 agreement between Ingredion and Lantmännen, where they committed over EUR 100 million to a Swedish pea-protein facility. This move underscores the trend of mid-sized players seeking scale to enhance their cost competitiveness.
Disruptors in the market are harnessing cutting-edge technologies like fermentation, precision fermentation, and biomass cultivation. They are zeroing in on premium segments, where their functional differentiation allows them to command higher price points. Infinite Roots, having raised USD 58 million in Series B funding in January 2024, specializes in producing mycoprotein via fungal fermentation. Their innovation offers whole-cut meat textures, eliminating the need for extrusion processing. Another player, Planted, a Swiss firm, inaugurated a production facility in southern Germany in April 2025. They utilize high-moisture extrusion and fermentation techniques to craft marbled plant-based steaks, successfully securing placements in upscale restaurants.
There's a burgeoning interest in hybrid meat products, which combine plant and animal proteins. This approach not only curtails costs and environmental impact but also retains consumer acceptance, especially among flexitarian households hesitant about fully plant-based options. Ingredient suppliers are also moving upstream, integrating backward into legume cultivation. This strategy not only ensures a steady raw material supply but also allows them to capture greater margins throughout the value chain. Adhering to ISO 22000 food-safety standards, along with voluntary certifications like non-GMO and organic, is becoming essential for those eyeing the premium segment. To further bolster their market position, suppliers are investing in traceability systems, ensuring they meet the transparency demands of retailers and brand owners.
Germany Plant Protein Industry Leaders
Archer Daniels Midland Company
CHS Inc.
Ingredion Incorporated
Kerry Group PLC
Wilmar International Ltd
- *Disclaimer: Major Players sorted in no particular order

Recent Industry Developments
- January 2026: The German scale-up ProteinDistillery is transforming its Heilbronn production site into a comprehensive research and development and contract manufacturing hub. From early 2026, the facility will produce Prew:tein, a functional protein derived from upcycled brewer’s yeast. The center is designed to support other startups by providing modular processing services like spray-drying and purification.
- April 2025: BENEO inaugurated a EUR 50 million pulse-processing plant in Obrigheim, Germany, dedicated to faba bean protein production, increasing domestic processing capacity, and reducing reliance on imported legume protein from Canada and France. By sourcing from local German farmers, BENEO aims to reduce transport emissions and provide a sustainable, allergen-free alternative to soy and animal-based proteins for the growing European meat and dairy alternative sectors.
- October 2024: Mycelium startup Infinite Roots (formerly Mushlabs) partnered with the Hamburg University of Technology for a research project funded by a EUR 2.6 million federal grant. This collaboration focuses on developing technology to upcycle whey, a byproduct of the dairy industry, into a nutrient-rich feedstock for mycelium fermentation.


Germany Plant Protein Market Report Scope
Plant protein refers to protein derived directly from plants, such as legumes, grains, seeds, and nuts. The Germany plant protein market is segmented by protein type and end user. By protein type, the market is segmented into Hemp Protein, Pea Protein, Potato Protein, Rice Protein, Soy Protein, Wheat Protein, and Other Plant Protein. By end user, the market is segmented into animal feed, food and beverages, personal care and cosmetics, and supplements. The food and beverages segment is further sub-segmented into bakery, beverages, breakfast cereals, condiments/sauces, confectionery, dairy and dairy alternative products, Meat/Poultry/Seafood and Meat Alternative Products, RTE/RTC food products, and snacks. Similarly, the supplements segment is further sub-segmented into Baby Food and infant formula, elderly nutrition and medical nutrition, and sport/performance nutrition. The Market forecasts are provided in terms of value (USD) and volume (Tons).
Protein Type
| Hemp Protein |
| Pea Protein |
| Potato Protein |
| Rice Protein |
| Soy Protein |
| Wheat Protein |
| Other Plant Protein |
End User
| Animal Feed | |
| Food and Beverages | Bakery |
| Beverages | |
| Breakfast Cereals | |
| Condiments/Sauces | |
| Confectionery | |
| Dairy and Dairy Alternative Products | |
| Meat/Poultry/Seafood and Meat Alternative Products | |
| RTE/RTC Food Products | |
| Snacks | |
| Personal Care and Cosmetics | |
| Supplements | Baby Food and Infant Formula |
| Elderly Nutrition and Medical Nutrition | |
| Sport/Performance Nutrition |
| Protein Type | Hemp Protein | |
| Pea Protein | ||
| Potato Protein | ||
| Rice Protein | ||
| Soy Protein | ||
| Wheat Protein | ||
| Other Plant Protein | ||
| End User | Animal Feed | |
| Food and Beverages | Bakery | |
| Beverages | ||
| Breakfast Cereals | ||
| Condiments/Sauces | ||
| Confectionery | ||
| Dairy and Dairy Alternative Products | ||
| Meat/Poultry/Seafood and Meat Alternative Products | ||
| RTE/RTC Food Products | ||
| Snacks | ||
| Personal Care and Cosmetics | ||
| Supplements | Baby Food and Infant Formula | |
| Elderly Nutrition and Medical Nutrition | ||
| Sport/Performance Nutrition | ||


Market Definition
- End User - The Protein Ingredients Market operates on a B2B basis. Food, Beverages, Supplements, Animal Feed, and Personal Care & Cosmetic manufacturers are considered to be end-consumers in the market studied. The scope excludes manufacturers buying liquid/dry whey to be used for application as a binding agent or thickener or other non-protein applications.
- Penetration Rate - Penetration Rate is defined as the percentage of Protein-Fortified End User Market Volume in the Overall End User Market Volume.
- Average Protein Content - Average protein content is the average protein content present per 100 g of product manufactured by all end-user companies considered under the scope of this report.
- End User Market Volume - End-user market volume is the consolidated volume of all types and forms of end-user products in the country or region.
| Keyword | Definition |
|---|---|
| Alpha-lactalbumin (α-Lactalbumin) | It is a protein that regulates the production of lactose in the milk of almost all mammalian species. |
| Amino acid | It is an organic compound that contains both amino and carboxylic acid functional groups, which are required for the synthesis of body protein and other important nitrogen-containing compounds, such as creatine, peptide hormones, and some neurotransmitters. |
| Blanching | It is the process of briefly heating vegetables with steam or boiling water. |
| BRC | British Retail Consortium |
| Bread improver | It is a flour-based blend of several components with specific functional properties designed to modify dough characteristics and give quality attributes to bread. |
| BSF | Black Soldier Fly |
| Caseinate | It is a substance produced by adding an alkali to acid casein, a derivative of casein. |
| Celiac disease | Celiac disease is an immune reaction to eating gluten, a protein found in wheat, barley, and rye. |
| Colostrum | It is a milky fluid that’s released by mammals that have recently given birth before breast milk production begins. |
| Concentrate | It is the least processed form of protein and has a protein content ranging from 40-90% by weight. |
| Dry protein basis | It refers to the percentage of "pure protein" present in a supplement after the water in it is completely removed through heat. |
| Dry whey | It is the product resulting from drying fresh whey which has been pasteurized and to which nothing has been added as a preservative. |
| Egg protein | It is a mixture of individual proteins, including ovalbumin, ovomucoid, ovoglobulin, conalbumin, vitellin, and vitellenin. |
| Emulsifier | It is a food additive that facilitates the blending of foods that are immiscible with one another, such as oil and water. |
| Enrichment | It is the process of addition of micronutrients that are lost during the processing of the product. |
| ERS | Economic Research Service of the USDA |
| Extrusion | It is the process of forcing soft mixed ingredients through an opening in a perforated plate or die designed to produce the required shape. The extruded food is then cut to a specific size by blades. |
| Fava | Also known as Faba, it is another word for yellow split beans. |
| FDA | Food and Drug Administration |
| Flaking | It is a process in which typically a cereal grain (like corn, wheat, or rice) is broken down into grits, cooked with flavors and syrups, and then pressed into flakes between cooled rollers. |
| Foaming agent | It is a food ingredient that makes it possible to form or maintain a uniform dispersion of a gaseous phase in a liquid or solid food. |
| Foodservice | It refers to the part of the food industry which includes businesses, institutions, and companies which prepare meals outside the home. It includes restaurants, school and hospital cafeterias, catering operations, and many other formats. |
| Fortification | It is the deliberate addition of micronutrients that are not found in them naturally or which are lost during processing, to improve a food product's nutritional value. |
| FSANZ | Food Standards Australia New Zealand |
| FSIS | Food Safety and Inspection Service |
| FSSAI | Food Safety and Standards Authority of India |
| Gelling agent | It is an ingredient that functions as a stabilizer and thickener to provide thickening without stiffness through the formation of gel. |
| GHG | Greenhouse Gas |
| Gluten | It is a family of proteins found in grains, including wheat, rye, spelt, and barley. |
| Hemp | It is a botanical class of Cannabis sativa cultivars grown specifically for industrial or medicinal use. |
| Hydrolysate | It is a form of protein manufactured by exposing the protein to enzymes that can partially break the bonds between the protein's amino acids and break down large, complicated proteins into smaller pieces. Its processing makes it easier and quicker to digest. |
| Hypoallergenic | It refers to a substance that causes fewer allergic reactions. |
| Isolate | It is the purest and most processed form of protein which has undergone separation to obtain a pure protein fraction. It typically contains ≥ 90% of protein by weight. |
| Keratin | It is a protein that helps form hair, nails, and the outer layer of skin. |
| Lactalbumin | It is the albumin contained in milk and obtained from whey. |
| Lactoferrin | It is an iron‑binding glycoprotein that is present in the milk of most mammals. |
| Lupin | It is the yellow legume seeds of the genus Lupinus. |
| Millenial | Also known as Generation Y or Gen Y, it refers to the people born from 1981 to 1996. |
| Monogastric | It refers to an animal with a single-compartmented stomach. Examples of monogastric include humans, poultry, pigs, horses, rabbits, dogs, and cats. Most monogastric are generally unable to digest much cellulose food materials such as grasses. |
| MPC | Milk protein concentrate |
| MPI | Milk protein isolate |
| MSPI | Methylated soy protein isolate |
| Mycoprotein | Mycoprotein is a form of single-cell protein, also known as fungal protein, derived from fungi for human consumption. |
| Nutricosmetics | It is a category of products and ingredients that act as nutritional supplements to care for skin, nails, and hair natural beauty. |
| Osteoporosis | It is a medical condition in which the bones become brittle and fragile from loss of tissue, typically as a result of hormonal changes, or deficiency of calcium or vitamin D. |
| PDCAAS | Protein digestibility-corrected amino acid score (PDCAAS) is a method of evaluating the quality of a protein based on both the amino acid requirements of humans and their ability to digest it. |
| Per-capita consumption of animal protein | It is the average amount of animal protein (such as milk, whey, gelatin, collagen, and egg proteins) that is readily available for consumption by each person in an actual population. |
| Per-capita consumption of plant protein | It is the average amount of plant protein (such as soy, wheat, pea, oat, and hemp proteins) that is readily available for consumption by each person in an actual population. |
| Quorn | It is a microbial protein manufactured using mycoprotein as an ingredient, in which the fungus culture is dried and mixed with egg albumen or potato protein, which acts as a binder, and then is adjusted in texture and pressed into various forms. |
| Ready-to-Cook (RTC) | It refers to food products that include all of the ingredients, where some preparation or cooking is required through a process that is given on the package. |
| Ready-to-Eat (RTE) | It refers to a food product prepared or cooked in advance, with no further cooking or preparation required before being eaten. |
| RTD | Ready-to-Drink |
| RTS | Ready-to-Serve |
| Saturated fat | It is a type of fat in which the fatty acid chains have all single bonds. It is generally considered unhealthy. |
| Sausage | It is a meat product made of finely chopped and seasoned meat, which may be fresh, smoked, or pickled and which is then usually stuffed into a casing. |
| Seitan | It is a plant-based meat substitute made out of wheat gluten. |
| Softgel | It is a gelatin-based capsule with a liquid fill. |
| SPC | Soy protein concentrate |
| SPI | Soy protein isolate |
| Spirulina | It is a biomass of cyanobacteria that can be consumed by humans and animals. |
| Stabilizer | It is an ingredient added to food products to help maintain or enhance their original texture, and physical and chemical characteristics. |
| Supplementation | It is the consumption or provision of concentrated sources of nutrients or other substances that are intended to supplement nutrients in the diet and is intended to correct nutritional deficiencies. |
| Texturant | It is a specific type of food ingredient that is used to control and alter the mouthfeel and texture of food and beverage products. |
| Thickener | It is an ingredient that is used to increase the viscosity of a liquid or dough and make it thicker, without substantially changing its other properties. |
| Trans fat | Also called trans-unsaturated fatty acids or trans fatty acids, it is a type of unsaturated fat that naturally occurs in small amounts in meat. |
| TSP | Textured soy protein |
| TVP | Textured vegetable protein |
| WPC | Whey protein concentrate |
| WPI | Whey protein isolate |


Research Methodology
Mordor Intelligence follows a four-step methodology in all our reports.
- Step-1: Identify Key Variables: The quantifiable key variables (industry and extraneous) pertaining to the specific product segment and country are selected from a group of relevant variables & factors based on desk research & literature review; along with primary expert inputs. These variables are further confirmed through regression modeling (wherever required).
- Step-2: Build a Market Model: In order to build a robust forecasting methodology, the variables and factors identified in Step-1 are tested against available historical market numbers. Through an iterative process, the variables required for market forecast are set and the model is built on the basis of these variables.
- Step-3: Validate and Finalize: In this important step, all market numbers, variables and analyst calls are validated through an extensive network of primary research experts from the market studied. The respondents are selected across levels and functions to generate a holistic picture of the market studied.
- Step-4: Research Outputs: Syndicated Reports, Custom Consulting Assignments, Databases & Subscription Platforms


