
General Aviation Insurance Market Size and Share
Market Overview
| Study Period | 2020 - 2031 |
|---|---|
| Market Size (2026) | USD 4.05 Billion |
| Market Size (2031) | USD 4.90 Billion |
| Growth Rate (2026 - 2031) | 3.90 % |
| Fastest Growing Market | Asia-Pacific |
| Largest Market | North America |
| Market Concentration | High |
Major Players *Disclaimer: Major Players sorted in no particular order Image © Mordor Intelligence. Reuse requires attribution under CC BY 4.0. | |
General Aviation Insurance Market Analysis by Mordor Intelligence
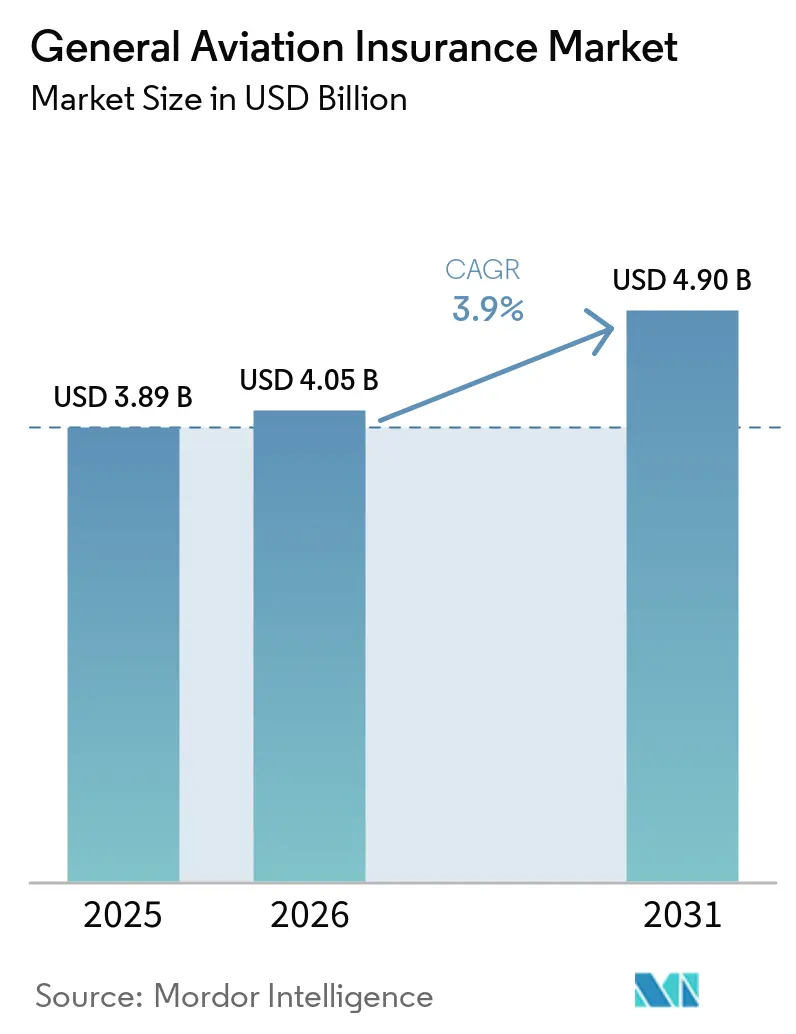
The General Aviation Insurance Market size is projected to be USD 3.89 billion in 2025, USD 4.05 billion in 2026, and reach USD 4.90 billion by 2031, growing at a CAGR of 3.9% from 2026 to 2031.
Aircraft deliveries and billings are raising the insured value of the global fleet, which supports premium growth as policies renew. GAMA recorded USD 35.7 billion in preliminary aircraft deliveries in 2025, including USD 31 billion in airplane billings, and reported 877 aircraft shipments with USD 6.85 billion in billings in the first quarter of 2026. Commercial activity, changing operating models, and expanded safety requirements are increasing the need for liability coverage. Repair delays and higher replacement costs are also changing the level of risk that insurers must price into hull policies. Competition remains active in established markets, while digital underwriting gives insurers and distribution platforms more ways to assess flight-level risk.
Key Report Takeaways
- By product type, hull and physical damage captured 49.18% of the general aviation insurance market share in 2025, while operating liability is projected to grow at a 4.57% CAGR through 2031.
- By end user, corporate and business aviation operators held 39.12% of the general aviation insurance market share in 2025, while commercial GA operators are projected to grow at a 4.92% CAGR through 2031.
- By distribution channel, broker-mediated open market captured 60.86% of the general aviation insurance market share in 2025, while delegated authority is projected to grow at a 5.67% CAGR through 2031.
- By geography, North America captured 79.32% of the general aviation insurance market share in 2025, while Asia-Pacific is projected to grow at a 7.87% CAGR through 2031.
Note: Market size and forecast figures in this report are generated using Mordor Intelligence’s proprietary estimation framework, updated with the latest available data and insights as of January 2026.
Global General Aviation Insurance Market Trends and Insights
Drivers Impact Analysis*
| Driver | (~) % Impact on CAGR Forecast | Geographic Relevance | Impact Timeline |
|---|---|---|---|
| Growth in the Global General Aviation Fleet and Flight Activity | +0.8% | Global | Short term (≤ 2 years) |
| Rising Business Aviation and High-Value Private Aircraft Utilization | +0.7% | North America and Europe | Medium term (2-4 years) |
| Increasing Aircraft Replacement Costs and Insured Asset Values | +0.6% | Global | Medium term (2-4 years) |
| Liability Protection Requirements and Heightened Risk Management Needs | +0.5% | North America and EU | Medium term (2-4 years) |
| Expansion of Commercial and Specialized General Aviation Operations | +0.4% | Asia-Pacific and MEA | Long term (≥ 4 years) |
| Digitalization of General Aviation Risk Assessment and Underwriting | +0.3% | Global | Long term (≥ 4 years) |
| Source: Mordor Intelligence | |||
Growth in the Global General Aviation Fleet and Flight Activity
The general aviation insurance market benefits directly when more aircraft enter service and fly more often. GAMA reported 3,230 airplane shipments in 2025, a 2.2% increase from 2024, while 877 aircraft were shipped in the first quarter of 2026[1]https://avweb.com/aviation-news/gama-6-85b-q1-aircraft-billings/. More aircraft create additional demand for hull, liability, and specialty protection across owner and operator categories. Higher utilization also increases the number of operating exposures that policies must cover. The move toward fractional ownership and charter flying adds a changing pattern of liability exposure because activity is spread across multiple users and aircraft. ICAO safety planning and its expanded safety management requirements bring more operators within a formal regulatory framework, supporting the need for operating liability coverage.
Rising Business Aviation and High-Value Private Aircraft Utilization
The general aviation insurance market is supported by demand for business aircraft and high-value private aircraft. GAMA recorded 854 business jet deliveries in 2025, the highest level since 2009, while total airplane billings reached USD 31 billion[2]https://www.aopa.org/news-and-media/all-news/2026/february/19/aircraft-market-steady-in-2025. New deliveries have a greater mix of long-range and ultra-long-range aircraft, which raises insured hull values. Higher flight activity in corporate and fractional fleets also increases the number of liability events that insurers must consider. Fractional programs require policy structures that can account for multiple ownership interests and changing use patterns. Growth in Latin America and Africa adds cross-border liability considerations for policy forms that were historically designed around North American operations.
Increasing Aircraft Replacement Costs and Insured Asset Values
The general aviation insurance market gains premium support from higher aircraft replacement values, but those same values increase claims exposure. Modern aircraft use composite materials and advanced avionics, which can require specialized repairs after relatively minor damage. OEM parts constraints and maintenance capacity shortages can extend aircraft-on-ground periods and increase related costs. GAMA’s USD 35.7 billion in 2025 aircraft billings show that the fleet is being refreshed with higher-value assets. When premium rates do not keep pace with replacement costs, insurers can face coverage values that do not reflect the full cost of a loss. This makes pricing discipline and accurate hull valuation central to the general aviation insurance market.
Liability Protection Requirements and Heightened Risk Management Needs
Liability coverage is becoming more important as general aviation operations become more varied and more regulated. ICAO’s Annex 19 Amendment 2 is applicable from November 2026 and extends safety management system requirements to remotely piloted aircraft operators and certified heliports. The wider regulated population creates additional demand for policies that address operating liability. Operators also need risk management practices that reflect their aircraft type, mission, and operating environment. Charter, training, agricultural, and public-service activities each carry different third-party exposure. Insurers that can align policy terms with these operating differences can address a broader share of the general aviation insurance market.
Restraints Impact Analysis*
| Restraint | (~) % Impact on CAGR Forecast | Geographic Relevance | Impact Timeline |
|---|---|---|---|
| Escalating Aircraft Repair and Maintenance Costs | -0.9% | Global | Short term (≤ 2 years) |
| High-Severity Liability and Aircraft Loss Exposure | -0.8% | North America and EU | Medium term (2-4 years) |
| Limited Specialist Underwriting Capacity for Complex General Aviation Risks | -0.6% | Asia-Pacific and MEA | Long term (≥ 4 years) |
| Insurance Affordability Pressures from Rising Premiums and Deductibles | -0.5% | Emerging markets | Medium term (2-4 years) |
| Source: Mordor Intelligence | |||
Escalating Aircraft Repair and Maintenance Costs
Rising maintenance and repair costs constrain profitable underwriting in the general aviation insurance market. Composite repairs, specialized tools, constrained parts supply, and limited maintenance labor can increase the cost and duration of a claim. Longer aircraft-on-ground periods can also increase consequential costs under relevant hull policies. These conditions make it harder for insurers to offer coverage at rates that reflect the full cost of repair. Operators may respond to higher premiums by reducing limits or accepting higher deductibles. The pressure, therefore, affects both insurer margins and the willingness of some operators to buy broad coverage.
High-Severity Liability and Aircraft Loss Exposure
High-severity accidents and liability claims remain a structural consideration for the general aviation insurance market. The latest FAA data show that the United States general aviation fatal accident rate fell to 0.61 per 100,000 flight hours in FY2025, following 0.68 in FY2024, although significant accident exposures remain[3]FAA Safety Briefing - January February 2026. faa.gov. Accident claims can involve aircraft damage, injuries, third-party liability, and complex legal processes. Cross-border operations add further complexity because liability requirements and legal practices differ by jurisdiction. These factors require careful limit selection, reserving, and reinsurance support.
*Our forecasts treat driver/restraint impacts as directional, not additive. The impact forecasts reflect baseline growth, mix effects, and variable interactions.
Segment Analysis
By Product Type: Hull Coverage Remains the Largest Product Line
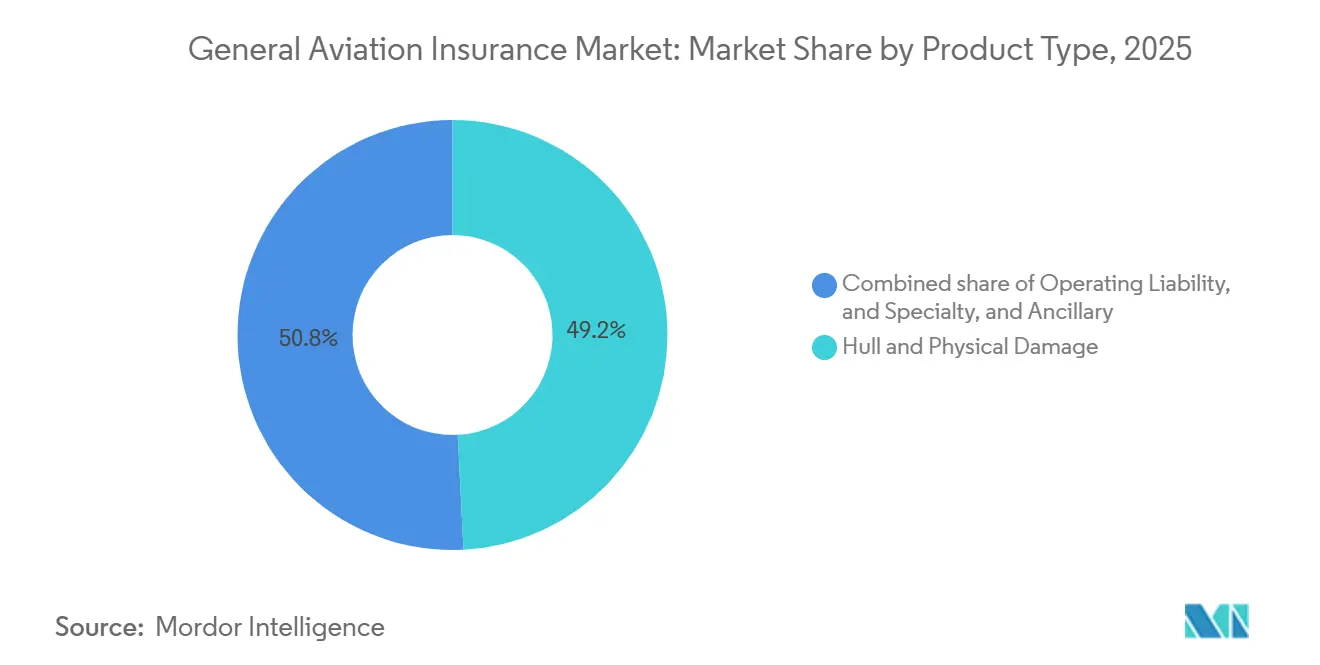
Hull and physical damage captured 49.18% of the general aviation insurance market share in 2025, making it the leading product category. Its leadership reflects the importance of protecting aircraft assets with high replacement values. Agreed-value structures link premiums to the value established for the aircraft rather than to depreciated value, allowing higher aircraft values to be reflected in renewal premiums. GAMA’s 2025 billings of USD 35.7 billion indicate that the fleet continues to receive higher-value aircraft. Composite airframes and advanced systems also increase the cost of many repairs.
The general aviation insurance market size for operating liability is projected to grow at a 4.57% CAGR between 2026 and 2031, faster than the overall market. Commercial activity, fractional programs, and air-taxi services are expanding the number of operators with third-party liability exposure. Specialty and ancillary products address related needs such as loss of license, airport liability, hangar-keeper protection, and war risk. Demand for these policies rises as operations become more complex, rather than only as fleet counts rise. The faster growth of liability coverage indicates that liability accumulation is increasing relative to asset-value growth in the general aviation insurance industry.


By End User: Corporate Operators Lead While Commercial Operators Grow Faster
Corporate and business aviation operators held 39.12% of the general aviation insurance market share in 2025, giving this group the leading position. The segment includes corporate flight departments, charter-certificate holders, and high-net-worth operators with high insured hull values and substantial liability requirements. Flight hours for business aviation increased 5% year over year in the third quarter of 2025. OEM order backlogs of 18-24 months support continued fleet additions during the forecast period. Competition for large accounts remains strong when operators have favorable loss records and established safety systems.
Commercial GA operators are projected to grow at a 4.92% CAGR between 2026 and 2031, the highest rate among end-user categories. Their activity includes charter, medical evacuation, agricultural spraying, precision survey work, power-line inspection, and air-taxi operations. These missions create a varied risk pool because aircraft, terrain, operating hours, and payloads differ substantially. Private and recreational owners represent the largest group by aircraft count and face particular affordability pressure from repair-cost inflation. Training, FBO, and GA service operators benefit from flight-school use linked to pilot demand, while government and public-service operators work within budget limits and can have more stable loss patterns than some private commercial activities. The general aviation insurance market size is supported by continued fleet expansion and the growing range of specialized commercial operations.
By Distribution Channel: Brokers Lead While Delegated Models Expand
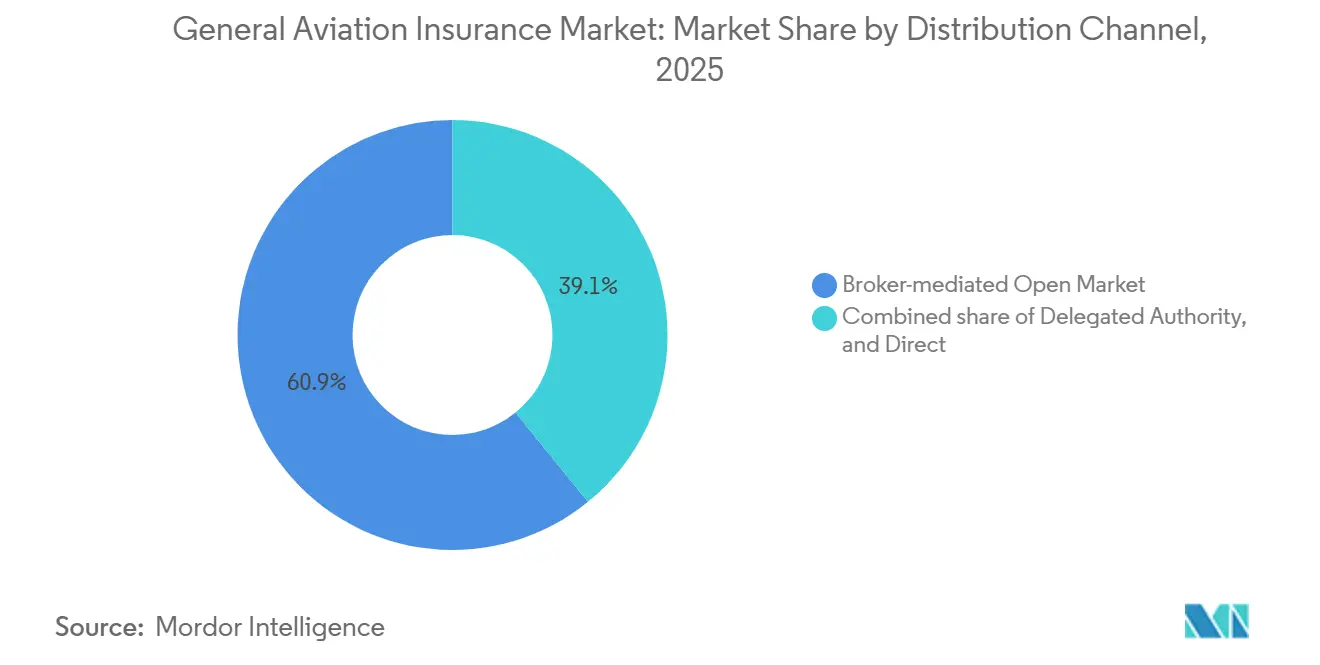
Broker-mediated open market captured 60.86% of premium distribution in 2025, reflecting its central role in the general aviation insurance market. Brokers provide placement, coverage negotiation, and claims support for high-value aircraft, unusual missions, and bespoke liability limits. Lloyd’s reported a combined ratio of 87.6% for the full year 2025, supporting its role as a major source of specialist capacity. Open market placements can access Lloyd’s and other global insurers when local capacity is insufficient. This model remains valuable where underwriting requires individual review and customized policy terms.
Delegated authority is projected to grow at a 5.67% CAGR between 2026 and 2031. Managing general agents and coverholders can use delegated authority to serve routine and light general aviation risks with more standardized workflows. These risks include single-engine piston aircraft, recreational ultralights, and standardized fleet programs. AIM expanded its coverage program to California in January 2026, bringing its operating footprint to 48 states of the United States with HDI capacity. The direct channel is smaller but can be disruptive because digital platforms collect proprietary flight data, and the three channels are increasingly complementary. The general aviation insurance market size is supported by the continued role of brokers alongside expanding delegated and direct distribution models.
Geography Analysis
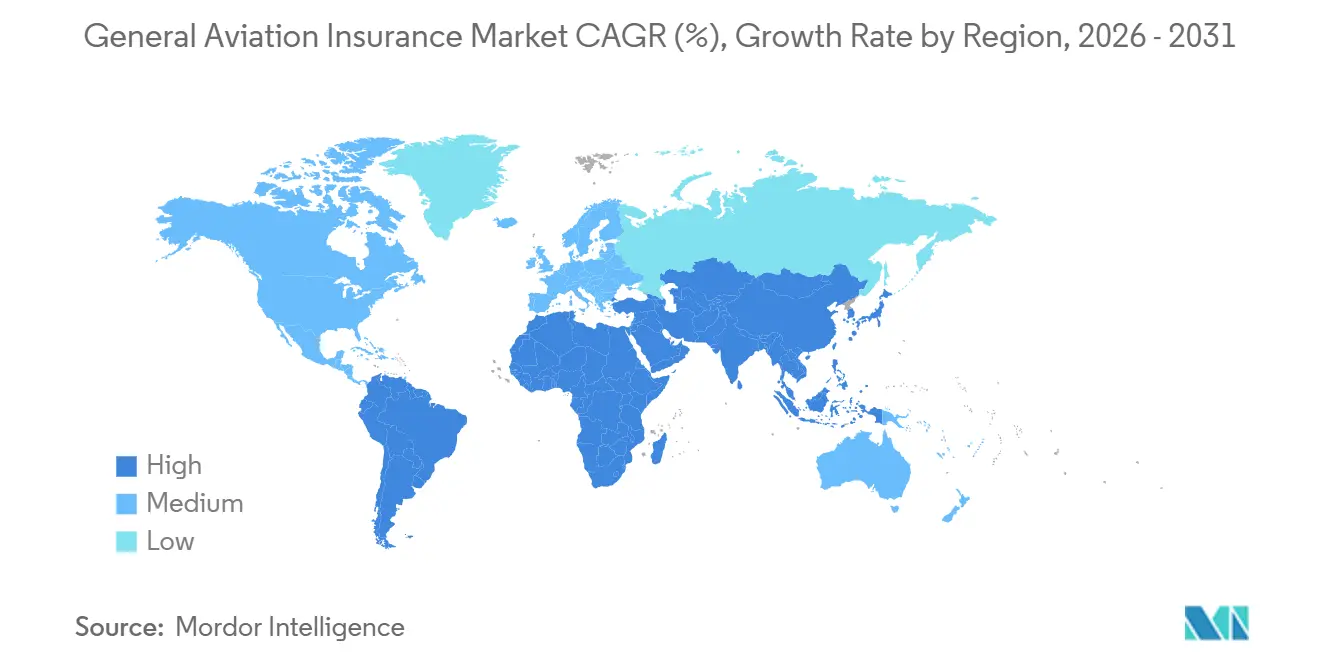
North America accounted for 79.32% of the general aviation insurance market share in 2025, making it the dominant regional market. The region benefits from the largest registered civil aircraft fleet and a mature insurance and broker network. The United States FAA registry contained 296,986 crewed civil aircraft as of July 2026. North American business aviation flight activity grew 4.3% year over year in July 2026, while fractional providers recorded 10% growth. Canada adds helicopter-intensive resource and utility operations, while Mexico is expanding its private aviation infrastructure. Europe remains the second-largest geographic bloc, supported by EASA standards and access to Lloyd’s specialist capacity. European flight activity declined 1.2% year over year in July 2026, largely in large-cabin jets, indicating a temporary period of softer activity.
The Asia-Pacific general aviation insurance market size is projected to grow at a 7.87% CAGR between 2026 and 2031, the fastest rate among geographic segments. Growth is linked to fleet expansion, a wider base of high-net-worth operators, and deeper aviation ecosystems across China, India, Southeast Asia, and Australia. Business jet departures in the region grew 4.2% in 2025, with Southeast Asia, India, and Australia showing faster growth than North Asia. China’s low-altitude economy includes general aviation, unmanned aircraft, and urban air mobility activity. The Civil Aviation Administration of China valued this economy at CNY 670 billion (USD 93 billion) in 2024 and indicated a trajectory toward CNY 3.5 trillion (USD 507 billion) by 2035. China’s revised Civil Aviation Law took effect in July 2026 and is expected to clarify third-party liability responsibilities. India requires hull and liability coverage for licensed general aviation operators, while its insurance capacity continues to rely heavily on international reinsurance markets.
South America, the Middle East, and Africa represent smaller but strategically relevant premium bases. Latin American business jet departures increased 8.9% on a trailing 12-month basis through mid-2026, led by Brazil and Colombia. Brazil combines domestic insurers with international placements, while its reliance on reinsurance limits the depth of locally available specialty capacity. The Middle East includes high-value corporate fleets that require specialist capacity. In Africa, humanitarian, agricultural, mining-support, and corporate aircraft have distinct risk profiles and smaller premium pools. African business jet departures grew 10.1% on a trailing 12-month basis through mid-2026. As operators mature and awareness of coverage needs increases, these regions can contribute more to the general aviation insurance market.

Competitive Landscape
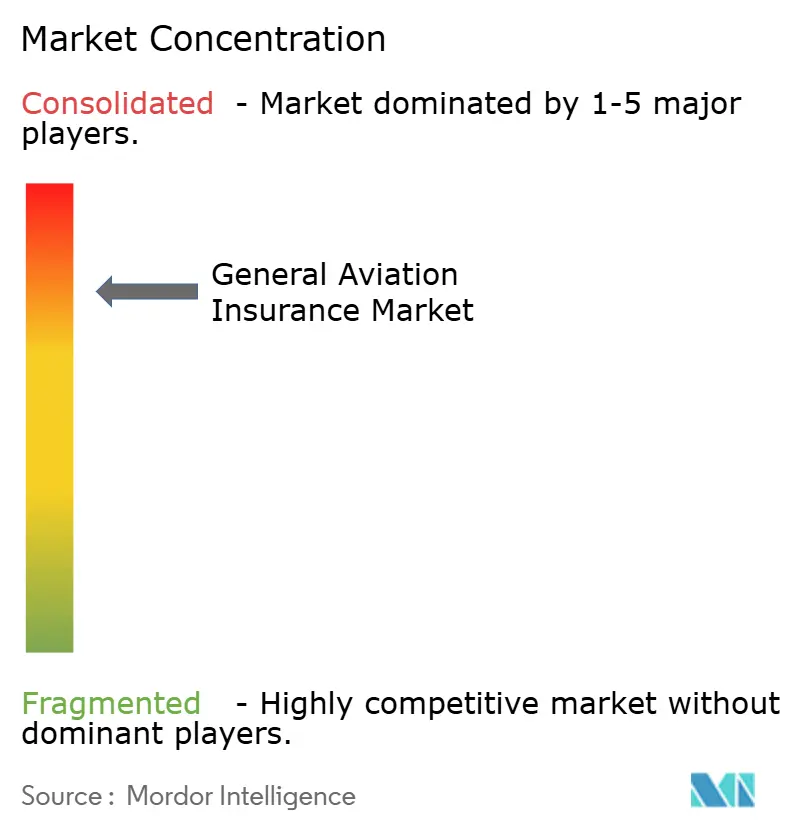
The general aviation insurance market is concentrated within a specialized global insurance field. Global Aerospace, USAIG, Avemco, and Old Republic Aerospace are established United States-focused specialists. AIG, AXA XL, Allianz Commercial, Chubb, and Berkshire Hathaway Specialty Insurance provide broader balance-sheet capacity. Munich Re and Swiss Re Corporate Solutions support capacity as aviation reinsurers. Lloyd’s participants, including Tokio Marine HCC, Sompo International, QBE, and Starr Insurance, provide syndicated capacity for tailored and high-limit risks.
Chubb completed the acquisition of Catalyst Aviation Insurance in June 2024, adding a Melbourne-based general aviation MGA that serves Australia and New Zealand. The transaction extended Chubb’s regional aviation underwriting position, where local specialist depth is limited. TITAN Aerospace Insurance acquired Ouzel Services in May 2026, adding aviation insurance expertise and client relationships across FBOs, operators, and aviation businesses. AIM and HDI expanded their program to California in January 2026, which brought the coverage program to 48 states in the United States. These moves show that carriers and managing general agents are expanding through acquisitions, capacity partnerships, and wider geographic reach.
Brokers such as Lockton, Aon, and WTW structure large corporate and commercial accounts where policy design can matter as much as premium price. Distribution innovation is creating room for routine risks to move into delegated and direct models. Data-driven products can offer more tailored pricing where pilot behavior and flight activity are available to the insurer. The potential gaps are usage-based protection for seasonal flyers and coverage for eVTOL and advanced air mobility operators.
General Aviation Insurance Industry Leaders
Global Aerospace
Starr Insurance Companies
American International Group, Inc.
Chubb Limited
Allianz Commercial
- *Disclaimer: Major Players sorted in no particular order

Recent Industry Developments
- May 2026: TITAN Aerospace Insurance (TAI), a subsidiary of TITAN Aviation Fuels, acquired Ouzel Services, an aviation-focused insurance firm based in Redding, California. The acquisition adds operational aviation expertise and client-relationship depth to TAI's platform, expanding its reach across FBOs, operators, and aviation businesses nationwide and reinforcing TAI's position as a vertically integrated aviation-services provider with insurance capabilities.
- April 2026: ForeFlight, a Jeppesen and Boeing subsidiary, launched ForeFlight Insurance Agency, a licensed insurance brokerage for GA pilots, in partnership with Old Republic Aerospace. The platform enables direct insurance purchase through a web-based tool embedded in ForeFlight's cockpit planning workflow, initially covering non-owned aircraft insurance for renters and CFIs. It planned to add owner’s insurance from multiple carriers during the summer of 2026 and held licenses in 44 states in the United States at launch.
- January 2026: Aerospace Insurance Managers (AIM) and HDI Global Insurance Company expanded their GA coverage program to California, bringing AIM's operating footprint to 48 states in the United States and covering aircraft hull and liability for small pleasure and business aircraft, hangar owners, FBOs, and flight schools through a network of more than 150 brokers and agents. HDI supports the program with an A+ rated capacity from its Talanx Group balance sheet.
- July 2025: AIM was acquired by Bishop Street Underwriters, strengthening the MGA's balance sheet and underwriting infrastructure while reinforcing its long-term trajectory as a specialist United States GA underwriting platform.


Global General Aviation Insurance Market Report Scope
| Hull and Physical Damage |
| Operating Liability |
| Specialty and Ancillary |
| Private and Recreational Owners |
| Corporate and Business Aviation Operators |
| Commercial GA Operators |
| Training, FBO and GA Service Operators |
| Government and Public-Service Operators |
| Broker-mediated Open Market |
| Delegated Authority |
| Direct |
| North America | United States |
| Canada | |
| Mexico | |
| South America | Brazil |
| Argentina | |
| Rest of South America | |
| Europe | United Kingdom |
| Germany | |
| France | |
| Italy | |
| Spain | |
| Rest of Europe | |
| Asia-Pacific | China |
| Japan | |
| India | |
| South Korea | |
| Australia | |
| Indonesia | |
| Thailand | |
| Malaysia | |
| Singapore | |
| Vietnam | |
| Rest of Asia-Pacific | |
| Middle East and Africa | Saudi Arabia |
| United Arab Emirates | |
| Turkey | |
| South Africa | |
| Egypt | |
| Rest of Middle East and Africa |
| By Product Type | Hull and Physical Damage | |
| Operating Liability | ||
| Specialty and Ancillary | ||
| By End User | Private and Recreational Owners | |
| Corporate and Business Aviation Operators | ||
| Commercial GA Operators | ||
| Training, FBO and GA Service Operators | ||
| Government and Public-Service Operators | ||
| By Distribution Channel | Broker-mediated Open Market | |
| Delegated Authority | ||
| Direct | ||
| By Geography | North America | United States |
| Canada | ||
| Mexico | ||
| South America | Brazil | |
| Argentina | ||
| Rest of South America | ||
| Europe | United Kingdom | |
| Germany | ||
| France | ||
| Italy | ||
| Spain | ||
| Rest of Europe | ||
| Asia-Pacific | China | |
| Japan | ||
| India | ||
| South Korea | ||
| Australia | ||
| Indonesia | ||
| Thailand | ||
| Malaysia | ||
| Singapore | ||
| Vietnam | ||
| Rest of Asia-Pacific | ||
| Middle East and Africa | Saudi Arabia | |
| United Arab Emirates | ||
| Turkey | ||
| South Africa | ||
| Egypt | ||
| Rest of Middle East and Africa | ||


Key Questions Answered in the Report
What is driving growth in general aviation insurance?
Fleet additions, rising aircraft values, commercial flight activity, and broader liability requirements are driving growth.
Which insurance product has the largest share?
Hull & Physical Damage leads with 49.18% of the general aviation insurance market share in 2025, supported by rising aircraft replacement values.
Which end-user group is growing fastest?
Commercial GA Operators lead growth at a 4.92% CAGR (2026–2031), driven by charter, medevac, agricultural, survey, and air-taxi operations.
Why are aviation insurance repair costs increasing?
Advanced composites, avionics, parts shortages, and limited maintenance capacity are raising repair costs and aircraft downtime.
Which distribution channel leads general aviation coverage?
Broker-mediated Open Market leads with 60.86% of premiums in 2025, while Delegated Authority is growing faster.
Which region is growing fastest?
Asia-Pacific leads at a 7.87% CAGR (2026–2031), driven by fleet expansion and growing charter, training, low-altitude, and specialized aviation activity.
Page last updated on:





