
Market Overview
| Study Period | 2021 - 2031 |
|---|---|
| Forecast Data Period | 2026 - 2031 |
| Base Year Market Size (2025) | USD 8.92 Billion |
| Market Size (2026) | USD 10.48 Billion |
| Market Size (2031) | USD 18.01 Billion |
| Growth Rate (2026 - 2031) | 11.44 % |
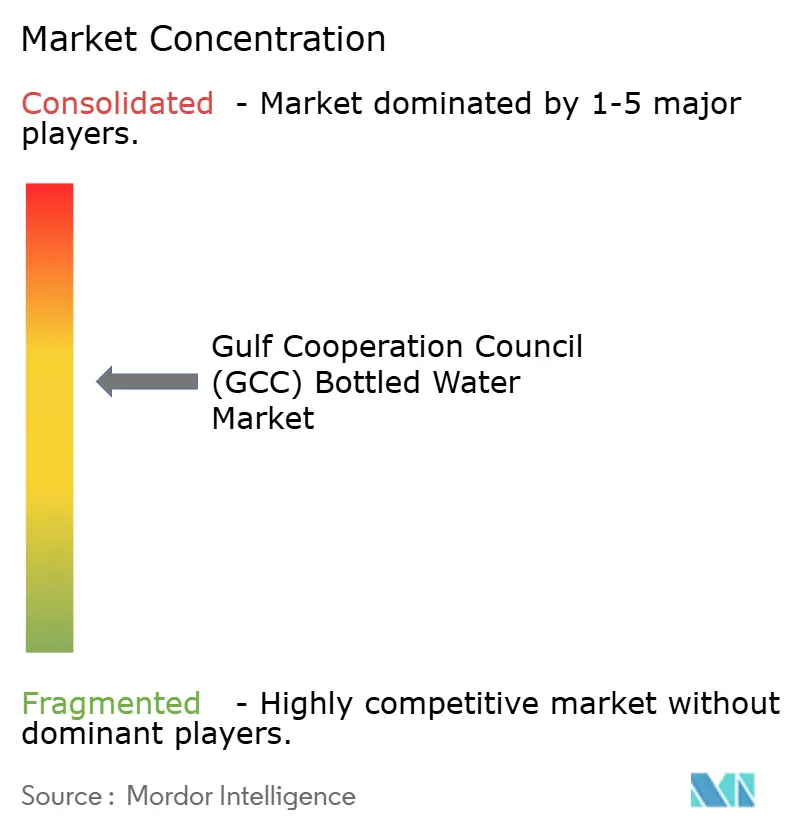
| Market Concentration | Medium |
Major Players
*Disclaimer: Major Players sorted in no particular order Image © Mordor Intelligence. Reuse requires attribution under CC BY 4.0. |
|
Gulf Cooperation Council (GCC) Bottled Water Market Analysis by Mordor Intelligence
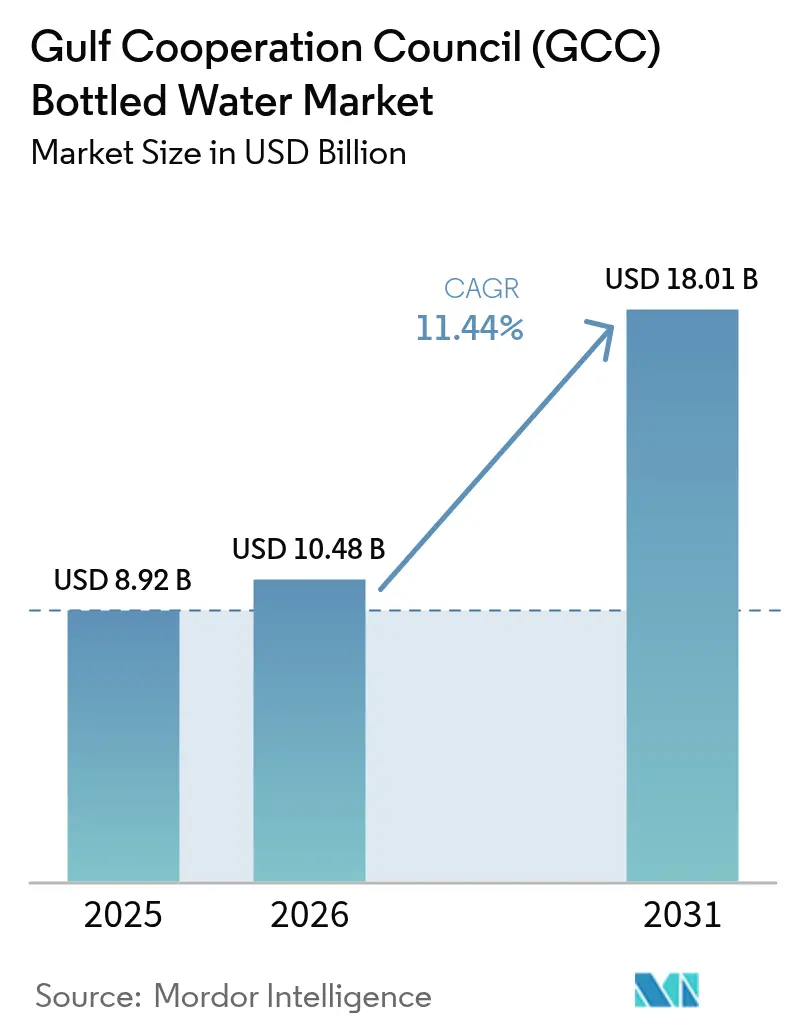
The Gulf Cooperation Council (GCC) bottled water market size is projected to grow from USD 8.92 billion in 2025 to USD 10.48 billion in 2026, reaching USD 18.01 billion by 2031, with a CAGR of 11.44% during 2026-2031. The region's high heat and humidity drive consistent hydration needs, while an extensive desalination network ensures raw water availability, even amidst fluctuations in oil-linked power prices. The market is characterized by two primary consumption segments: premium glass bottles catering to hotels and events, and high-volume PET multipacks dominating retail shelves. Seasonal demand spikes, driven by tourism activities such as the Hajj in Saudi Arabia and year-round conferences in Dubai, add to the steady residential demand, prompting bottlers to diversify product formats and pricing strategies. Sustainability requirements, including Dubai's mandate for 25% recycled content in packaging starting in 2026, are influencing packaging investments, with brands increasingly adopting rPET and aluminum alternatives.
Key Report Takeaways
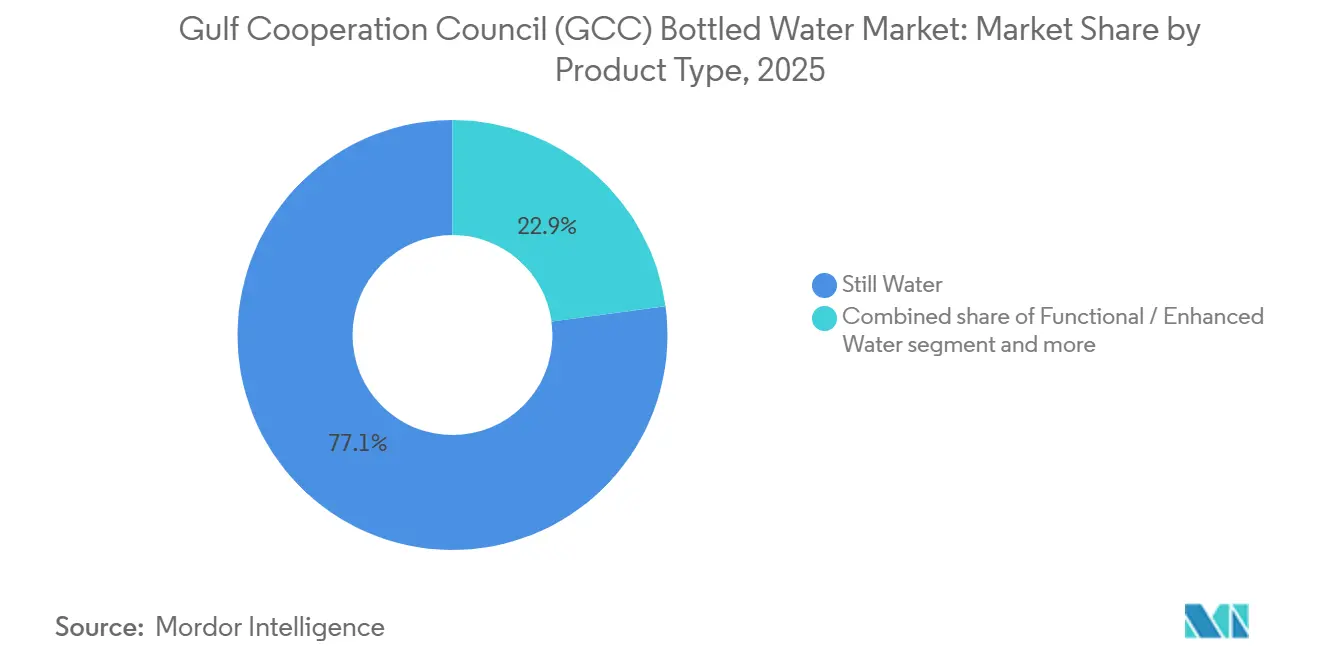
- By product type, still water held 77.14% of the Gulf Cooperation Council (GCC) bottled water market share in 2025, while functional/enhanced variants are projected to expand at a 12.59% CAGR through 2031.
- By packaging size, 331-500 mL formats captured 40.18% of 2025 revenue; the 501-1000 mL band is set to grow at an 11.55% CAGR to 2031.
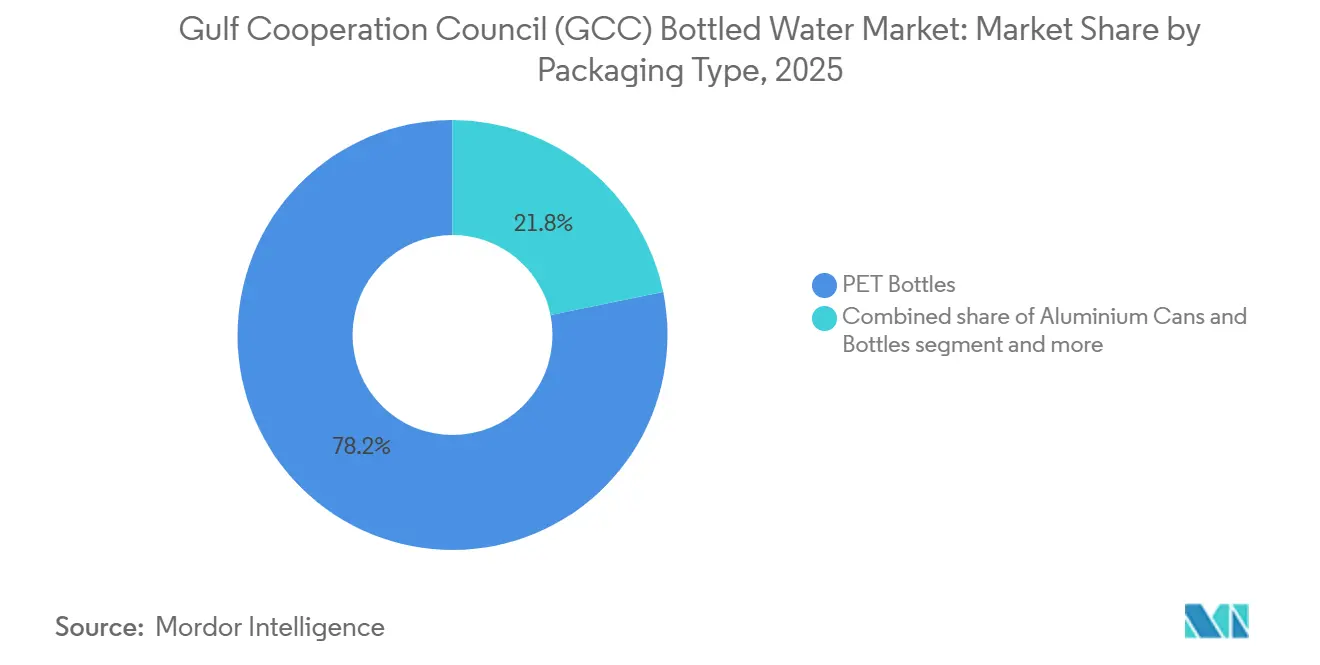
- By packaging type, PET bottles dominated with 78.21% share in 2025, whereas aluminum cans and bottles are forecast to advance at an 11.81% CAGR.
- By distribution channel, off-trade outlets accounted for 61.65% of value in 2025, but on-trade sales are tracking a 12.87% CAGR on the back of new hotels, restaurants, and entertainment venues.
- By geography, Saudi Arabia led with 33.02% of 2025 revenue, yet the United Arab Emirates is expected to post the quickest climb at an 11.71% CAGR through 2031.
Note: Market size and forecast figures in this report are generated using Mordor Intelligence’s proprietary estimation framework, updated with the latest available data and insights as of 2026.
Market Trends and Insights
Drivers Impact Analysis of Gulf Cooperation Council (GCC) Bottled Water Market*
| Driver | (~) % Impact on CAGR Forecast | Geographic Relevance | Impact Timeline |
|---|---|---|---|
| Extreme climatic conditions and year-round hydration needs | +2.8% | Gulf Cooperation Council (GCC)-wide, peak impact in Saudi Arabia, UAE, Kuwait | Long term (≥ 4 years) |
| Growth of tourism industry coupled with government initiatives | +2.4% | United Arab Emirates (Dubai, Abu Dhabi), Saudi Arabia (Riyadh, Jeddah, NEOM), Qatar | Medium term (2-4 years) |
| Rising disposable incomes across Saudi Arabia and UAE | +1.9% | Saudi Arabia, United Arab Emirates, with spillover to Qatar, Bahrain | Medium term (2-4 years) |
| Innovation in packaging and portability | +1.70% | Gulf Cooperation Council (GCC)-wide, early adoption in United Arab Emirates and Saudi Arabia | Short term (≤ 2 years) |
| E-commerce and rapid-delivery expansion | +1.50% | United Arab Emirates, Saudi Arabia, Kuwait (urban centers) | Short term (≤ 2 years) |
| Marketing and premiumisation strategies by major brands | +1.20% | Gulf Cooperation Council (GCC)-wide, concentrated in high-income urban areas | Medium term (2-4 years) |
| Source: Mordor Intelligence | |||


Extreme climatic conditions and year-round hydration needs
Ambient temperatures exceeding 45°C for 4-5 months annually across the GCC drive non-discretionary water consumption, making demand resilient to economic downturns. Per-capita bottled water consumption in the UAE and Saudi Arabia consistently ranks among the highest globally. This is influenced by outdoor work restrictions during peak heat hours and cultural preferences for chilled, sealed beverages over tap water. The World Health Organization's 2024 guidelines on hydration in extreme heat recommend a daily intake of 3-4 liters for adults engaged in moderate outdoor activity. This aligns with observed consumption increases during Ramadan and summer months, when iftar gatherings contribute to bulk purchases [1]Source: World Health Organization, who.int. While desalination-dependent municipal water supplies meet potability standards under GSO 149:2021, taste and odor concerns often lead consumers to prefer bottled water, particularly in older residential areas where distribution infrastructure predates modern corrosion-resistant piping.
Growth of the tourism industry, coupled with government initiatives
The GCC bottled water market is experiencing steady growth, driven by tourism, pilgrimage activities, and substantial government investments in water infrastructure. The region's hot climate, high tourist arrivals, and expanding hospitality sector are key factors increasing demand for safe, packaged drinking water in hotels, airports, religious sites, entertainment venues, and transport hubs. Tourism in the GCC has demonstrated strong performance. In 2024, Qatar welcomed approximately 5 million visitors and recorded nearly 10 million room nights, with 41% of visitors coming from other GCC countries, highlighting robust intra-regional travel [2]Source: Qatar Tourism, "2024: A Year of Milestones of Qatar Tourism", qatartourism.com. Similarly, the UAE is experiencing an 11% annual growth in tourism investments, projected to reach USD 20.3 billion by 2027, according to the Ministry of Economy [3]Source: Ministry of Economy and Tourism, "Local addressable Market", moet.gov.ae. The expansion of hospitality infrastructure, including hotels, resorts, serviced apartments, and entertainment attractions, is directly contributing to increased bottled water consumption across retail and on-premise channels. In addition to tourism growth, government-led initiatives in water security are enhancing supply stability and reinforcing consumer reliance on packaged drinking water. In March 2025, the GCC established a regional water security task force, supported by USD 58 billion in environmental investments made between November 2024 and March 2025, reflecting strong policy coordination. Furthermore, the Saline Water Conversion Corporation (SWCC), the world's largest producer of desalinated water, achieved daily production exceeding 11.5 million cubic meters in 2024. While desalination strengthens national water resilience, bottled water remains the preferred choice for tourists and mobile populations due to its convenience, perceived safety, and portability.
Rising disposable incomes across Saudi Arabia and UAE
Rising disposable incomes in Saudi Arabia and the UAE are driving growth in the GCC bottled water market. Increased purchasing power is influencing consumer spending patterns, leading to a preference for packaged and premium hydration products. As household incomes rise, consumers are allocating a greater portion of their budgets to health-focused, convenient, and branded consumables, including bottled water. According to data from the General Authority for Statistics (GASTAT), the average Saudi household spends approximately SAR 18,056 per month [4]Source: General Authority for Statistics (GASTAT) , "Total Kingdom population exceeds 35 million by mid-2024", stats.gov.sa. This spending level reflects improved income stability and greater consumption capacity, fostering higher per capita expenditure on packaged drinking water. In urban areas such as Riyadh, Jeddah, Dubai, and Abu Dhabi, higher-income households are increasingly choosing branded bottled water over tap water for perceived quality, safety, mineral content, and alignment with lifestyle preferences. In the UAE, the high concentration of expatriates, robust tourism inflows, and a large working professional population further boost bottled water demand. Rising disposable incomes are also fueling premiumization trends, including growing demand for imported mineral water, alkaline water, glass-packaged water, and functional variants enriched with electrolytes or vitamins. Additionally, consumers are increasingly willing to invest in sustainable packaging options and subscription-based home and office delivery services.
Innovation in packaging and portability
Innovation in packaging and portability is driving growth in the GCC bottled water market as manufacturers adapt to changing consumer preferences for convenience, sustainability, and on-the-go consumption. In a region characterized by high temperatures, urban mobility, outdoor activities, and a robust hospitality sector, packaging functionality significantly influences purchasing decisions. Consumers are increasingly opting for lightweight, easy-to-carry, and ergonomically designed bottles that cater to active lifestyles, travel, and workplace hydration. Single-serve formats, resealable caps, sports caps, and compact bottles designed to fit car cup holders and handbags are gaining popularity, particularly among younger demographics and working professionals. Additionally, bulk multi-pack formats and large-capacity containers are driving demand in households and corporate offices. Sustainability-focused packaging innovation is also influencing market dynamics. Regional governments are promoting environmental responsibility, encouraging manufacturers to use recyclable PET, biodegradable materials, reduced plastic content, and lightweight bottle designs to lower carbon footprints. Brands are introducing recycle-ready labels, tethered caps, and eco-friendly packaging claims to meet regulatory requirements and address growing consumer awareness of environmental impact.
Restraints Impact Analysis of Gulf Cooperation Council (GCC) Bottled Water Market*
| Restraint | (~) % Impact on CAGR Forecast | Geographic Relevance | Impact Timeline |
|---|---|---|---|
| Plastic-waste legislation raising compliance costs | -1.60% | United Arab Emirates (Abu Dhabi, Dubai), Saudi Arabia, Bahrain | Short term (≤ 2 years) |
| Market saturation with many local and international brands | -1.30% | Gulf Cooperation Council (GCC)-wide, most acute in the United Arab Emirates and Saudi Arabia | Medium term (2-4 years) |
| High energy cost of desalination bottling | -0.90% | Gulf Cooperation Council (GCC)-wide, peak impact in Saudi Arabia, Oman | Medium term (2-4 years) |
| Water scarcity and resource limitations | -0.70% | Gulf Cooperation Council (GCC)-wide, long-term structural constraint | Long term (≥ 4 years) |
| Source: Mordor Intelligence | |||
Plastic-waste legislation raising compliance costs
Abu Dhabi's 2025 Water Quality Regulations introduce extended producer responsibility requirements, obligating bottlers to fund collection and recycling infrastructure. This is expected to increase compliance costs by an estimated USD 0.02-0.04 per unit, which may disproportionately impact smaller regional players that lack economies of scale. Additionally, the GCC Standardization Organization's draft standard on contaminant limits for mineral water, anticipated to be finalized by late 2026, will impose stricter limits on heavy metals such as lead, arsenic, and mercury. This will require bottlers to upgrade their filtration and testing protocols to avoid product recalls and potential reputational harm. Furthermore, Dubai Municipality's 2024 technical guidelines for plastic waste management establish minimum recycled content thresholds, starting at 25% by 2026 and increasing to 50% by 2030. Compliance with these guidelines will necessitate capital investments in rPET sourcing and quality assurance systems, with non-compliance penalties reaching up to AED 500,000 (USD 136,000) per violation.
Market saturation with many local and international brands
GCC holds significant bottled water brands that compete in GCC retail markets, leading to fragmented consumer attention and reduced shelf space allocations in hypermarkets. Key players such as Nestlé, Danone, and PepsiCo utilize volume rebates to secure premium eye-level shelf positioning. Price competition has intensified in the economy segment, with promotional discounts like buy-2-get-1-free and bundle offers reducing gross margins for value-tier SKUs to 12-15%, compared to 18-20% during 2020-2022. New entrants face significant barriers, as established brands maintain long-term supply agreements with major retailers, operate proprietary distribution fleets, and benefit from decades of brand recognition. As a result, niche opportunities are largely confined to ultra-premium imports or functional variants targeting specific health claims, such as alkaline pH, added electrolytes, or vitamin infusion.
*Our forecasts treat driver/restraint impacts as directional, not additive. The impact forecasts reflect baseline growth, mix effects, and variable interactions.
Gulf Cooperation Council (GCC) Bottled Water Market Segment Analysis
By Product Type:
Functional Variants Gain Health-Conscious TractionStill water accounted for 77.14% of the projected 2025 revenue, driven by its role in meeting everyday hydration needs and its popularity for bulk purchasing in homes, offices, and events. However, functional/enhanced water is expected to grow at a compound annual growth rate (CAGR) of 12.59% through 2031, as urban professionals and fitness enthusiasts increasingly seek products offering electrolyte replenishment, vitamin fortification, and alkaline pH levels, which are marketed as performance and wellness enhancers. Sparkling water maintains a niche market share of 5-7%, limited by cultural preferences for non-carbonated beverages and restricted shelf space in convenience stores. Despite these constraints, premium imports such as Perrier and San Pellegrino continue to have a presence in hospitality channels.
Flavored and infused water, featuring natural fruit essences and herbal extracts, is capturing a 3-4% market share by appealing to younger consumers aged 18-30, who often perceive plain water as uninteresting and prefer sensory variety without the calorie content of sugary soft drinks. Brands are increasingly fortifying water with magnesium, zinc, and B vitamins, positioning these products at a 20-40% price premium over standard still water. These variants are primarily targeted at distribution channels such as gyms, yoga studios, and corporate wellness programs.


By Packaging Size:
Mid-Range Formats Drive ConvenienceThe 331-500 mL segment accounted for a 40.18% market share in 2025, driven by its single-serve convenience in retail, foodservice, and vending channels. Meanwhile, the 501-1000 mL format is experiencing growth at a CAGR of 11.55%, as consumers prioritize cost efficiency per liter for activities such as gym sessions, office use, and car cup holders, where larger volumes help reduce repurchase frequency. Packaging sizes under 330 mL, such as 250 mL and 200 mL, cater to specific needs like children's lunchboxes and airline services, maintaining a stable market share of 8-10%. The 1001-2000 mL range, including 1.5 L bottles, dominates home consumption with a 22-25% share, preferred for refrigerator storage and family meals.
The 2001-5000 mL segment, comprising 5 L and 6 L jugs, along with formats above 5001 mL, such as 10 L and 18.9 L water cooler bottles, collectively represent 15-18% of the market volume. These larger formats are primarily used in home and office delivery subscriptions, offering 30-40% cost savings compared to single-serve options. Packaging size preferences vary across distribution channels. Convenience stores and petrol stations tend to favor 330-500 mL formats for impulse purchases, while hypermarkets focus on 1.5 L bottles and multipacks for planned shopping trips. Online platforms show higher penetration of bulk formats, such as 5 L and 6 L, as delivery logistics mitigate the challenges of handling heavier products.
By Packaging Type:
Aluminum Gains as Sustainability Narrative StrengthensPET bottles accounted for 78.21% of the projected 2025 volume, driven by advantages such as lightweight logistics, shatter resistance, and an established recycling infrastructure. However, aluminum cans and bottles are growing at a CAGR of 11.81%, as brands capitalize on aluminum's ability to be recycled indefinitely without quality degradation and its premium positioning, which supports price premiums of 15-25% over comparable PET formats. Glass bottles, despite holding only a 4-6% market share due to their weight, fragility, and higher transport costs, dominate the ultra-premium segment (USD 3-6 per liter) in fine dining and luxury retail, where visual appeal and perceived purity outweigh logistical challenges. Other packaging formats, including pouches, cartons, and refillable containers, maintain a marginal 2-3% share. However, refillable glass and stainless steel bottles are gaining popularity within corporate sustainability initiatives and among eco-conscious consumers.
Agthia's August 2025 introduction of 100% rPET bottles for its Al Ain Water brand marks a significant milestone, showcasing the technical and economic feasibility of closed-loop recycling at a GCC scale, supported by municipal collection systems and consumer return incentives. The renewed interest in aluminum packaging is partly attributed to Ball Corporation's regional capacity expansions and partly to Gen Z and millennial consumers, who associate metal packaging with environmental responsibility. This perception is further reinforced by social media campaigns emphasizing the impact of ocean plastic pollution.
By Distribution Channels:
On-Trade Accelerates with Hospitality ExpansionOff-trade channels, including supermarkets, hypermarkets, convenience stores, and online retail, accounted for 61.65% of projected 2025 sales. This growth is attributed to household bulk purchases and the increasing presence of neighborhood grocers in residential areas. However, on-trade channels are experiencing a compound annual growth rate (CAGR) of 12.87%, driven by the expansion of Saudi Arabia's entertainment sector (cinemas, theme parks, concert venues) and the UAE's hospitality industry (hotels, restaurants, cafes) under tourism-focused growth strategies.
On-trade channels benefit from significant margin advantages. Hotels and restaurants typically mark up bottled water prices by 200-400% compared to retail, resulting in higher per-unit profitability that compensates for lower sales volumes. Additionally, captive environments such as airports, stadiums, and amusement parks reduce competitive pricing pressures. The home and office delivery subsegment, categorized under off-trade but operationally distinct, relies on subscription models and bulk packaging formats (5 L, 10 L, 18.9 L) to secure recurring revenue and lower customer acquisition costs. However, this subsegment faces high churn rates as price-sensitive corporate clients frequently switch suppliers to achieve marginal cost savings.
Geography Analysis
Saudi Arabia Cooperation Council (GCC) Bottled Water Market
Saudi Arabia accounted for 33.02% of 2025 revenue, supported by a population exceeding 36 million, the annual influx of 13 million Hajj and Umrah pilgrims, and Vision 2030 infrastructure initiatives such as NEOM, the Red Sea Project, and Qiddiya. These developments are driving growth in the hospitality and entertainment sectors. Bottled water consumption in the Kingdom is segmented into two distinct patterns: urban centers like Riyadh, Jeddah, and Dammam are witnessing premiumization trends with increasing demand for functional and imported brands, while rural and lower-income areas remain price-sensitive, favoring economy multipacks from local producers such as Berain, Hana, and Nova.
United Arab Emirates Cooperation Council (GCC) Bottled Water Market
The United Arab Emirates, while holding a smaller share of the 2025 market, is projected to achieve the fastest geographic CAGR of 11.71% through 2031. This growth is driven by Dubai's 20.2 million overnight visitors in 2024, Abu Dhabi's regulatory push for sustainability, including a 100% rPET mandate by 2028, and a high-income expatriate population, which constitutes 88% of residents and shows a preference for premium and functional water variants. Additionally, Dubai's quick-commerce platforms, such as Talabat, Noon Minutes, and Careem Quik, enable bottled water delivery within 15-30 minutes across urban areas. This ecosystem facilitates impulse purchases through app-based transactions and allows brands to test new SKUs with minimal reliance on retail shelf space.
GCC Cooperation Council (GCC) Bottled Water Market
Kuwait, Qatar, Bahrain, and Oman collectively contribute 25-30% of GCC bottled water revenue, each influenced by unique demand factors. In Kuwait, extreme summer temperatures, often exceeding 50°C, and high per-capita income drive strong consumption levels. However, market saturation and limited population growth, currently at 4.3 million, restrict further expansion. Qatar's post-2022 FIFA World Cup infrastructure, including stadiums, metro systems, and convention centers, has institutionalized high-volume procurement for public events. This has created a captive on-trade demand, favoring bottlers with ISO certifications and efficient logistics capabilities.
Regulatory Landscape
Bottled water in the GCC is overseen through a combination of regional standards and country-level licensing and conformity schemes. A key regional reference is GSO 1025:2014 for bottled drinking water, which sets quality and safety parameters, including a 10 ppb maximum for bromate, and provides guidance that suppliers typically follow on labeling and composition claims.
At the national level, Saudi Arabia requires multi-agency approvals for bottled water establishments, with the Saudi Food and Drug Authority (SFDA) handling licensing and compliance. This includes prerequisites such as site approval and water source approval through relevant ministries. In the UAE, conformity routes include mandatory quality mark requirements such as the Emirates Quality Mark (EQM) issued by the Ministry of Industry and Advanced Technology (MoIAT), which acts as a market-access checkpoint for both imported and locally produced bottled water.
Competitive Landscape
The GCC bottled water market demonstrates moderate concentration. Multinational corporations such as Nestlé, Danone, PepsiCo, and Coca-Cola collectively hold an estimated 35-40% market share. Regional players, including Agthia, Masafi, Mai Dubai, Berain, and Almarai, also maintain a significant presence. Smaller competitors focus on price differentiation, localized distribution through neighborhood grocers and independent retailers, and cultural alignment through Arabic branding and Ramadan-themed packaging.
Opportunities for growth are concentrated in three key areas: ultra-premium functional waters targeting fitness and wellness communities, subscription-based home and office delivery services featuring IoT-enabled coolers with auto-reordering capabilities, and refillable glass bottle systems aimed at corporate campuses and hotels seeking to reduce single-use plastic waste. Technology adoption varies across the market. Leading bottlers utilize route optimization software and demand forecasting algorithms to minimize logistics costs, whereas mid-tier players often rely on manual distribution planning and reactive inventory management.
Compliance with GSO standards, such as GSO 149:2021 for unbottled water and GSO 2233:2021 for nutritional labeling, is a baseline requirement. However, leading companies are pursuing additional voluntary certifications, including ISO 22000 for food safety and NSF/ANSI 60 for drinking water additives, to gain a competitive edge in on-trade channels where procurement managers prioritize risk mitigation over cost. The market's moderate concentration indicates that economies of scale in distribution and brand recognition provide competitive advantages. Nevertheless, regional players leverage their local expertise, such as understanding Ramadan consumption patterns, preferred packaging sizes, and retail credit terms, to maintain their market share against multinational competitors.
Gulf Cooperation Council (GCC) Bottled Water Industry Leaders
-
PepsiCo Inc.
-
Nestlé S.A
-
Agthia Group PJSC
-
Danone S.A
-
Masafi LLC
- *Disclaimer: Major Players sorted in no particular order
Gulf Cooperation Council (GCC) Bottled Water Market Companies Covered in this Report
- Nestle SA
- Agthia Group PJSC (Al Ain Water)
- Masafi LLC
- PepsiCo Inc. (Aquafina)
- Danone SA
- Mai Dubai LLC
- Hana Food Industries Co. (Hana Water)
- Berain Water
- Nova Water
- Almarai Company
- Crystal Mineral Water and Refreshments LLC
- Al-Qassim Water
- Al Furat Drinking Water LLC
- Al-Rawdatain Water Bottling Co.
- Rayyan Mineral Water Company (Qatar)
- Al Jomaih Water and Beverages
- New Technology Bottling Company KSCC
- The Coca-Cola Company
- Highland Spring Limited
- The Wonderful Company LLC

Market Opportunities and Future Outlook
Sustainability-led packaging transitions and on-premise circular bottling solutions are creating gaps across GCC channels, especially where hospitality buyers can swap single-use PET with glass and alternative formats at point of consumption. BE WTR and Rosewood Abu Dhabi launched an automated circular bottling facility (BiG 1500) for on-site still and sparkling water in February 2025, and Hilton Abu Dhabi Yas Island opened a fully automated in-house bottling plant using reusable glass bottles in October 2025. Both cases reflect procurement-side demand for closed-loop supply models in premium on-trade settings.
Stricter conformity mark expectations and recycled-content requirements are also pushing investment in compliant packaging and quality systems. This supports rPET supply chains, testing capability upgrades, and brands that can document compliance across markets. Oman introduced Administrative Decision No. 1 of 2026 mandating the Omani Quality Mark for bottled drinking and mineral water, effective March 15, 2026, with a correction period ending July 30, 2026, while Dubai Municipality guidelines set minimum recycled-content thresholds starting at 25% from 2026. Product innovation is reinforcing premium niches as well, including MaHawa's January 2026 announcement of hydrogen water in reusable aluminum bottles at Gulfood 2026, aligned with the region-wide push toward differentiated functional hydration and non-PET formats.
Recent Industry Developments in Gulf Cooperation Council (GCC) Bottled Water Market
- May 2026: Agthia Group highlighted a 2026 operational agenda focused on strengthening regional manufacturing and distribution capabilities. The emphasis on capacity and route-to-market execution supports higher service levels across retail and the home and office delivery ecosystem, where delivery density and reliability shape supplier switching.
- March 2025: Agthia Group completed the acquisition of Riviere Mineral Water Desalination and Filling Factory LLC in the UAE, expanding its presence in home and office services bottled water. The acquisition increased control over recurring-delivery volumes and last-mile execution, strengthening defensibility against smaller HOS-focused competitors.
- February 2025: Masafi launched 100% recycled PET (rPET) bottles for its mountain water products. The shift positions the brand within UAE sustainability priorities and raises the bar on packaging claims as recycled-content requirements and consumer scrutiny intensify.


Gulf Cooperation Council (GCC) Bottled Water Market Report Scope and Research Methodology
Market Definition and Coverage
For this methodology, the market covers packaged drinking water sold in sealed containers across GCC countries, measured in value at manufacturer and importer realization, and counted across retail and on-trade sales plus home and office delivery.
Scope exclusions: We exclude bulk municipal tanker water, in-home filtration devices and cartridges, and beverage categories such as soft drinks, juices, and sports drinks.
Segments Covered in This Report
-
By Product Type
- Still Water
- Sparkling Water
- Functional / Enhanced Water
- Flavored / Infused Water
-
By Packaging Size
- *Less than 330 mL
- *331 mL-500 mL
- *501 mL-1000 mL
- *1001 mL- 2000 mL
- *2001 mL- 5000 mL
- *More than 5001 mL
-
By Packaging Type
- PET Bottles
- Glass Bottles
- Aluminium Cans and Bottles
- Others
-
By Distribution Channels
- On-Trade
-
Off-Trade
- Supermarkets/Hypermarkets
- Convenience/Grocery Stores
- Online Retail Stores
- Other Distribution Channels
- Home and Office Space
-
By Geography
- United Arab Emirates
- Saudi Arabia
- Kuwait
- Qatar
- Bahrain
- Oman
Data Sources, Market Sizing, and Validation
Desk Research
Desk research started by mapping bottled water demand fundamentals that are visible in public data, then converting those signals into market-relevant inputs. We referenced UN Comtrade trade statistics for packaged water, FAOSTAT and World Bank population and macro series, WHO and UNICEF JMP water access indicators, and GCC country statistics portals and customs releases where they are available.
We also reviewed company annual reports, investor presentations, press coverage from business media, and announcements tied to packaging rules and recycling targets, since those can shift pack mix and pricing. For some countries, shipment-level import and export data and a news and financials subscription were used to sanity-check importer activity and event-driven spikes. The sources listed above are illustrative only, and we checked other public documents and datasets to collect, validate, and clarify inputs.
Primary Interviews and Surveys
Primary work focused on filling pricing and channel gaps that desk sources do not fully explain across GCC, especially for returnable formats, bulk multipacks, and home and office delivery. We spoke with a balanced set of stakeholders such as brand owners, bottlers, distributors, large retailers, on-trade buyers, and packaging and logistics participants across the main GCC markets. The goal was to confirm volume direction, track ASP movements, and verify pack mix shifts. Outputs from these conversations were used to validate assumptions, tighten conversion factors, and align the model to what is actually selling in market.
Distribution of primary research fieldwork respondents
| Company type | Respondent position |
|---|---|
| Top tier: 36% | CXOs: 14% |
| Mid tier: 44% | Functional/Unit leaders: 33% |
| Smaller Players: 20% | Managers: 53% |
Market-Sizing & Forecasting
The model begins with a top-down demand pool build that links bottled water consumption to GCC population, visitor inflows, and channel intensity, and then converts that pool into value using observed price bands. Results are corroborated with selective bottom-up approximations, mainly supplier and importer roll-ups in key countries, plus channel checks on high-velocity SKUs, and then adjusted when the two views diverge.
Key inputs used to keep the market practical to size included per capita bottled water intake by country, tourism and pilgrimage seasonality that lifts short-term demand, import share versus local bottling capacity, pack format mix (small single-serve, multipacks, large packs, and returnable options), and average selling price progression based on packaging material and retail versus HORECA. When direct data points were not available, missing splits were bridged using interview ranges and cross-country comparisons inside the GCC, followed by a second pass to ensure the final totals still match observable trade and retail signals.
Forecasting relied mostly on scenario analysis supported by a light multivariate view, where population growth, visitor recovery paths, pack mix shifts, and packaging compliance costs were stress-tested into conservative and base cases. Assumptions were finalized after the primary feedback showed agreement on the direction and magnitude of price and mix movements.
Data Validation & Update Cycle
Outputs were checked through multiple steps, starting with reconciling country totals against independent signals such as import trends, reported production capacity moves, and channel-level price observations. Large variances triggered a re-check of unit conversions, currency timing, and pack mix, followed by a targeted re-contact with interviewees when the mismatch remained.
Before sign-off, the model and narratives go through an analyst review that looks for outliers, inconsistent growth paths, and country totals that do not align with known demand events, for example peak travel months. The report is refreshed annually, and interim updates are made when material developments occur, such as packaging rule changes or major capacity additions. Before delivery, we run a fresh pass on key inputs so clients receive the latest updated view.
Mordor Intelligence's Gcc Bottled Water Market Size Versus Other Published Estimates
Published numbers for GCC bottled water often vary because firms do not treat the same boundary as the market, and they also differ on how they convert liters into value. Even when geography is consistent, choices around channel coverage, pack mix assumptions, and currency timing can shift the reported size.
Import and local production signals, paired with channel price checks across supermarkets, convenience outlets, and home and office delivery, are what keep Mordor Intelligence tied to a packaged-water demand pool rather than a broader beverages tally. The spread in external figures typically comes from folding in adjacent drink categories, using aggressive premiumization uplifts without validating pack format shares, or mixing retail value with manufacturer realization in the same total.
Benchmark comparison
| Source | Market Size | Gaps in Research Methodology |
|---|---|---|
| Mordor Intelligence | USD 10.48 B (2026) | |
| Regional Consultancy A | USD 6.83 B (2026) | The estimate appears to lean heavily on a narrower realized-price set and may undercount higher-priced channels like on-trade and home and office delivery, which reduces the value total even if liters are similar. |
| Trade Journal B | USD 25.70 B (2024) | The number is materially higher than trade and pricing signals would suggest for bottled water alone, pointing to a broader scope, retail-value stacking, or inclusion of adjacent packaged beverages that inflate the market. |
The comparison shows that scope and price logic drive most of the gap, not small differences in growth rates. By keeping the count limited to bottled water sold in sealed packs and by cross-checking liters and prices against observable trade and channel evidence, the final figure stays traceable to repeatable steps each year.


Key Questions Answered in the Report
How large is the Gulf Cooperation Council (GCC) bottled water market in 2026?
The Gulf Cooperation Council (GCC) bottled water market size is USD 10.48 billion in 2026 and is forecast to hit USD 18.01 billion by 2031.
What is the expected growth rate for the Gulf Cooperation Council (GCC) bottled water market from 2026 to 2031?
Aggregate values are projected to expand at an 11.44% CAGR over the period.
Which country leads sales within the Gulf?
Saudi Arabia accounts for 33.02% of 2025 revenue owing to its scale and pilgrimage influx.
Which product segment is growing fastest?
Functional/enhanced Water variants are slated for a 12.59% CAGR as health consciousness rises.
Page last updated on:


 Your data is secure and never sold or shared.


