Market Overview
| Study Period | 2021 - 2031 |
|---|---|
| Forecast Data Period | 2026 - 2031 |
| Historical Data Period | 2021 - 2024 |
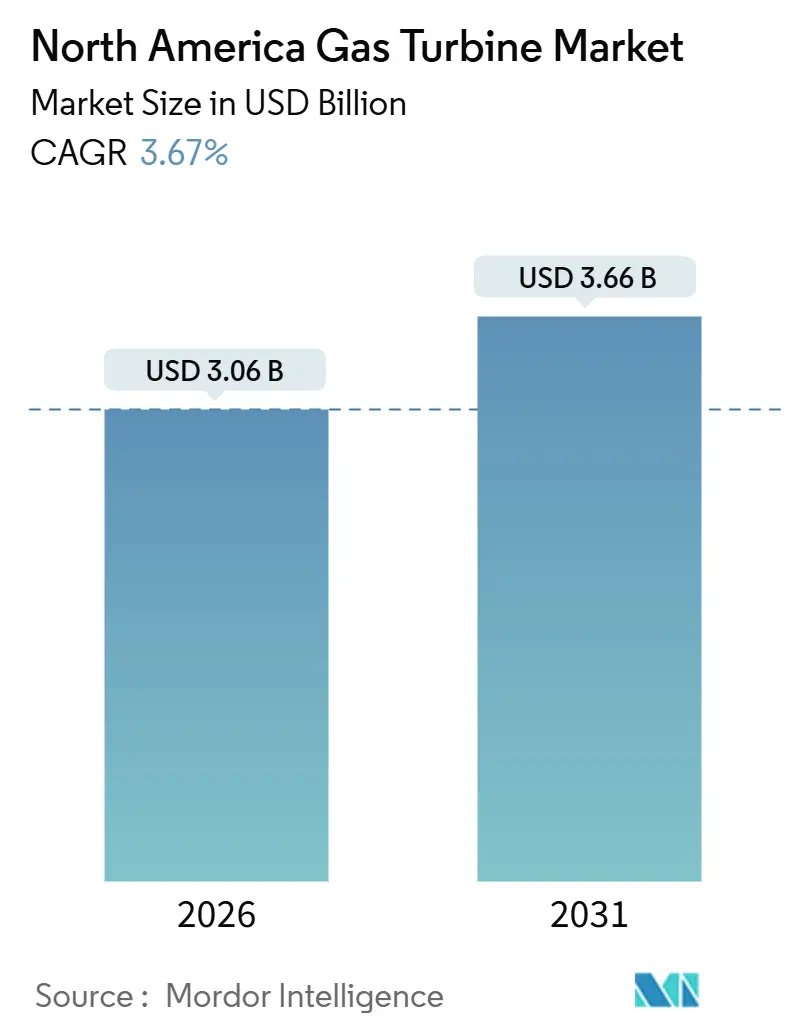
| Market Size (2026) | USD 3.06 Billion |
| Market Size (2031) | USD 3.66 Billion |
| Growth Rate (2026 - 2031) | 3.67% CAGR |
| Market Concentration | High |
Major Players *Disclaimer: Major Players sorted in no particular order Image © Mordor Intelligence. Reuse requires attribution under CC BY 4.0. | |
North America Gas Turbine Market Analysis by Mordor Intelligence
The North America Gas Turbine Market size is estimated at USD 3.06 billion in 2026, and is expected to reach USD 3.66 billion by 2031, at a CAGR of 3.67% during the forecast period (2026-2031).
Utilities and independent power producers are pivoting from baseload deployment toward fast-ramping roles that backstop renewable variability and protect data-center uptime. Ample shale-gas output keeps Henry Hub prices near USD 3.22 per MMBtu in 2025, preserving a decisive fuel-cost edge over liquid alternatives and sustaining combined-cycle dispatch economics.[1]U.S. Energy Information Administration, “Short-Term Energy Outlook,” eia.gov Section 45V hydrogen production tax credits under the Inflation Reduction Act are already pulling forward orders for turbines certified to co-fire hydrogen blends.[2]U.S. Department of Energy, “Inflation Reduction Act Guidebook,” energy.gov Meanwhile, battery-storage price declines compel OEMs to sharpen peaker economics, integrate digital-twin analytics, and certify cycle efficiency improvements. Finally, supply-chain bottlenecks for large nickel-alloy forgings have lengthened delivery schedules for heavy-duty frames, prompting buyers to favor modular aeroderivative models that can be installed in phases.
Key Report Takeaways
- By operating cycle, combined-cycle units held 71.1% of the North America gas turbine market share in 2025, while simple-cycle configurations are advancing at a 5.3% CAGR through 2031.
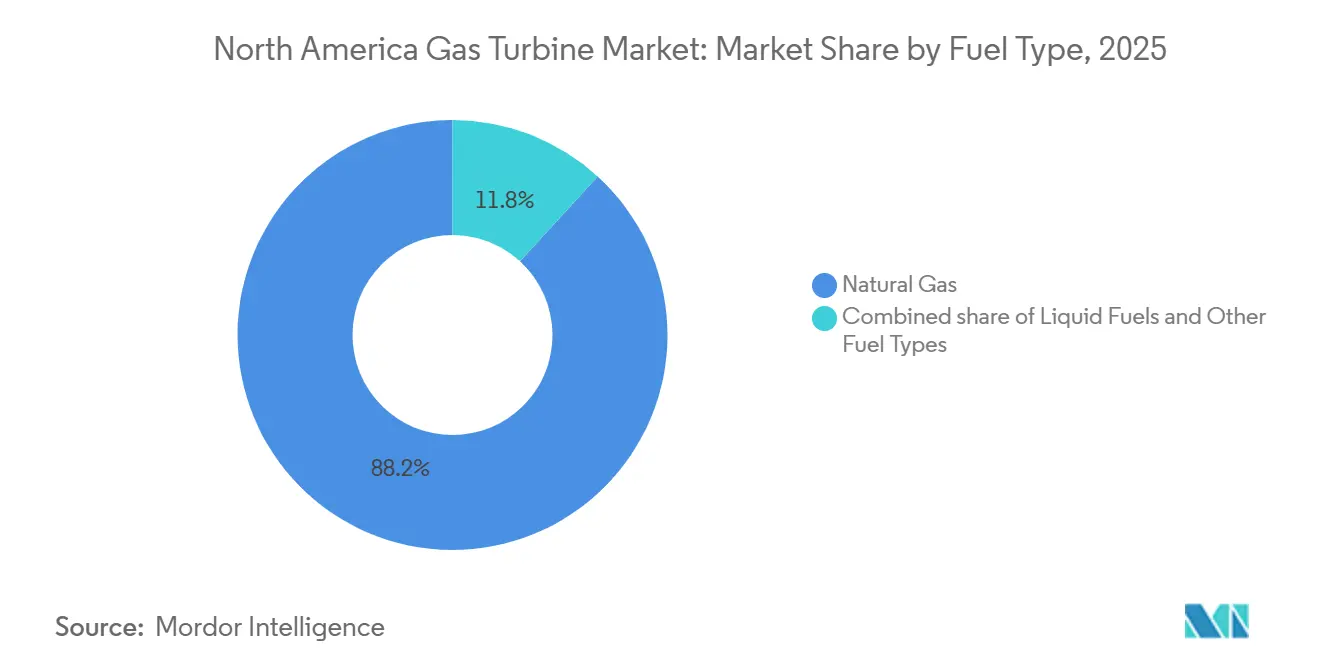
- By fuel type, natural gas accounted for 88.2% of the North America gas turbine market size in 2025; alternative fuels led by hydrogen and biogas are forecast to expand at a 9.9% CAGR to 2031.
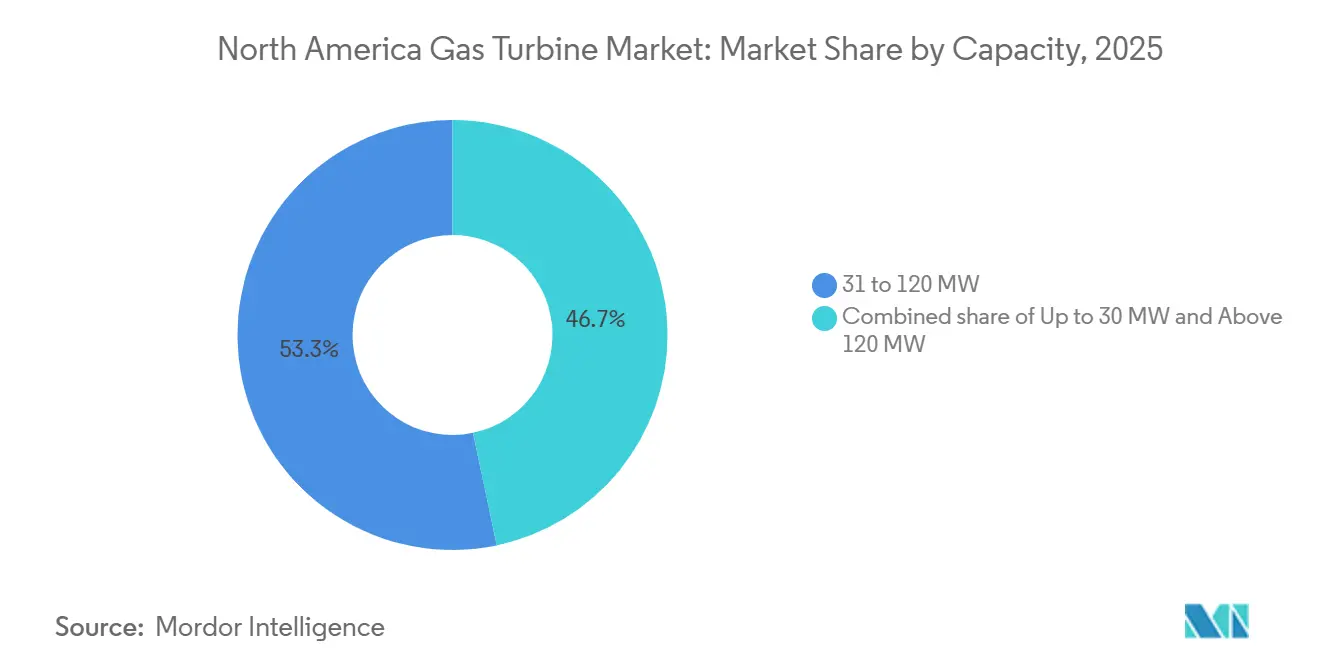
- By capacity bracket, turbines rated 31–120 MW captured 53.3% of the North America gas turbine market in 2025, whereas units above 120 MW are projected to grow at a 4.5% CAGR through 2031.
- By end user, the power-generation sector commanded 62.9% revenue share in 2025; oil-and-gas applications are on course for a 5.0% CAGR through 2031.
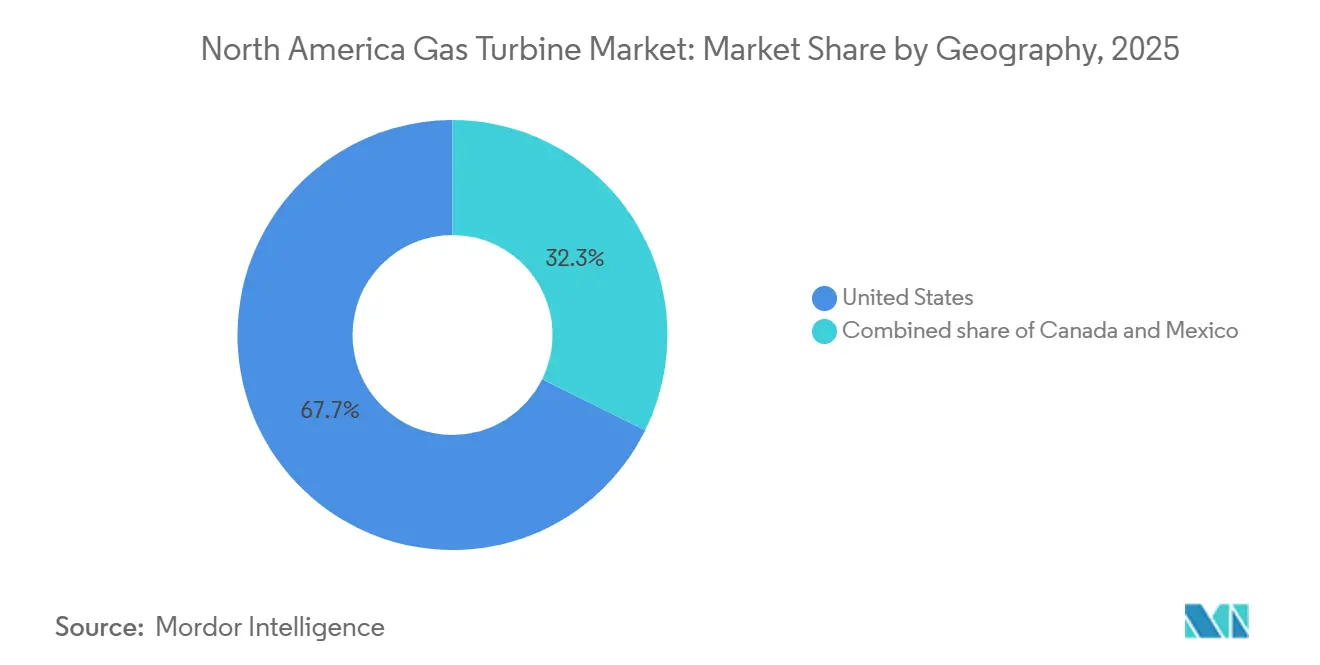
- By geography, the United States dominated with a 67.7% share in 2025 and is forecast to rise at a 4.1% CAGR to 2031.
- GE Vernova, Siemens Energy, and Mitsubishi Power together controlled more than half of utility-scale orders in 2025, underscoring a concentrated supplier landscape.
Note: Market size and forecast figures in this report are generated using Mordor Intelligence’s proprietary estimation framework, updated with the latest available data and insights as of January 2026.
North America Gas Turbine Market Trends and Insights
Drivers Impact Analysis*
| Driver | (~) % Impact on CAGR Forecast | Geographic Relevance | Impact Timeline |
|---|---|---|---|
| Abundant shale-gas supply keeps fuel costs low | +0.6% | United States basins with spillover to Canada and Mexico | Long term (≥ 4 years) |
| Rising renewable penetration drives fast-ramping capacity needs | +0.9% | United States ERCOT, CAISO, SPP; Canada Alberta, Ontario | Medium term (2-4 years) |
| Coal-to-gas fleet replacement programs | +0.7% | U.S. Southeast and Midwest | Medium term (2-4 years) |
| Data-center and AI load surges create local capacity deficits | +0.8% | U.S. Virginia, Texas, Oregon, Arizona | Short term (≤ 2 years) |
| IRA hydrogen-tax-credit pull-through for H₂-ready turbines | +0.5% | U.S. Gulf Coast and Intermountain West hubs | Long term (≥ 4 years) |
| Predictive-analytics upgrades lowering lifetime LCOE | +0.4% | North America, led by U.S. and Canada | Medium term (2-4 years) |
| Source: Mordor Intelligence | |||
Rising Renewable Penetration Drives Fast-Ramping Capacity Needs
Cumulative U.S. wind and solar capacity reached 295 GW in 2024, compelling grid operators to maintain generators that can ramp from zero to full load in under 10 minutes. ERCOT’s operating-reserve demand curve prices scarcity events above USD 5,000 per MWh, rewarding aeroderivative turbines such as GE Vernova’s LM2500XPRESS that can achieve full output within five minutes.[3]Electric Reliability Council of Texas, “Operating Reserve Demand Curve Methodology,” ercot.com PJM Interconnection applies a similar valuation to fast-start resources after its 2025/2026 auction reforms lifted clearing prices to USD 269.92 per MW-day.[4]PJM Interconnection, “2025/2026 Base Residual Auction Report,” pjm.com The International Energy Agency projects that grids surpassing 40% renewable penetration need dispatchable reserves equal to at least 15% of peak load, a threshold already exceeded in California. Consequently, simple-cycle and open-cycle installations, despite lower thermal efficiency, gain prominence because their capital cost per MW of peaking capacity is 30%-40% below combined-cycle equivalents.
Data-Center & AI Load Surges Creating Local Capacity Deficits
Hyperscale and AI-training facilities consumed roughly 50 TWh in 2024 and continue to grow, often outpacing local grid headroom. A December 2024 order for 29 GE Vernova LM2500XPRESS units illustrates how data-center operators procure on-site fast-start generation to guarantee uptime. Loudoun County, Virginia, saw utilities file for 2.3 GW of new interconnection capacity in 2024, much of it earmarked for gas-fired combined heat and power that can island during disturbances. Similar procurement patterns appear in Texas, where real-time price volatility encourages behind-the-meter deployment. The shift toward modular arrays values dual-fuel capability, black-start readiness, and rapid installation over absolute heat-rate performance.
IRA Hydrogen-Tax-Credit Pull-Through for H₂-Ready Turbines
Final Section 45V regulations published in December 2024 offer up to USD 3.00 per kg incentive for near-zero-carbon hydrogen, accelerating orders for turbines certified to co-fire or eventually burn 100% hydrogen. The 485-MW Long Ridge Energy Terminal is already hydrogen-capable, while Utah’s Intermountain Power Project is installing Mitsubishi Power M501JAC turbines designed for 30% hydrogen blending. GE Vernova and Siemens Energy both list multiple heavy-duty frames with 100% hydrogen certificates. Temporal-matching rules that link electrolyzer output to turbine demand favor projects co-located with renewables or nuclear plants, nudging geographic clustering in hydrogen hubs.
Predictive-Analytics Upgrades Lowering Lifetime LCOE
OEMs embed digital-twin platforms to cut forced outages and extend hot-gas-path intervals. GE Vernova’s suite predicts component degradation six to eight weeks ahead, enabling maintenance when demand is low and avoiding capacity penalties. Siemens Energy’s Omnivise analytics report 20%-30% reductions in unplanned downtime, translating into meaningful margin protection for peaking units compensated through capacity markets. IEEE 2025 case studies show predictive maintenance lowers O&M costs by USD 2-4 per MWh, reducing lifetime LCOE by up to 8% when compounded. As regulators scrutinize cost recovery, software-enabled reliability is becoming a decisive bid parameter.
Restraints Impact Analysis*
| Restraint | (~) % Impact on CAGR Forecast | Geographic Relevance | Impact Timeline |
|---|---|---|---|
| Falling battery-storage costs undermine new gas peakers | -0.5% | U.S. California, Texas, New York | Short term (≤ 2 years) |
| Tightening net-zero regulations on fossil assets | -0.4% | U.S. California, New York, Washington; Canada British Columbia, Quebec | Long term (≥ 4 years) |
| Supply-chain bottlenecks for forgings and nickel alloys | -0.3% | Global, acute in U.S. and Canada | Medium term (2-4 years) |
| ERCOT & PJM capacity-price volatility | -0.2% | U.S. Texas and Mid-Atlantic | Short term (≤ 2 years) |
| Source: Mordor Intelligence | |||
Falling Battery-Storage Costs Undermine New Gas Peakers
Utility-scale lithium-ion prices continue to decline and are expected to cross the cost-parity threshold with 4-hour simple-cycle turbines in 2026, according to U.S. Department of Energy trend analyses. California ISO has already contracted more than 6 GW of storage, displacing planned gas peakers, and ERCOT added 4.2 GW in 2024. Batteries offer instantaneous response and qualify for investment tax credits, eroding the earnings outlook for assets that rely primarily on scarcity pricing. Yet limitations in duration and grid-forming capability still leave a reliability niche for synchronous gas turbines, especially for events exceeding four hours or requiring inertial support. OEMs counter by marketing hydrogen-ready burners and carbon-capture retrofit kits to differentiate against storage.
Tightening Net-Zero Regulations on Fossil Assets
California’s Senate Bill 100 mandates 100% clean electricity by 2045, effectively shortening the economic life of new gas turbines unless they can demonstrate renewable-fuel or carbon-capture pathways. New York’s Climate Leadership and Community Protection Act sets a similar trajectory, adding emissions-credit costs that raise dispatch break-even prices. Washington’s cap-and-invest program imposes allowance costs expected to add USD 10-15 per MWh by 2030. Canada’s proposed Clean Electricity Regulations require net-zero generation by 2035, intensifying the risk of stranded assets. Developers in policy-aggressive regions increasingly demand shorter payback periods and flexible designs that can pivot to hydrogen or carbon capture.
*Our forecasts treat driver/restraint impacts as directional, not additive. The impact forecasts reflect baseline growth, mix effects, and variable interactions.
Segment Analysis
By Capacity: Mid-Range Dominance Meets Large-Turbine Acceleration
North America gas turbine market size for the 31–120 MW class reached USD 1.58 billion in 2025, representing a 53.3% share. The segment thrives on standardized engineering, compressed lead times, and suitability for both grid-connected and behind-the-meter customers. Industrial manufacturers adopt mid-range units for combined heat and power, while midstream gas operators use similar frames for compression stations. A second-order effect is risk mitigation: buyers can phase in capacity, limiting exposure to fuel-price swings and policy shifts. Maintenance intervals are shorter than those for microturbines, yet rebuilding costs remain manageable relative to heavy-duty frames.
Units above 120 MW, though smaller in count, are recording a 4.5% CAGR through 2031, a rate likely to lift their North America gas turbine market share to just under 30% by the end of the forecast horizon. Coal-to-gas replacement projects in the U.S. Southeast and Midwest predominantly adopt this size class because individual plants must replicate gigawatt-scale retiring baseload capacity. Duke Energy’s 2024 coal retirements in the Carolinas triggered procurement of new GE Vernova HA-class turbines rated at 826 MW in combined-cycle configuration. Supply-chain stress for nickel-based superalloys exposes this class to longer lead times, prompting OEMs to vertically integrate forging capacity.


By Operating Cycle: Efficiency Versus Flexibility Trade-Offs
Combined-cycle configurations commanded 71.1% of 2025 revenue, equal to USD 2.11 billion, confirming the cost-of-fuel advantage derived from 60%-plus thermal efficiency. The operating cycle’s higher capital intensity is offset by strong capacity factors under moderate gas prices, making it the preferred choice for utilities with mid-merit dispatch profiles. Recent builds pair gas turbines with supplementary duct firing and advanced HRSG designs, extracting incremental megawatts when reserve margins tighten.
Simple-cycle and open-cycle installations grow faster, at a 5.3% CAGR, even though their efficiency penalty can exceed 15 percentage points. The North America gas turbine market size for simple-cycle peakers is forecast to touch USD 1.25 billion by 2031 as capacity markets revise valuation for ramp speed and start reliability. ERCOT’s 2024 scarcity events highlighted revenue upside for assets capable of reaching nameplate in under ten minutes. Grid operators now procure portfolios that segment by duty cycle, combined-cycle for shoulder periods, and simple-cycle for peaks, rather than forcing one technology to cover all load shapes.
By Fuel Type: Natural Gas Lock-In and the Hydrogen Frontier
Natural gas remained dominant with an 88.2% share of 2025 installations, yet alternative fuels registered the steepest trajectory. For example, the Intermountain Power Project will commission hydrogen-capable M501JAC turbines in 2026, blending 30% hydrogen by volume. Pipeline infrastructure and transparent hub pricing lend natural gas an enduring appeal, but developers in California and the U.S. Northeast increasingly seek purchase agreements that allow cost pass-through for hydrogen or renewable natural gas.
The “other fuels” category, hydrogen, biogas, and synthetic e-fuels, grows at a 9.9% CAGR, a pace that could elevate its North America gas turbine market size to above USD 400 million by 2031. Federal tax incentives offset the high energy-density penalty of hydrogen, while landfill-gas-to-energy schemes underpin early biogas uptake. Combustor redesign to mitigate hydrogen flame speed and NOx formation is the central R&D challenge; GE Vernova’s 2024 patent for a hydrogen-optimized liner addresses exactly this issue.
By End-User Industry: Power-Generation Core, Oil-&-Gas Uptick
Power-generation entities consumed 62.9% of 2025 shipments, equivalent to USD 1.87 billion. Coal retirements remain the headline driver, especially where existing transmission and cooling infrastructure can be repurposed for combined-cycle replacements. Dispatchable reserve requirements tied to renewable penetration also support gas-turbine adoption among vertically integrated utilities.
Oil-and-gas operators demonstrate quicker expansion, clocking a 5.0% CAGR through 2031. LNG export terminals on the U.S. Gulf Coast need aeroderivative turbines for cryogenic compression, while Permian Basin midstream lines require incremental capacity as daily crude output exceeds 6 million barrels. Offshore platforms in the Gulf of Mexico replace aging turbines with more efficient models to reduce fuel burn and emissions, aligning with tightening air-quality rules.
Geography Analysis
The United States accounted for 67.7% of 2025 revenue and is forecast to expand at 4.1% CAGR to 2031 as coal-to-gas conversions and data-center load booms compound. PJM’s 2025/2026 auction clearing price of USD 269.92 per MW-day materially improves project viability for peaking assets. ERCOT’s revised reserve demand curve similarly elevates the business case for fast-start aeroderivative fleets. Section 45V tax credits steer hydrogen-ready orders toward Gulf Coast hubs, while shale-gas production exceeding 108.5 bcf/d preserves the fuel-cost advantage.
Canada’s market hinges on Alberta’s gradual coal phase-out and Ontario’s need for peaking capacity during multi-year nuclear refurbishments. The federal Clean Electricity Regulations propose net-zero fossil generation by 2035, compressing asset payback windows and persuading developers to negotiate carbon-capture readiness clauses. Provinces rich in hydro resources, notably British Columbia and Quebec, rely on gas turbines mainly for industrial cogeneration and remote microgrids.
Mexico remains driven by Comisión Federal de Electricidad procurement, especially combined-cycle plants in the northeast that benefit from new cross-border pipelines such as the Sur de Texas-Tuxpan system. Imports of U.S. pipeline gas, historically 20%-30% cheaper than domestic supply, anchor the North America gas turbine market growth in the region. Policy shifts have slowed private investment, but CFE’s 2024-2030 plan still includes roughly 3 GW of new gas-fired capacity to displace costlier fuel-oil units.
Competitive Landscape
Utility-scale segments of the North America gas turbine market display high concentration: GE Vernova, Siemens Energy, and Mitsubishi Power collectively capture well above 50% of heavy-duty frame orders, leveraging dense installed bases, bundled long-term service contracts, and readiness certifications for hydrogen blends. GE Vernova’s January 2025 multi-year agreement covering more than 40 HA-class turbines embeds its Digital Power Plant analytics, raising customer switching costs.
Distributed generation and oil-and-gas niches are more contestable. Solar Turbines excels with mid-range aeroderivatives, while Capstone Green Energy delivers sub-megawatt microturbines that can island critical loads. Wärtsilä Energy’s gas-engine plants, recently contracted for 400 MW across Texas, target ERCOT scarcity pricing events with flexible, modular blocks.
Technology differentiation intensifies. Siemens Energy’s Omnivise platform claims up to 30% downtime reduction, and Mitsubishi Power’s M501JAC arrives factory-certified for 30% hydrogen, giving it a first-mover edge in Section 45V projects. Patent filings in additive manufacturing of hot-gas-path components and advanced combustion controls suggest ongoing R&D investment aimed at mitigating supply-chain constraints and increasing fuel flexibility.
North America Gas Turbine Industry Leaders
GE Vernova
Siemens Energy
Mitsubishi Power Americas
Solar Turbines (Caterpillar)
Capstone Green Energy
- *Disclaimer: Major Players sorted in no particular order


Recent Industry Developments
- January 2026: New gas-fired power plants, along with other stationary gas turbines, are now subject to final nitrogen oxide (NOx) emission standards set by the U.S. Environmental Protection Agency (EPA).
- January 2026: Kiewit Corp. has been selected as the lead contractor for a new natural gas-fired combined-cycle power plant in Monroe County, Georgia, by a prominent electric cooperative in the southeastern U.S. Kiewit will take on the role of engineering, procurement, and construction (EPC) partner for the 1,425-MW Smarr Combined-Cycle facility located in Forsyth.
- August 2024: Ontario's Atura Power has tapped Mitsubishi Power Americas for an advanced gas turbine, bolstering the Napanee Generating Station Expansion project. The M501JAC hydrogen-ready combustion turbine, set to operate in a simple cycle, will inject an extra 430 MW of electricity, addressing Ontario's surging energy demands.


North America Gas Turbine Market Report Scope
Gas turbines, often referred to as continuous-flow internal combustion engines, transform the chemical energy of fuel into mechanical energy. They achieve this by heating and expanding gases, such as air, to spin turbine blades. This process generates shaft power, which can be harnessed for various applications, including electricity generation, jet propulsion in aircraft, or powering industrial equipment like pumps. The operation involves compressing air, blending it with fuel, igniting the mixture, and utilizing the resultant high-energy gas to rotate the turbine.
The North America gas turbine market is segmented by capacity, operating cycle, fuel type, end-user industry, and geography. By capacity, the market is segmented into up to 30 MW, 31 to 120 MW, and above 120 MW. By operating cycle, the market is segmented into combined cycle, simple/open cycle, and cogeneration/CHP. By fuel type, the market is segmented into natural gas, liquid fuels, and other fuel types. By end-user industry, the market is segmented into power, oil and gas, and other end-user industries. The report also covers the market size and forecasts for the North America gas turbine market across major countries in the region. The market size and forecasts for each segment are based on revenue ( USD).
By Capacity
| Up to 30 MW |
| 31 to 120 MW |
| Above 120 MW |
By Operating Cycle
| Combined Cycle |
| Simple/Open Cycle |
| Cogeneration/CHP |
By Fuel Type
| Natural Gas |
| Liquid Fuels (Diesel/Kerosene/LPG) |
| Other Fuel Types (Hydrogen, Biogas) |
By End-User Industry
| Power |
| Oil and Gas |
| Other End-user Industries (Industrial, Marine) |
By Geography
| United States |
| Canada |
| Mexico |
| By Capacity | Up to 30 MW |
| 31 to 120 MW | |
| Above 120 MW | |
| By Operating Cycle | Combined Cycle |
| Simple/Open Cycle | |
| Cogeneration/CHP | |
| By Fuel Type | Natural Gas |
| Liquid Fuels (Diesel/Kerosene/LPG) | |
| Other Fuel Types (Hydrogen, Biogas) | |
| By End-User Industry | Power |
| Oil and Gas | |
| Other End-user Industries (Industrial, Marine) | |
| By Geography | United States |
| Canada | |
| Mexico |


Key Questions Answered in the Report
How large is the north america gas turbine market today?
The market reached USD 3.06 billion in 2026 and is expected to climb to USD 3.66 billion by 2031.
What is driving new gas-turbine orders despite renewable growth?
Fast-ramping capability to stabilize grids with high wind and solar penetration, low natural-gas prices, and Section 45V hydrogen incentives all support new installations.
Which capacity class is expanding the fastest?
Turbines rated above 120 MW are growing at a 4.5% CAGR as utilities replace retiring coal units with large combined-cycle plants.
How are data-center loads shaping demand?
Hyperscale facilities increasingly procure on-site aeroderivative turbines to secure uninterrupted power and avoid interconnection delays.
Will batteries replace peaker turbines?
Four-hour lithium-ion systems are already displacing some simple-cycle projects, but longer-duration needs and grid-forming inertia keep opportunities open for gas turbines.
Which suppliers lead the regional market?
GE Vernova, Siemens Energy, and Mitsubishi Power dominate utility-scale orders, while Solar Turbines, Capstone Green Energy, and Wärtsilä compete in distributed segments.
Page last updated on:


