
Market Overview
| Study Period | 2021 - 2031 |
|---|---|
| Market Size (2026) | USD 17.53 Billion |
| Market Size (2031) | USD 22.24 Billion |
| Growth Rate (2026 - 2031) | 4.88 % |
| Fastest Growing Market | Asia Pacific |
| Largest Market | Asia Pacific |
| Market Concentration | Medium |
Major Players *Disclaimer: Major Players sorted in no particular order Image © Mordor Intelligence. Reuse requires attribution under CC BY 4.0. | |
Gas Turbine MRO Market Analysis by Mordor Intelligence
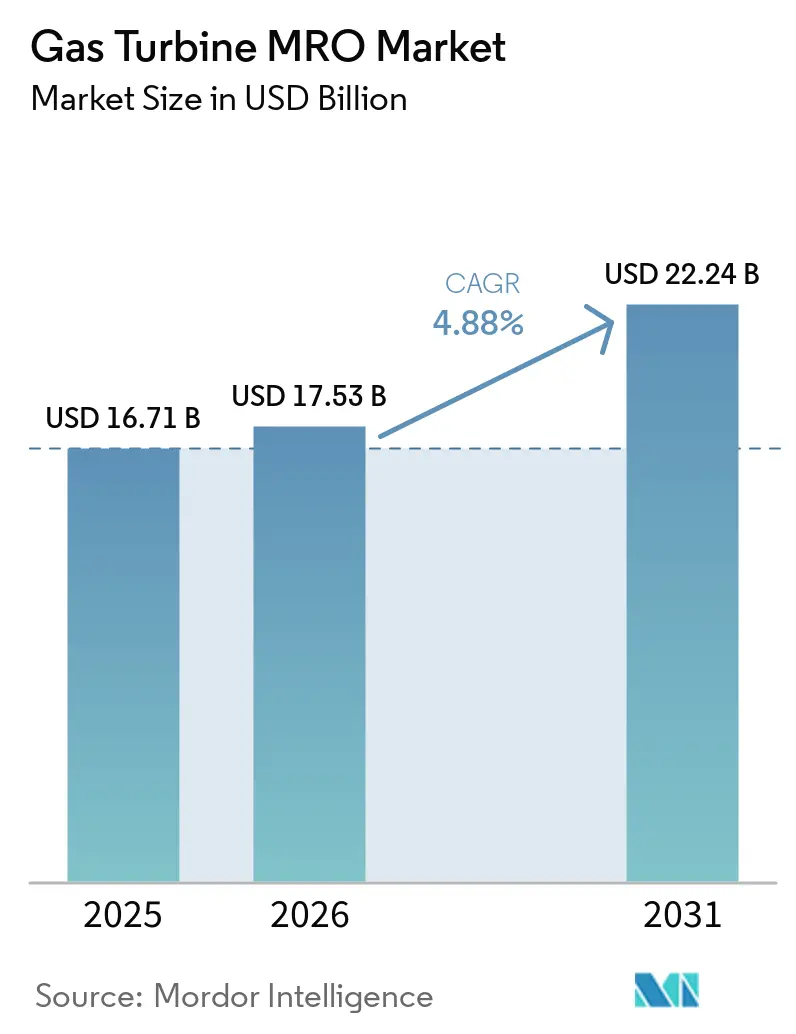
The Gas Turbine MRO market size is expected to grow from USD 16.71 billion in 2025 to USD 17.53 billion in 2026 and is forecast to reach USD 22.24 billion by 2031 at 4.88% CAGR over 2026-2031.
Demand resilience stems from three converging factors: escalating maintenance needs for an aging global fleet, the premium placed on lifecycle efficiency as gas turbines transition from baseload to cycling duty, and an unrelenting push toward hydrogen-ready retrofits that extend useful life while meeting decarbonization mandates. The gas turbine MRO market also thrives on the Asia-Pacific region’s outsized installed base and aggressive combined-cycle build-out, a trend that magnifies parts consumption, outage frequency, and the uptake of digital diagnostics. At the same time, supply-chain constraints for super-alloy hot-gas-path parts reward service providers with nimble sourcing strategies and repair know-how. Competitive dynamics now hinge less on who manufactures the hardware and more on who can bundle AI-enabled monitoring, field-service agility, and long-term service agreements that guarantee availability at predictable cost.
Key Report Takeaways
- By capacity, turbines rated above 120 MW held 57.60% of the gas turbine MRO market share in 2025, while the 31-120 MW class is projected to post a 6.45% CAGR through 2031.
- By turbine cycle, combined-cycle units accounted for 85.20% of the 2025 gas turbine MRO market size; open/simple-cycle systems are forecast to expand at a 5.65% CAGR to 2031.
- By service type, maintenance activities generated 54.00% of 2025 revenue, whereas overhaul services are expected to advance at a 5.95% CAGR through 2031.
- By end user, power generation represented 69.10% of 2025 demand, while industrial and other sectors are on track for a 9.10% CAGR to 2031.
- By geography, Asia-Pacific commanded 51.50% of 2025 revenue and is projected to expand at a 5.12% CAGR through 2031.
Note: Market size and forecast figures in this report are generated using Mordor Intelligence’s proprietary estimation framework, updated with the latest available data and insights as of 2026.
Market Trends and Insights
Drivers Impact Analysis of Gas Turbine MRO Market*
| Driver | (~) % Impact on CAGR Forecast | Geographic Relevance | Impact Timeline |
|---|---|---|---|
| Aging global fleet driving scheduled major overhauls | +1.2% | North America, Europe | Medium term (2-4 years) |
| OEM long-term service agreements ensuring aftermarket revenues | +0.8% | Asia-Pacific, North America | Long term (≥ 4 years) |
| Expansion of combined-cycle plants in emerging economies | +1.0% | Asia-Pacific, MEA, South America | Medium term (2-4 years) |
| Data-center peaker demand for aeroderivative turbines | +0.6% | North America, EU, Asia-Pacific | Short term (≤ 2 years) |
| Hydrogen-ready retrofit programs prompting part upgrades | +0.4% | Europe, North America, Japan | Long term (≥ 4 years) |
| AI-enabled predictive maintenance boosting service uptake | +0.5% | Developed markets worldwide | Medium term (2-4 years) |
| Source: Mordor Intelligence | |||
Aging Global Fleet Driving Scheduled Major Overhauls
Roughly 7,000 GE Vernova turbines worldwide are entering rotor-life extension windows, triggering an upsurge in hot-gas-path component swaps, control upgrades, and metallurgy overhauls that can add 10-15 years of service life. F-class units installed during the 1990s boom in North America and Europe now operate at higher capacity factors to support renewable variability, further accelerating wear. Service specialists such as EthosEnergy deploy bespoke rotor rebuild programs for GE B/E/F and legacy Westinghouse frames, underscoring the depth of niche expertise required.[1] Owners are increasingly treating overhauls as capital investments tied to performance uprates, rather than routine expenses, because incremental efficiency gains reduce fuel burn and emissions over the remaining life cycle.
OEM Long-Term Service Agreements Ensuring Aftermarket Revenues
LTSAs have matured into 15 to 25-year, outcome-based pacts that bundle parts supply, labor, digital monitoring, and performance guarantees—representing about 70% of GE Vernova’s gas-power revenue stream.[2] EthosEnergy’s multi-year master agreement with EDF, covering 20 heavy-duty turbines across France and its territories, illustrates how utilities hedge against cost volatility while OEMs lock in predictable cash flow. Escalator clauses keyed to local inflation protect margins, and cloud-based analytics enable early-fault detection, which trims outage duration by 20-30%.
Expansion of Combined-Cycle Plants in Emerging Economies
Emerging-market utilities are favoring combined-cycle efficiency, driving a surge in new plants—and future service demand—in the Asia-Pacific and Latin America regions. Brazil’s 1.6 GW Portocem project, powered by Mitsubishi Power M501JAC machines under long-term service cover, typifies the scale. Frequent cycling to balance renewables places extra thermal stress on HRSGs and steam turbines, raising MRO intensity per operating hour. OEMs respond by stationing parts depots and field engineers in regional hubs such as Kuala Lumpur and São Paulo to meet four-hour mobilization targets.
Data-Center Peaker Demand for Aeroderivative Turbines
Hyperscale data centers now contract aeroderivative LM-series and NovaLT16 sets as on-site peakers, capable of achieving black-start within eight minutes, which boosts equipment starts by an order of magnitude relative to baseload duty. MRO strategies shift from calendar-based maintenance to start-count metrics, resulting in shorter inspection intervals and modular swap-out kits stored on-premise. Providers guarantee 99.9% availability through round-the-clock remote diagnostics, commanding premium pricing that offsets lower annual firing hours.
Restraints Impact Analysis of Gas Turbine MRO Market*
| Restraint | (~) % Impact on CAGR Forecast | Geographic Relevance | Impact Timeline |
|---|---|---|---|
| Gas-price volatility lowering run-hours between services | -0.7% | Europe, Asia-Pacific | Short term (≤ 2 years) |
| Renewable-energy displacement of baseload gas generation | -0.9% | Europe, North America | Medium term (2-4 years) |
| Global shortage of certified maintenance technicians | -0.5% | North America, Europe | Long term (≥ 4 years) |
| Regulatory ambiguity on H₂ blends delaying overhaul plans | -0.3% | Europe, North America, Japan | Medium term (2-4 years) |
| Source: Mordor Intelligence | |||
Gas-Price Volatility Lowering Run-Hours Between Services
European hubs saw TTF gas spike above EUR 100/MWh in 2024, prompting operators to curtail gas-fired output and stretch maintenance intervals, which reduced immediate parts demand and deferred revenue for service firms.[3] MRO providers now include flexible volume clauses in contracts to mitigate utilization fluctuations.
Renewable-Energy Displacement of Baseload Gas Generation
As wind-solar penetration climbs past 40% in markets like California, gas turbines run fewer hours yet face more starts, leading to shorter component life not reflected in traditional hour-based schedules. Providers must recalibrate wear-rate models and negotiate compensation for cycling-related stress.
*Our forecasts treat driver/restraint impacts as directional, not additive. The impact forecasts reflect baseline growth, mix effects, and variable interactions.
Gas Turbine MRO Market Segment Analysis
By Capacity:
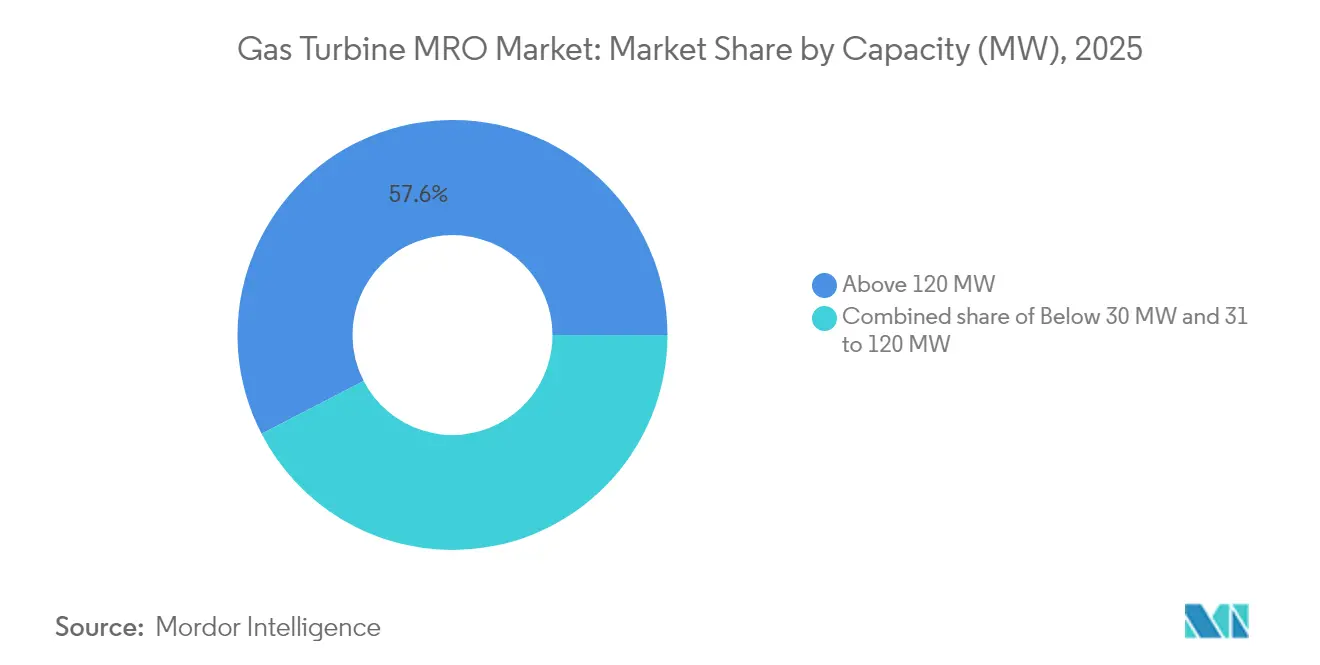
Utility-Scale Dominance, Mid-Range MomentumLarge-frame machines, those above 120 MW, generated 57.60% of the 2025 gas turbine MRO market revenue, buoyed by complex hot-gas-path work scopes and extensive outage durations that can exceed 50 days. These units anchor combined-cycle blocks where every percentage-point efficiency gain drives significant fuel savings, encouraging owners to adopt cutting-edge coatings and tip-clearance upgrades during overhauls. The 31-120 MW bracket, however, is the fastest-growing segment at a 6.45% CAGR, driven by data-center peaker additions and industrial cogeneration projects that favor aeroderivative agility. Here, modular swap strategies trim downtime to under 10 days, but higher start counts inflate inspection frequency.
Smaller turbines, those below 30 MW, support off-grid mining, remote oil and gas facilities, and backup duties for hospitals and airports. Although the individual overhaul value is lower, fleet numbers generate meaningful aggregate work. MRO providers differentiate via containerized mobile workshops that execute hot-section exchanges on-site, sidestepping costly crane logistics.

By Turbine Cycle:
Combined-Cycle Complexity, Simple-Cycle SpeedCombined-cycle equipment captured 85.20% of the 2025 gas turbine MRO market share, reflecting both its extensive fleet footprint and the multi-module architecture that increases the number of serviceable assets per plant. HRSG tube inspection, steam-turbine valve refurbishment, and condenser cleaning compound outage scope extend beyond the gas-turbine core, often requiring synchronized project management to avoid schedule slips. Service providers thus package end-to-end solutions, coordinating subcontractors for electrical, mechanical, and balance-of-plant tasks under single-point accountability.
Open/simple-cycle sets, expanding at a 5.65% CAGR, provide grid-balancing peaking power and industrial back-up where quick-start capability outweighs efficiency. Their straightforward architecture lowers outage duration, but high-impact starts worsen thermal stress. MRO contracts, therefore, emphasize start-based life management and frequent borescopic inspections.
By Service Type:
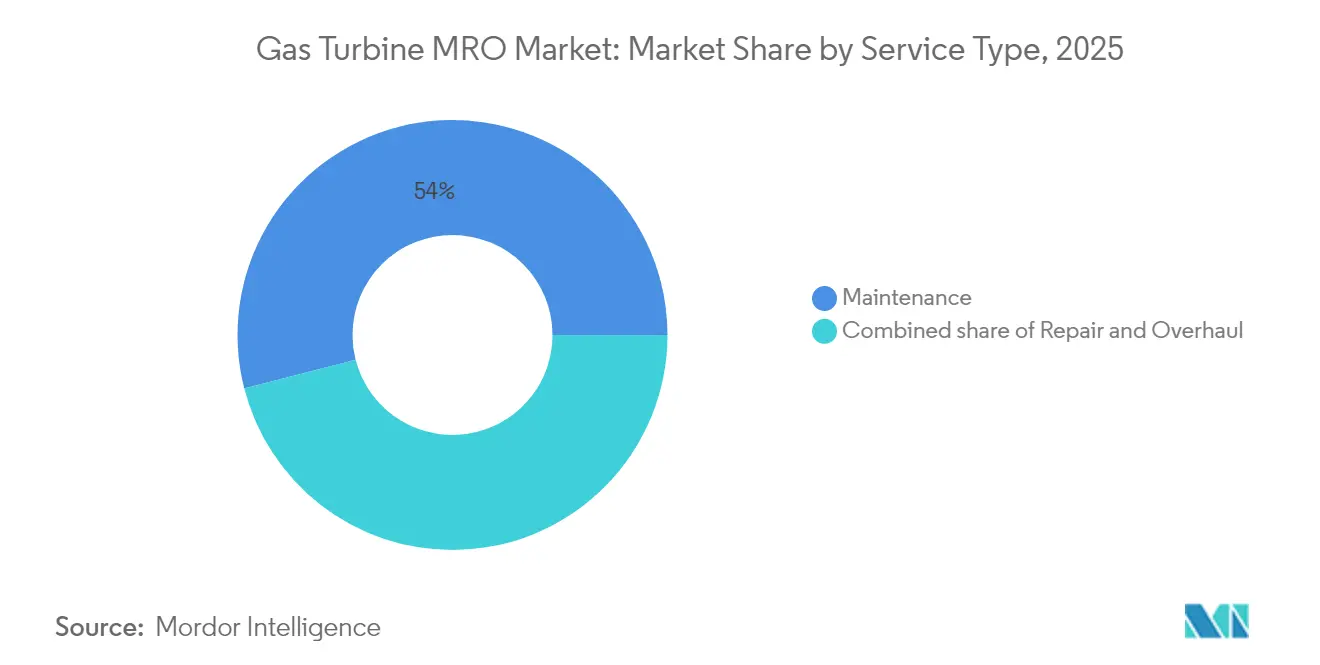
Maintenance Anchors, Overhauls AccelerateMaintenance accounted for 54.00% of 2025 revenue as operators adhere to calendar or hour-based schedules for combustors, filters, and lube-oil systems. Digital twins now refine these intervals by correlating sensor data with component life to avoid premature part replacement, saving up to 7% on annual maintenance budgets. Repairs, spanning unplanned hot-section or rotor damage, command premium rates due to their urgency and labor intensity.
Overhauls exhibit the steepest climb at a 5.95% CAGR as the fleet age increases. Sulzer’s turnkey 501F program, featuring rotor stacking, balance, and machining, cuts lead time by sourcing aftermarket cores and performing parallel subassembly workstreams. Such capability attracts operators seeking 20-year life extension at 40-60% of new-build capital expenditure.
By End-User Industry:
Power Generation Core, Industrial UpsurgePower utilities generated 69.10% of the 2025 gas turbine MRO market in the power sector revenue, requiring an availability rate of over 95% to meet capacity market penalties. Outage planning aligns with seasonal demand dips, compressing overhaul windows into the tight spring and autumn shoulders.
Industrial and “other” users grow fastest at 9.10% CAGR, led by oil and gas LNG trains where downtime equates to lost cargo revenue, and by advanced manufacturing sites adopting combined-heat-and-power for carbon-reduction strategies. Air Products’ Edmonton net-zero hydrogen complex illustrates how specialty-chemicals production creates bespoke MRO demands on 100% H₂-capable turbines, including flame-detection calibration and hydrogen-embrittlement inspections.
Geography Analysis
APAC Gas Turbine MRO Market
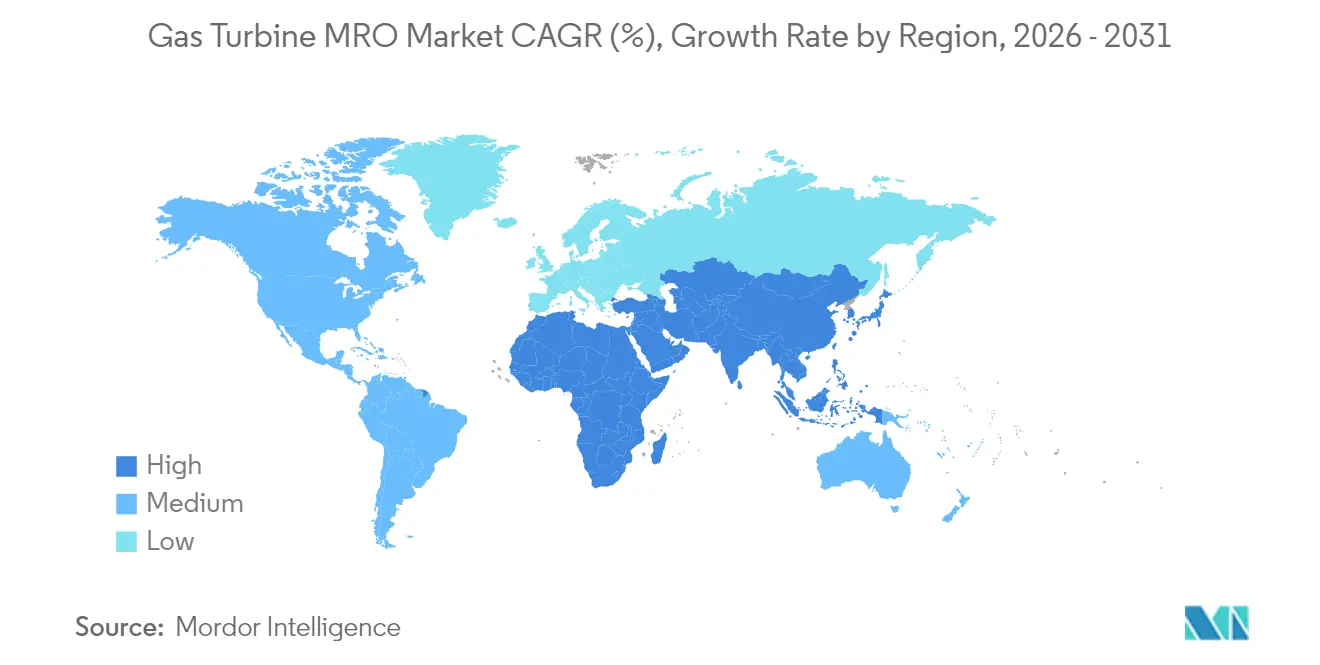
The Asia-Pacific’s dominant share stems from the sustained rollout of combined-cycle power plants, industrial electrification, and government mandates that aim for lower-carbon baseload alternatives to coal. Regional OEM depots in Dammam, Kuala Lumpur, and Shanghai stock critical hot-gas-path parts, slashing customs delays and cutting average outage length by 10%. Service providers also align with state utilities to co-develop hydrogen-ready pilot projects, ensuring an early-mover advantage as decarbonization funds become available.
North America Gas Turbine MRO Market
North America benefits from abundant shale gas, which keeps fuel costs low enough to justify refurbishing legacy frames rather than retiring them, supporting the north america gas turbine mro market.The United States adds complexity through data-center peaker projects that adopt service levels akin to those in aviation maintenance, including a guaranteed four-hour maximum unscheduled-outage response. Canada’s LNG export terminals rely on compressor-drive turbines that face marine-salt-laden air, necessitating aggressive inlet-filter replacement cycles.
Europe Gas Turbine MRO Market
Europe confronts volatile gas pricing and stringent ESG rules. Operators pivot toward high-efficiency upgrades to offset carbon tax exposure, making life extension work an economic imperative. OEMs thus bundle combustor kits certified for up to 50% hydrogen, aligning with EU taxonomy thresholds that unlock financing. Field-service staffing shortages remain acute; providers augment their crews with mobile container workshops and remote expert support to maintain outage schedules within tight grid-balancing windows.
MEA Gas Turbine MRO Market
The Middle East leans on long-term cogeneration complexes integrated with refinery expansions. These plants run at high load factors, dictating well-planned major outages every three years. OEMs open repair-capable hot-section workshops in-country to satisfy localization quotas. Africa’s fast-growing but fragmented market focuses on simple-cycle peakers and emergency units where modular swap-out strategies minimize spares inventory.
South America Gas Turbine MRO Market
South America capitalizes on natural-gas discoveries that feed new CCGTs yet retains a large legacy of smaller industrial turbines. OEMs establish regional parts hubs in Colombia and Chile to reduce lead times and circumvent customs bottlenecks, aiming for 24-hour shipping for Tier-1 items.
Regulatory Landscape
Emissions and operating-permit requirements keep shaping gas turbine MRO outage scopes and retrofit content, particularly around NOx control and combustion system upgrades. In January 2026, the U.S. Environmental Protection Agency finalized amendments to the New Source Performance Standards (NSPS) for stationary combustion turbines (40 CFR Part 60, Subpart KKKKa), applicable to facilities constructed, modified, or reconstructed after December 13, 2024, and identified combustion controls and selective catalytic reduction (SCR) as best systems of emission reduction for certain subcategories. This reinforces how maintenance turnarounds increasingly coincide with emissions-compliance projects.
Standards and guidance updates also affect contracting, documentation, and work instructions across global fleets. ISO 3977-9:2024 introduced updated procurement and reliability, availability, and maintainability (RAM) expectations for gas turbine packages, while ISO 11366:2025 set requirements for in-service maintenance of lubricating oils for gas turbines, adding structure to condition monitoring, sampling, and corrective actions that many service providers embed into LTSA/LTPSA deliverables. In the United Kingdom, an April 2026 government consultation outcome on best available techniques (BAT) implementation guidance for mid-merit open-cycle gas turbines further highlighted the policy shift toward cycling and fast-start operation, which influences start-based maintenance planning and performance-linked compliance practices.
Competitive Landscape
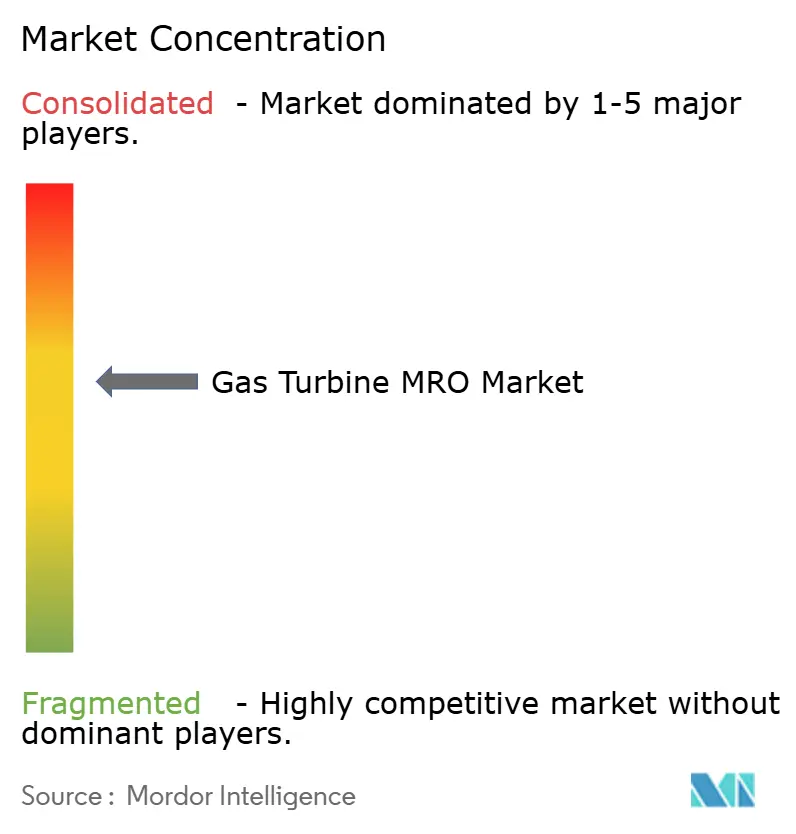
The gas turbine MRO market remains moderately consolidated. GE Vernova, Siemens Energy, and Mitsubishi Power control roughly two-thirds of heavy-duty fleet service agreements, leveraging original-equipment IP, digital-twin libraries, and proprietary parts. GE Vernova’s USD 160 million Greenville expansion adds hydrogen-testing bays to future-proof overhaul capabilities, while Siemens Energy’s EUR 7 billion Gas Services order intake in Q2 2025 underscores demand for scope deals spanning rotating and balance-of-plant assets.[5]
Baker Hughes dominates aeroderivative aftercare, integrating aviation-grade logistics and field teams who can swap power turbines in under 24 hours offshore. Independent service providers such as EthosEnergy and Sulzer compete by offering cost-efficient, cross-OEM solutions, particularly for operators running mixed fleets. One Equity Partners’ 2025 buyout of EthosEnergy signals private-equity confidence in roll-up strategies that pool specialty shops and field crews to rival the breadth of OEMs.
The competitive edge is increasingly revolving around digital command centers that analyze fleet telemetry, schedule predictive outages, and orchestrate parts delivery. GE Vernova’s acquisition of Alteia SAS augments AI-driven analytics that interpret thermal imagery of HRSG tubes, enabling defect detection before failure. Meanwhile, Mitsubishi Power emphasizes hydrogen-conversion consulting, bundling combustor retrofits with fuel-handling system design. White-space exists in technician-training platforms, augmented-reality wrench-time reduction tools, and component-recycling services that reclaim super-alloy value streams.
Gas Turbine MRO Industry Leaders
-
GE Vernova
-
Siemens Energy
-
Mitsubishi Power
-
MTU Aero Engines
-
EthosEnergy
- *Disclaimer: Major Players sorted in no particular order
Gas Turbine MRO Market Companies Covered in this Report
- General Electric (GE Vernova)
- Siemens Energy
- Mitsubishi Power
- MTU Aero Engines
- EthosEnergy
- Kawasaki Heavy Industries
- Ansaldo Energia
- Solar Turbines
- Baker Hughes
- Sulzer
- Rolls-Royce
- RWG (Rolls-Wood Group)
- Patria
- Harbin Electric International
- Bharat Heavy Electricals
- MAN Energy Solutions
- Pratt & Whitney
- Vericor Power Systems
- Wood Group
- Taqa Arabia Services
Market Opportunities and Future Outlook
White-space continues to center on service models and capabilities that reduce outage time and manage cycling duty, especially as new combined-cycle build decisions and large equipment awards extend into long service tails. In June 2026, Siemens Energy was selected to supply the 2.6 GW Taweelah C independent power producer project in Abu Dhabi, and in January 2026 Mitsubishi Power secured a contract to supply M701JAC gas turbines for Qatar's Facility E independent water and power project. These newbuild awards expand the installed base that typically transitions into long-term service coverage, creating near-term openings for parts provisioning, outage tooling, and regional field-service readiness in the Middle East.
Capability expansion and advanced repair methods are another visible opportunity set, tightening the link between parts availability and MRO share. Mitsubishi Heavy Industries announced in June 2026 a plan to double production capacity for large gas turbines by fiscal 2030 relative to fiscal 2024, which also lifts demand for repair throughput, hot-gas-path part manufacturing capacity, and qualified subcontractor networks during peak outage seasons. On the technology side, published work on AI-driven maintenance optimization (including predictive compressor washing) and the use of laser-based repair and laser powder bed fusion (LPBF) patch repairs for combustion components supports a shift toward cost-optimized, condition-based interventions, favoring providers with digital diagnostics, component-life analytics, and qualified additive repair processes integrated into standard overhaul packages.
Recent Industry Developments in Gas Turbine MRO Market
- June 2026: Mitsubishi Power signed a long-term parts and services agreement with LNGPH for the 1,278 MW Ilijan combined-cycle power plant in the Philippines, covering M501G gas turbines. The agreement strengthens long-horizon parts planning and outage execution in a market where combined-cycle units drive high MRO intensity, supporting faster turnaround through OEM-backed material assurance.
- February 2026: GE Vernova completed a major outage and High Efficiency upgrades on two GT26 gas turbines at InterGen's 800 MW Coryton Power Plant in the United Kingdom, adding 85 MW of output and improving efficiency by 2.46%. The project shows how performance-uprate packages are being pulled into planned outages, expanding engineering and component scope beyond standard hot-section work.
- January 2025: GE Vernova announced a USD 20 million investment in its Singapore Global Repair Service Center to develop repair capabilities for HA gas turbines. The investment adds regional repair capacity for advanced-class fleets, supporting localized turnaround and strengthening aftermarket responsiveness in Asia-Pacific where the installed base and parts demand are concentrated.
Gas Turbine MRO Market Report Scope and Research Methodology
Market Definition and Coverage
This market covers revenue from maintaining, repairing, and overhauling gas turbines, including planned inspections, corrective work, and major overhauls intended to restore performance and reliability across operating fleets.
Scope exclusions: We exclude new gas turbine equipment sales and EPC project revenues that are not billed as MRO services.
Segments Covered in This Report
- By Capacity
- Below 30 MW
- 31 to 120 MW
- Above 120 MW
- By Turbine Cycle
- Combined Cycle
- Open/Simple Cycle
- By Service Type
- Maintenance
- Repair
- Overhaul
- By End-user Industry
- Power Generation
- Oil and Gas (Up-/Mid-/Down-stream)
- Industrial and Other
- By Geography
- North America
- United States
- Canada
- Mexico
- Europe
- Germany
- United Kingdom
- France
- Italy
- NORDIC Countries
- Russia
- Rest of Europe
- Asia-Pacific
- China
- India
- Japan
- South Korea
- ASEAN Countries
- Rest of Asia-Pacific
- South America
- Brazil
- Argentina
- Rest of South America
- Middle East and Africa
- Saudi Arabia
- United Arab Emirates
- South Africa
- Egypt
- Rest of Middle East and Africa
- North America
Data Sources, Market Sizing, and Validation
Desk Research
Desk work is used to build the initial demand picture and to anchor a few hard inputs before assumptions are tested. For gas turbine MRO, we mainly pull public data series that signal fleet size, utilization, and maintenance intensity, such as US EIA generation statistics, IEA energy outlook tables, and IRENA capacity additions (where gas capacity trends are discussed).
We also review sources such as US Energy Information Administration plant level context, Eurostat energy balances, national grid and system operator publications, and open academic or peer reviewed papers on hot section life, outage intervals, and degradation. Company annual reports, investor presentations, and reputable press are used to understand service mix changes, pricing pressure, and outage scheduling themes. Where needed, paid subscriptions for company financials and intelligence, news and financials, patent databases, and aerospace and aviation datasets are used to cross-check installed base signals and technology shifts. These desk sources are illustrative only, and many other public and paid references were also used for collection, validation, and clarification.
Primary Interviews and Surveys
Primary interviews are used to pressure-test service splits and to make sure the model reflects how work scopes are actually contracted and delivered. We speak with a mix of service providers, parts and component specialists, plant operators, and procurement or maintenance leaders across APAC, EMEA, and the Americas to confirm outage cycles, typical scope per event, and how pricing moves with parts availability and labor constraints.
Distribution of primary research fieldwork respondents
| Company type | Respondent position | Region |
|---|---|---|
| Top tier: 38% | CXOs: 18% | APAC: 44% |
| Mid tier: 43% | Functional/Unit leaders: 34% | EMEA: 32% |
| Smaller Players: 19% | Managers: 48% | Americas: 24% |
Market-Sizing & Forecasting
Sizing starts with a top-down rebuild where installed capacity and operating patterns are converted into an annual MRO spend pool, and then filtered through typical outage frequency by turbine class and cycle type. To keep it practical, we track a few inputs carefully, including the installed base by capacity bands (below 30 MW, 31 to 120 MW, and above 120 MW), combined cycle versus open cycle mix, annual run hours and starts, parts replacement intensity for hot section events, and the share of work handled as maintenance versus repair versus overhaul.
Once the top-down total is formed, we corroborate it with selective bottom-up checks using sampled service revenues, contract benchmarks, and volume times average service ticket ranges by end user (power generation, oil and gas, and industrial). If a bottom-up view is thin for a country or a capacity band, we handle gaps by mapping similar fleets and operating regimes, then applying conservative utilization and outage assumptions that were confirmed in interviews.
Forecasts are built using scenario analysis supported by a light multivariate regression on drivers that matter most for this market, such as gas fired generation outlook, capacity additions and retirements, utilization shifts tied to renewables penetration, and typical major inspection cycles. The final forecast is then reviewed with experts to keep the modeled parts and labor progression realistic for the next few years.
Data Validation & Update Cycle
Outputs are triangulated across multiple angles, so totals align with installed base signals, expected outage counts, and realistic service spend per event. Variance checks are run by region, capacity class, and service type, and any sharp jumps are traced back to a driver change like run hours, major inspection timing, or price assumptions.
Before sign-off, the model and key assumptions go through multi-step analyst reviews, and respondents are re-contacted when the implied service intensity or pricing looks out of line with current contracting behavior. Reports are refreshed annually, and interim updates are made when material events change the spend curve, followed by a final pre-delivery pass to ensure clients receive the latest view.
Mordor Intelligence's Gas Turbine MRO Market Size Compared Against Other Published Estimates
Published market sizes for gas turbine MRO can look inconsistent because the same words often cover different revenue items and timing choices. Differences usually come from what is counted as MRO versus adjacent services, which year is treated as the current baseline, and how pricing and outage cycles are carried forward.
The biggest gap drivers in this market are whether minor parts-only activity and field service labor are both included, how combined cycle versus open cycle utilization is assumed, and whether aviation and non-power end uses are treated as a meaningful share or kept narrower. A second driver is the refresh cadence, since changes in gas fired dispatch, outage deferrals, and parts lead times can move a one-year number more than many users expect.
Benchmark comparison
| Source | Market Size | Gaps in Research Methodology |
|---|---|---|
| Mordor Intelligence | USD 17.53 B (2026) | |
| Global Consultancy A | USD 15.55 B (2025) | Uses an earlier base year and a slower progression, and the scope is often presented through technology splits that can undercount third-party repair work and parts-linked field service captured in operator budgets. |
| Industry Publisher B | USD 16.89 B (2024) | Anchors the market in a prior year and may blend broader applications and modification activity, which can shift spend between true overhaul events and upgrade-led projects depending on how contracts are classified. |
The table shows that year selection and service-scope treatment explain most of the spread, especially around whether parts plus labor are tracked per outage cycle versus blended into wider service buckets. Keeping the demand pool tied to installed base, run hours, and inspection cadence checks is what makes the estimate repeatable and auditable, a modeling choice applied by Mordor Intelligence.
Key Questions Answered in the Report
How large is the gas turbine MRO market today?
The gas turbine MRO market size reached USD 17.53 billion in 2026 and is projected at USD 17.53 billion for 2026.
What annual growth rate is expected for gas turbine MRO through 2031?
Market value is forecast to advance at a 4.88% CAGR, reaching USD 22.24 billion by 2031.
Which capacity class offers the fastest growth potential?
The 31-120 MW segment is on pace for a 6.45% CAGR, propelled by data-center peaker demand and distributed generation trends.
Why do combined-cycle plants dominate MRO spending?
They account for 85.20% of revenue because their integrated gas-steam layout multiplies serviceable assets and demands specialized expertise.
How is hydrogen adoption influencing MRO requirements?
Retrofit programs for 20-50% hydrogen blends drive combustor upgrades and control-system revisions, expanding high-margin engineering scope.
Which region will see the strongest MRO growth?
Asia-Pacific leads both in market share and forecast growth at 5.12% CAGR, supported by a large and expanding combined-cycle fleet.