Functional Safety Market Size and Share
Market Overview
| Study Period | 2020 - 2031 |
|---|---|
| Market Size (2026) | USD 7.84 Billion |
| Market Size (2031) | USD 12.82 Billion |
| Growth Rate (2026 - 2031) | 10.34% CAGR |
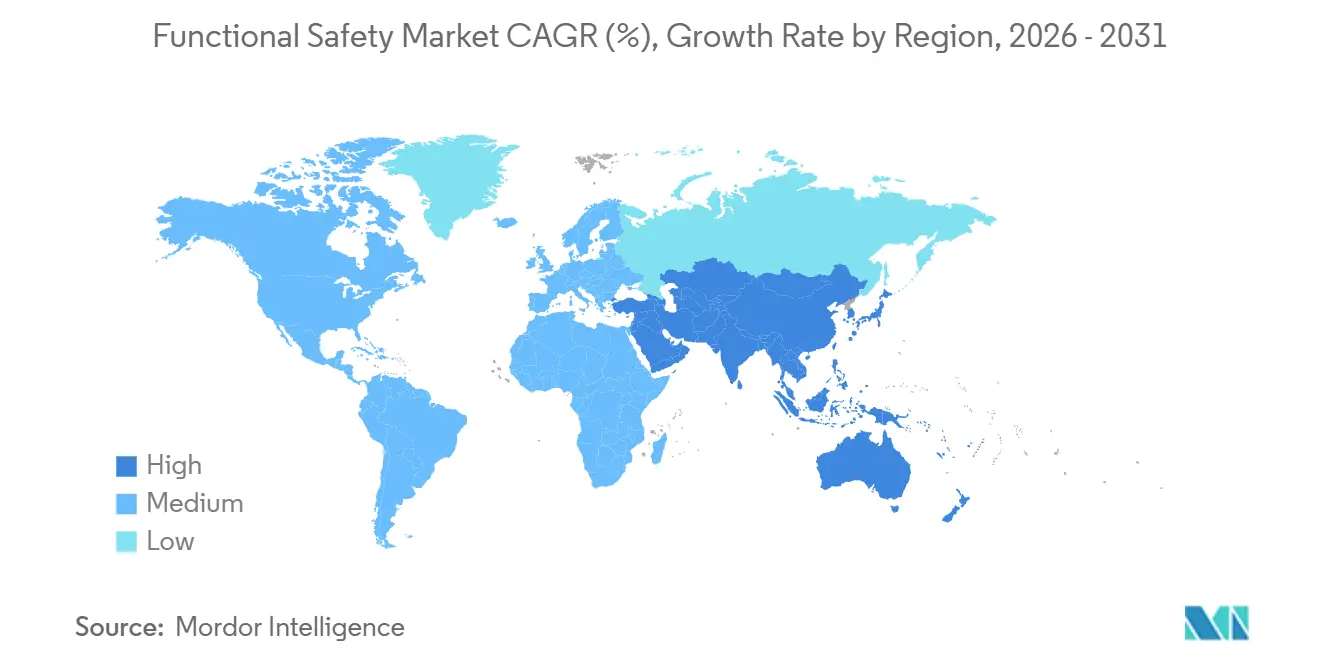
| Fastest Growing Market | Asia-Pacific |
| Largest Market | Europe |
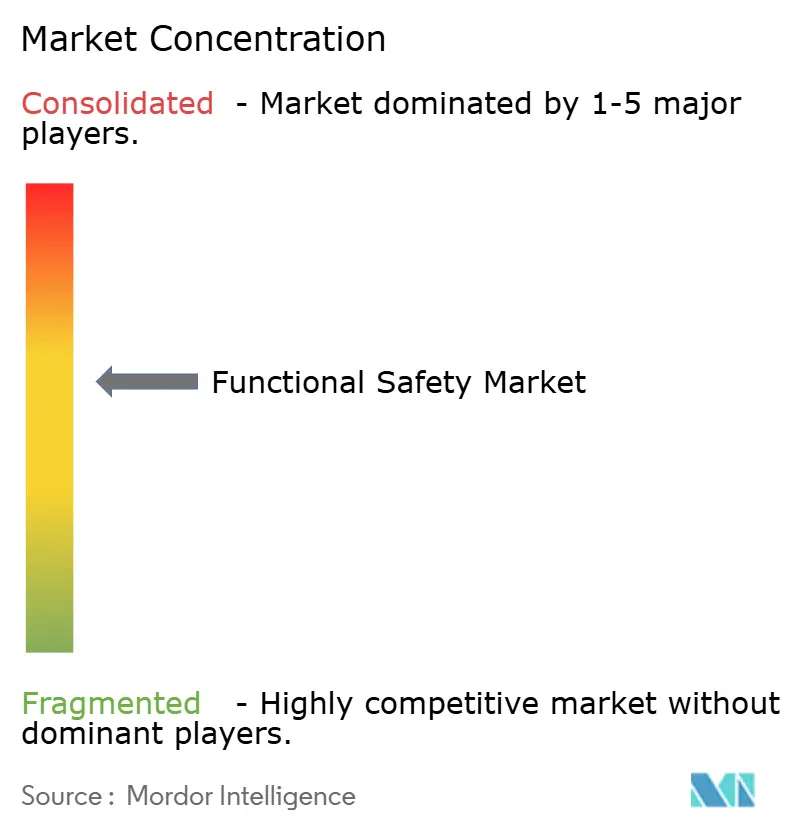
| Market Concentration | Medium |
Major Players *Disclaimer: Major Players sorted in no particular order Image © Mordor Intelligence. Reuse requires attribution under CC BY 4.0. | |
Functional Safety Market Analysis by Mordor Intelligence
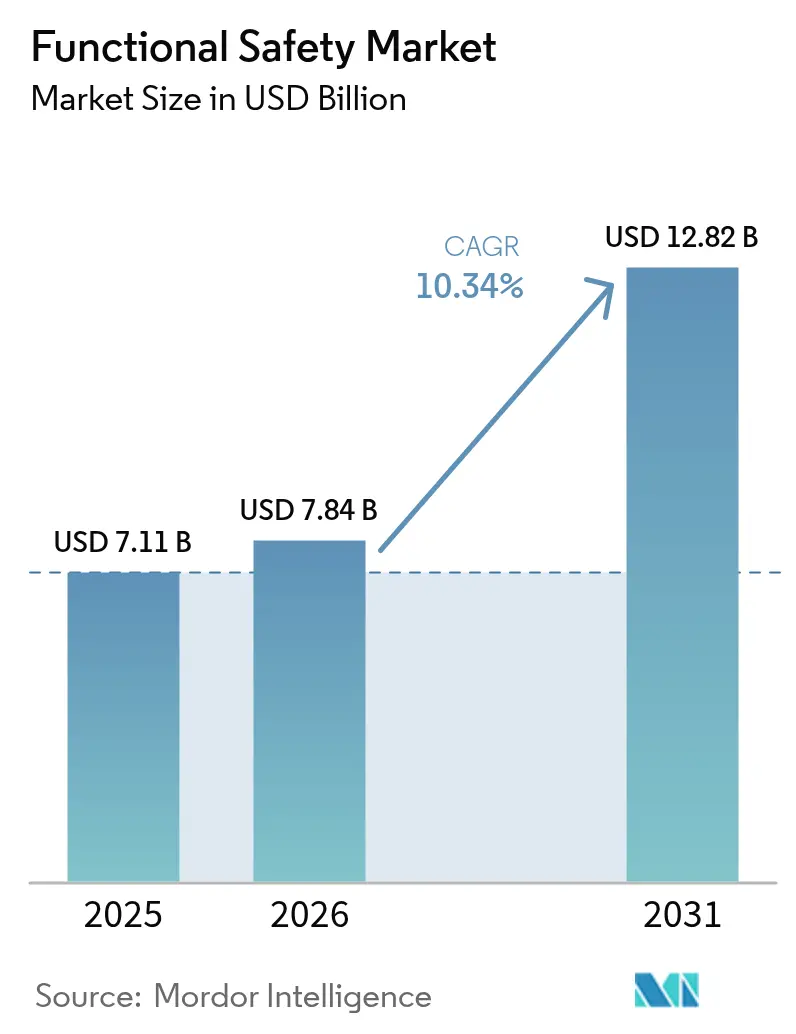
The functional safety market size is expected to increase from USD 7.11 billion in 2025 to USD 7.84 billion in 2026 and reach USD 12.82 billion by 2031, growing at a CAGR of 10.34% over 2026-2031. Mandatory adherence to IEC 61508 and ISO 26262 across process and automotive domains, rapid integration of safety-instrumented systems into Industry 4.0 architectures, and early adoption of SIL-certified artificial-intelligence shutdown logic are accelerating demand. Hardware vendors are pivoting toward software-defined platforms that shorten certification lead times, cut validation costs, and enable over-the-air parameter tuning. Simultaneously, subscription models that bundle proof-test scheduling, cloud documentation, and competency development are expanding addressable spend among small and medium enterprises. Growing incident-related scrutiny in oil and gas, coupled with methane-emission penalties in North America and Europe, positions high-integrity pressure protection systems as the fastest-moving niche.
Key Report Takeaways
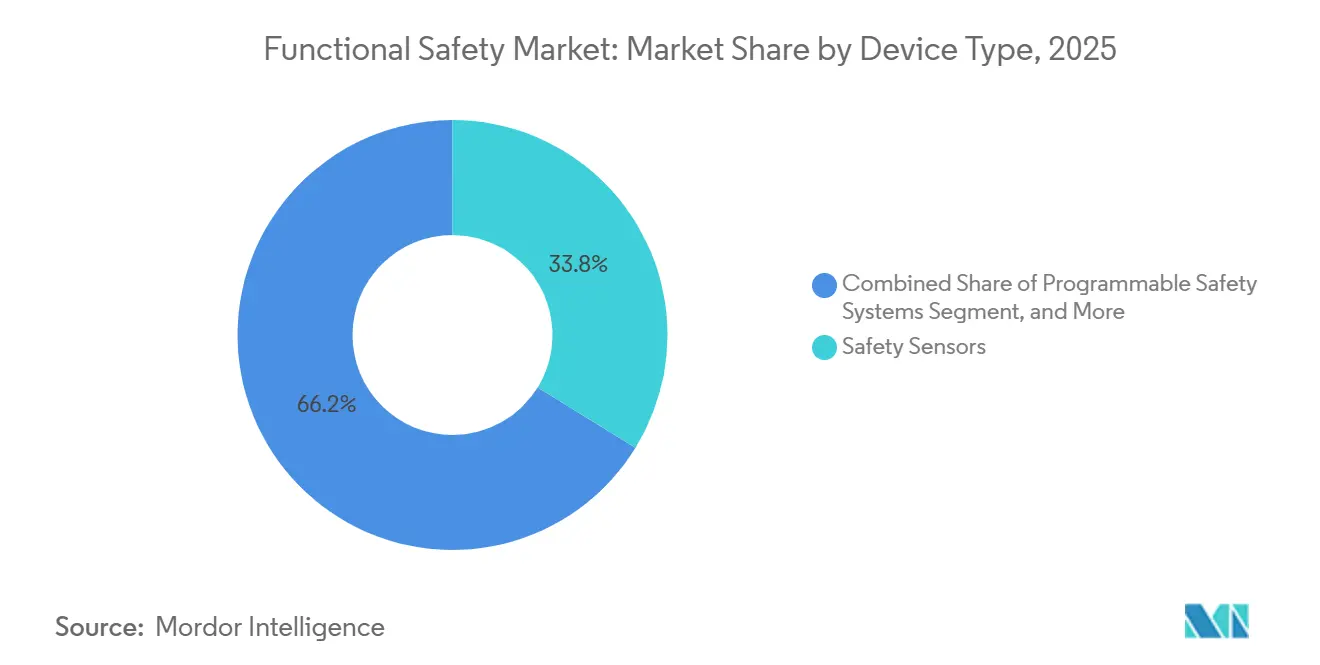
- By device type, safety sensors led with 33.78% of the functional safety market share in 2025, while programmable safety systems are projected to expand at an 11.78% CAGR through 2031.
- By safety system, emergency shutdown systems accounted for 28.67% of revenue in 2025; high-integrity pressure protection systems are forecast to grow at a 11.73% CAGR through 2031.
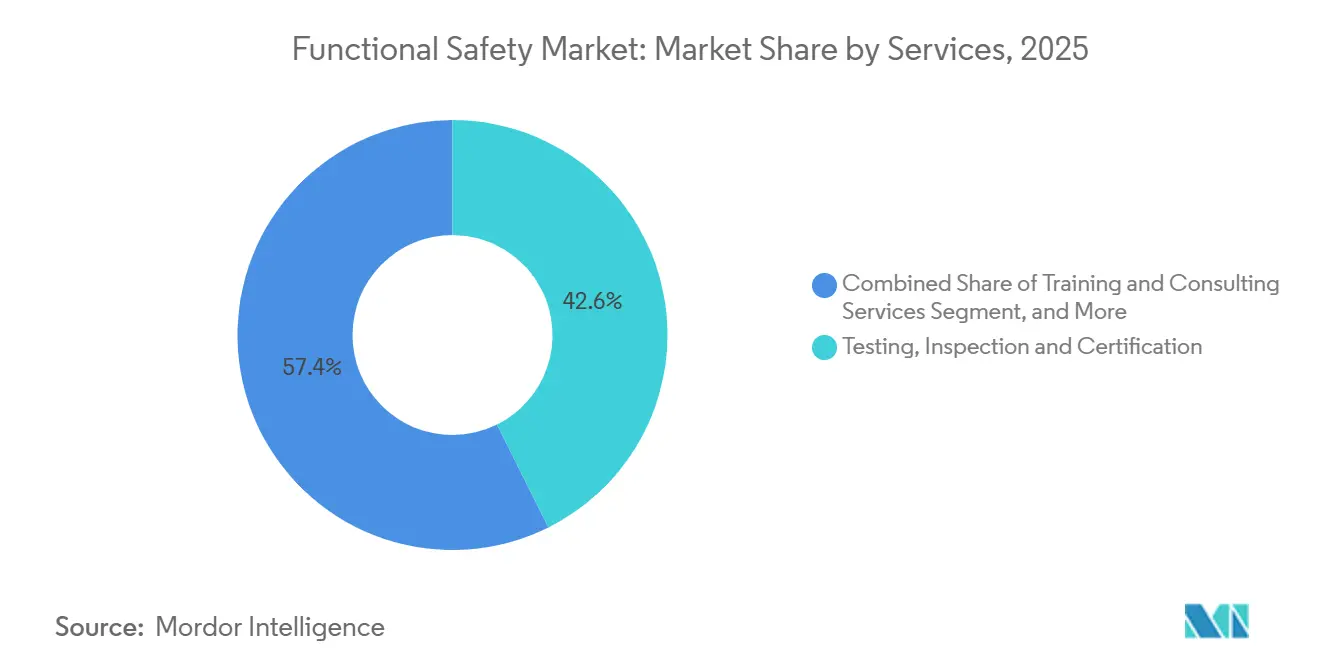
- By service, testing, inspection, and certification accounted for 42.64% of the functional safety market size in 2025, whereas training and consulting are anticipated to rise at a 10.91% CAGR through 2031.
- By end-user industry, oil and gas contributed 29.38% of demand in 2025, and pharmaceuticals are on track to post an 11.54% CAGR between 2026-2031.
- By geography, Europe retained 34.89% of the functional safety market share in 2025, while Asia-Pacific is expected to register an 11.39% CAGR over the forecast horizon.
Note: Market size and forecast figures in this report are generated using Mordor Intelligence’s proprietary estimation framework, updated with the latest available data and insights as of 2026.
Global Functional Safety Market Trends and Insights
Drivers Impact Analysis*
| Driver | (~) % Impact on CAGR Forecast | Geographic Relevance | Impact Timeline |
|---|---|---|---|
| Stringent Global Safety Regulations and Standards (IEC 61508, ISO 26262) | +2.8% | Global, with early adoption in Europe and North America | Long term (≥ 4 years) |
| Expansion of Industry 4.0 and Industrial Automation | +2.3% | Asia-Pacific core, spill-over to Europe and North America | Medium term (2-4 years) |
| Heightened Incident-Related Scrutiny in Oil and Gas, and Power Sectors | +1.9% | Middle East, North America (Gulf Coast), Europe (North Sea) | Short term (≤ 2 years) |
| Integration of Functional Safety with Industrial Cybersecurity | +1.6% | North America and Europe, expanding to Asia-Pacific | Medium term (2-4 years) |
| Emergence of SIL-Certified AI/ML Shutdown Algorithms | +1.2% | North America and Europe pilot sites, scaling to Middle East | Long term (≥ 4 years) |
| Rise of Safety-as-a-Service Subscription Models for SMEs | +0.9% | Global, with highest penetration in Europe and North America SME clusters | Medium term (2-4 years) |
| Source: Mordor Intelligence | |||
Stringent Global Safety Regulations and Standards
Regulatory mandates remain the prime catalyst for new installations and retrofits. IEC TS 61508-3-2:2024 formalized model-checking and theorem-proving techniques, cutting certification cycles for programmable safety systems by up to 20%.[1]International Electrotechnical Commission, “IEC TS 61508-3-2:2024,” IEC.CH ISO 26262 Edition 3 draft texts circulated during 2024-2025 extend ASIL-D coverage to Level 3-4 automated-driving functions, pushing chipset and controller redesign among tier-one automotive suppliers. Europe’s Machinery Regulation (EU) 2023/1230 introduces digital product passports from 2027, accelerating brownfield upgrades, while OSHA’s March 2025 revision to 29 CFR 1910.119 requires quantified risk analysis for every SIL-rated loop in United States refineries.
Expansion of Industry 4.0 and Industrial Automation
Edge computing and digital twin rollouts are embedding functional safety logic into broader automation stacks. Siemens connected its Simatic Safety Integrated family to Industrial Edge in 2024, enabling deterministic response times below 10 milliseconds and synchronized cloud analytics for predictive maintenance.[2]Siemens AG, “Simatic Safety Integrated on Industrial Edge,” SIEMENS.COM Rockwell Automation consolidated standard and safety control in the FactoryTalk GuardLogix 5580 line, trimming panel footprints by nearly 40% for discrete manufacturers. Wireless, IO-Link-enabled safety sensors launched by Pepperl+Fuchs in 2025 are feeding real-time diagnostics into MES platforms, cutting line downtime by up to 25% in automotive sites. China’s Made-in-China 2025 roadmap and India’s Production-Linked Incentive scheme channel new capex into automation, sustaining above-global growth in Asia-Pacific.
Heightened Incident-Related Scrutiny in Oil and Gas and Power Sectors
Near-miss blowout events and battery-storage fires have sharpened regulatory focus. U.S. Bureau of Safety and Environmental Enforcement Safety Alert 471 mandates independent SIL verification for subsea blowout preventers installed on Gulf of Mexico assets.[3]U.S. Bureau of Safety and Environmental Enforcement, “Safety Alert 471,” BSEE.GOV Europe’s North Sea Transition Authority tightened proof-test intervals for SIL 3 loops, leading to HIPPS retrofits on mature platforms. In power, NERC’s January 2025 CIP update obliges cyber-physical safety interlocks for grid-connected battery systems, boosting demand for burner management and turbomachinery controls.
Integration of Functional Safety with Industrial Cybersecurity
Operators increasingly treat cyber threats as latent safety hazards. IEC 62443-2-1:2024 prescribes unified asset-owner programs that dovetail with IEC 61511 lifecycles, ensuring that SIL-rated controllers reside in segregated security zones. Schneider Electric’s 2025 EcoStruxure Cybersecurity Admin Expert automates zone classification so that emergency shutdown systems inherit Security Level 3 protections by default. United States CISA Binding Operational Directive 23-01 compels critical infrastructure entities to deploy defense-in-depth countermeasures across operational technology networks, driving sales of unidirectional gateways and data diodes.
Restraints Impact Analysis*
| Restraint | (~) % Impact on CAGR Forecast | Geographic Relevance | Impact Timeline |
|---|---|---|---|
| High Upfront Cost of SIL-Certified Components and Systems | -1.4% | Global, with acute impact on SMEs in Asia-Pacific and South America | Short term (≤ 2 years) |
| Complexity of Retrofitting Legacy Brown-Field Facilities | -1.1% | North America and Europe (aging infrastructure), Middle East (mature oil fields) | Medium term (2-4 years) |
| Shortage of Certified Functional Safety Engineers | -0.8% | North America and Europe, emerging in Asia-Pacific | Long term (≥ 4 years) |
| Liability Ambiguity for OTA Safety-Critical Software Updates | -0.6% | North America and Europe (automotive and rail sectors) | Long term (≥ 4 years) |
| Source: Mordor Intelligence | |||
High Upfront Cost of SIL-Certified Components and Systems
SIL-rated hardware sells at two to three times the price of standard automation equipment, stretching capital budgets for mid-tier operators. ABB’s AC 800M High Integrity chassis lists at USD 18,000-25,000, compared with USD 6,000-8,000 for the non-safety variant, while SICK’s deTec4 laser scanners cost roughly USD 4,500-6,000, quadruple the cost of a conventional distance sensor. Validation studies frequently add six-figure fees, prompting many Southeast Asian and Latin American SMEs to defer upgrades in favor of higher insurance premiums or extended maintenance windows.
Complexity of Retrofitting Legacy Brownfield Facilities
Installing modern safety-instrumented systems into 1980s-era plants requires parallel networks, hazardous-area reclassification, and lengthy shutdowns. An American Petroleum Institute study estimated a USD 40-60 million bill and up to 24 months of engineering to bring a 200,000 barrels-per-day refinery into IEC 61511 compliance. Physical congestion in control rooms, the need for redundant power, and regulatory permitting cycles inflate project timelines and cost, particularly on aging North Sea and Gulf Coast assets.
*Our forecasts treat driver/restraint impacts as directional, not additive. The impact forecasts reflect baseline growth, mix effects, and variable interactions.
Segment Analysis
By Device Type: Sensors Anchor Retrofits, Programmable Systems Lead Innovation
Safety sensors accounted for 33.78% of the functional safety market in 2025 as brownfield facilities replaced electromechanical guards with electronic light curtains, laser scanners, and magnetic interlocks. Demand is robust in oil and gas and food processing, where operators favor contactless sensing to minimize mechanical wear. Programmable safety systems, however, are projected to record an 11.78% CAGR, reflecting a pivot toward software-defined logic that decouples application code from hardware, allowing remote parameter updates without jeopardizing integrity.
The functional safety market continues to integrate safety inputs, logic solvers, and final elements into unified platforms. Pilz’s PSS 4000 and Omron’s NX-series controllers embed SIL 3 functions alongside standard automation, cutting hardware line items by nearly a third. Contactless RFID switches are reducing nuisance trips by roughly 45%, while AI-enabled self-diagnostic sensors transmit remaining useful life data, lowering unplanned downtime in packaging and assembly lines.


By Safety Systems: ESD Dominates, HIPPS Gains Momentum
Emergency shutdown systems held 28.67% of the functional safety market share in 2025 owing to their universal deployment in refineries, LNG terminals, and petrochemical complexes. Simultaneously, driven by methane-emission regulations that deter flaring and promote enclosed overpressure protection, high-integrity pressure protection systems are poised for an 11.73% CAGR expansion during the forecast period. These systems play a critical role in ensuring operational safety and compliance with environmental standards, further driving their adoption across various industries.
Modern distributed control architectures blur boundaries between process control and safety. Honeywell’s Experion PKS now embeds SIL-certified logic within the same environment as regulatory loops, aiding operator situational awareness. Emerson’s wireless DeltaV SIS transmitters shave USD 500-1,000 per loop on greenfield LNG builds, encouraging adoption in cost-sensitive Middle East projects. Digital twins used during HIPPS design have cut factory-acceptance test time by nearly half, shortening time-to-first-gas for offshore fields.
By Services: Certification Peaks, Training Scales
In 2025, testing, inspection, and certification services captured 42.64% of the revenue, spurred by a rush to validate machinery-safety designs due to IEC 62061 harmonization. Industry insiders in functional safety foresee a slowdown in certification activities by 2027, as backlogs diminish. They predict a pivot in growth focus towards training and consulting services, which are projected to expand at a robust 10.91% CAGR.
Lifecycle-oriented services are on the rise. Major players like TÜV SÜD, TÜV Rheinland, and UL Solutions are enhancing their audit services by integrating features such as cloud document repositories, virtual-reality operator drills, and automated proof-test reminders. Platforms like Siemens’ SIMIT Safety and Rockwell’s Emulate3D empower engineers to validate safety logic in simulated settings, reducing the need for on-site adjustments and cutting commissioning time by as much as 50%.
By End-User Industry: Oil And Gas Leads, Pharmaceuticals Surge
Oil and gas accounted for 29.38% of the functional safety market in 2025, driven by LNG construction in North America and HIPPS rollouts on mature offshore assets. Pharmaceuticals are set to achieve an 11.54% CAGR, driven by the installation of SIL-rated control interlocks on continuous-manufacturing lines. This development aligns with the FDA’s December 2024 quality systems guidance, which emphasizes enhanced safety and efficiency in manufacturing processes. The adoption of these advanced systems is expected to streamline operations and ensure compliance with regulatory standards, further supporting market growth.
In power generation, battery energy storage, and combined-cycle projects, SIL 3 burner management and turbomachinery controls are required to mitigate thermal runaway and overspeed risks. Food and beverage facilities e low-performance e-sensors and e-stops to comply with OSHA machine-guarding rules, while the automotive sector is embedding ISO 26262 ASIL-D controllers into advanced driver-assistance subsystems, expanding the functional safety market beyond traditional process plants.
Geography Analysis
Europe accounted for 34.89% of the functional safety market share in 2025, led by Germany, France, and the United Kingdom, where CE marking laws and high labor costs sustain automation spending. The incoming Machinery Regulation’s digital passports will catalyze another retrofit spike before 2027. Southern Europe is channeling stimulus into cleaner combined-cycle plants, translating into fresh orders for SIL-rated turbomachinery controls.
Asia-Pacific is projected to post an 11.39% CAGR through 2031. China’s alignment with GB/T 20438 and IEC 61508, and subsidies under Made-in-China 2025, are driving the mass deployment of safety controllers in electronics and machinery plants. India’s USD 1.8 billion Production-Linked Incentive allocation for automation is already visible in pharmaceutical greenfields. Japan and South Korea, faced with aging workforces and intense semiconductor expansion, are specifying SIL-2 or higher safety systems for robotics and battery cell lines.
North America represents roughly one-quarter of global revenue, underpinned by brownfield retrofits in Gulf Coast and Canadian oil sands facilities. OSHA’s tighter proof-test windows, NERC’s battery-storage mandates, and BSEE subsea rules converge to fuel the adoption of emergency shutdown and HIPPS packages. Mexico and Brazil provide incremental growth through midstream expansion and pre-salt field upgrades, while the Middle East and Africa continue to order integrated safety-instrumented solutions for mega-refineries and gas-to-liquids complexes.

Competitive Landscape
The functional safety market sits in a moderately concentrated tier, with Rockwell Automation, Siemens, ABB, Schneider Electric, and Honeywell together controlling close to half of global revenue. Each of these companies offers a broad catalog spanning safety sensors, SIL-rated controllers, and lifecycle services, enabling them to bundle hardware, software, and validation support in a single contract. Competitive intensity is rising as customers shift budgets from discrete devices toward integrated platforms that merge safety logic with industrial analytics. This transition favors firms that already run large installed bases and can layer edge-to-cloud software on top of existing control footprints.
Market leaders are expanding through both organic product refreshes and targeted acquisitions. Rockwell Automation added autonomous mobile robot know-how when it purchased Clearpath Robotics in 2025, a move that embeds safety-rated navigation into the FactoryTalk portfolio and strengthens its position in intralogistics. Siemens is expanding controller capacity at its Amberg plant to shorten lead times for Simatic Safety Integrated hardware used by automotive and pharmaceutical clients. ABB and Honeywell formed a joint venture to deliver SIL-3 gateways that combine safety and cybersecurity functions, reflecting mounting demand for converged protection of operational assets. Schneider Electric opened a new facility in Bangalore to localize production of Modicon M580 ePAC and Triconex systems for Asia-Pacific projects that require both safety and deterministic networking.
Specialists remain influential in high-integrity and niche domains. HIMA dominates petrochemical batch processes that demand triple redundancy and custom logic, while SICK excels in laser scanners for collaborative robot cells where wide detection ranges and fast response times are critical. Pilz, Phoenix Contact, and Omron are carving white space with open-source or cloud-native development environments that trim engineering cycles for small and medium enterprises. Software-first challengers are also emerging, offering predictive shutdown algorithms that overlay existing controllers and charge on a subscription basis. These dynamics suggest that while the top five vendors keep scale advantages, agile innovators continue to erode lock-in by focusing on vertical specialties and service-centric revenue models.
Functional Safety Industry Leaders
Rockwell Automation Inc.
Emerson Electric Company
Honeywell International Inc.
ABB Ltd
Yokogawa Electric Corporation
- *Disclaimer: Major Players sorted in no particular order

Recent Industry Developments
- January 2026: Siemens earmarked EUR 150 million (USD 165 million) to enlarge its Amberg plant, boosting Simatic Safety Integrated controller output by 40%.
- November 2025: Pilz unveiled the cloud-native MYZEL lifecycle suite, promising 25-30% compliance-overhead cuts for multi-site clients.
- October 2025: ABB and Honeywell formed a joint venture to commercialize SIL-3 cybersecurity gateways, with first deliveries planned for Q2 2026.
- September 2025: Rockwell Automation acquired Clearpath Robotics for USD 290 million to embed safety-rated navigation into FactoryTalk automation.


Global Functional Safety Market Report Scope
The Functional Safety Market Report is Segmented by Device Type (Safety Sensors, Safety Controllers/Modules/Relays, Safety Switches, Programmable Safety Systems, Emergency Stop Devices, Final Control Elements, Other Device Types), Safety Systems (Burner Management Systems, Turbomachinery Control Systems, High-Integrity Pressure Protection Systems, Fire and Gas Monitoring Control Systems, Emergency Shutdown Systems, Supervisory Control and Data Acquisition Systems, Distributed Control Systems), Services (Testing, Inspection and Certification, Design, Engineering and Maintenance, Training and Consulting Services), End-User Industry (Oil and Gas, Power Generation, Food and Beverage, Pharmaceutical, Automotive, Other End-User Industries), and Geography (North America, South America, Europe, Asia-Pacific, Middle East and Africa). The Market Forecasts are Provided in Terms of Value (USD).
| Safety Sensors |
| Safety Controllers/Modules/Relays |
| Safety Switches |
| Programmable Safety Systems |
| Emergency Stop Devices |
| Final Control Elements |
| Other Device Types |
| Burner Management Systems |
| Turbomachinery Control Systems |
| High-Integrity Pressure Protection Systems |
| Fire and Gas Monitoring Control Systems |
| Emergency Shutdown Systems |
| Supervisory Control and Data Acquisition Systems |
| Distributed Control Systems |
| Testing, Inspection and Certification |
| Design, Engineering and Maintenance |
| Training and Consulting Services |
| Oil and Gas |
| Power Generation |
| Food and Beverage |
| Pharmaceutical |
| Automotive |
| Other End-User Industries |
| North America | United States | |
| Canada | ||
| Mexico | ||
| South America | Brazil | |
| Argentina | ||
| Rest of South America | ||
| Europe | United Kingdom | |
| Germany | ||
| France | ||
| Italy | ||
| Rest of Europe | ||
| Asia Pacific | China | |
| Japan | ||
| India | ||
| South Korea | ||
| Rest of Asia Pacific | ||
| Middle East and Africa | Middle East | United Arab Emirates |
| Saudi Arabia | ||
| Rest of Middle East | ||
| Africa | South Africa | |
| Egypt | ||
| Rest of Africa | ||
| By Device Type | Safety Sensors | ||
| Safety Controllers/Modules/Relays | |||
| Safety Switches | |||
| Programmable Safety Systems | |||
| Emergency Stop Devices | |||
| Final Control Elements | |||
| Other Device Types | |||
| By Safety Systems | Burner Management Systems | ||
| Turbomachinery Control Systems | |||
| High-Integrity Pressure Protection Systems | |||
| Fire and Gas Monitoring Control Systems | |||
| Emergency Shutdown Systems | |||
| Supervisory Control and Data Acquisition Systems | |||
| Distributed Control Systems | |||
| By Services | Testing, Inspection and Certification | ||
| Design, Engineering and Maintenance | |||
| Training and Consulting Services | |||
| By End-User Industry | Oil and Gas | ||
| Power Generation | |||
| Food and Beverage | |||
| Pharmaceutical | |||
| Automotive | |||
| Other End-User Industries | |||
| By Geography | North America | United States | |
| Canada | |||
| Mexico | |||
| South America | Brazil | ||
| Argentina | |||
| Rest of South America | |||
| Europe | United Kingdom | ||
| Germany | |||
| France | |||
| Italy | |||
| Rest of Europe | |||
| Asia Pacific | China | ||
| Japan | |||
| India | |||
| South Korea | |||
| Rest of Asia Pacific | |||
| Middle East and Africa | Middle East | United Arab Emirates | |
| Saudi Arabia | |||
| Rest of Middle East | |||
| Africa | South Africa | ||
| Egypt | |||
| Rest of Africa | |||


Key Questions Answered in the Report
How large will the functional safety market be by 2031?
It is forecast to reach USD 12.82 billion, expanding from USD 7.84 billion in 2026 at a 10.34% CAGR.
Which device type commands the highest share today?
Safety sensors led with 33.78% of 2025 revenue thanks to widespread retrofits in process and discrete manufacturing.
What is driving adoption of high-integrity pressure protection systems?
Methane-emission penalties in North America, Europe, and the Middle East reward operators that prevent flaring, propelling HIPPS to an 11.73% CAGR through 2031.
Why are SMEs turning to safety-as-a-service?
Subscription bundles cut annual compliance overhead by up to 30% and offset the shortage of certified safety engineers.
Which region is expected to grow fastest?
Asia-Pacific is projected to post an 11.39% CAGR, lifted by automation subsidies in China and India as well as semiconductor investment in Japan and South Korea.
How concentrated is supplier power in functional safety?
The combined share of the top five vendors sits near 50%, indicating a moderately concentrated yet still competitive landscape.
Page last updated on:


