
Fuel Card Market Size and Share
Market Overview
| Study Period | 2020 - 2031 |
|---|---|
| Market Size (2026) | USD 224.80 Billion |
| Market Size (2031) | USD 285.20 Billion |
| Growth Rate (2026 - 2031) | 4.90 % |
| Fastest Growing Market | Asia-Pacific |
| Largest Market | North America |
| Market Concentration | High |
Major Players *Disclaimer: Major Players sorted in no particular order Image © Mordor Intelligence. Reuse requires attribution under CC BY 4.0. | |
Fuel Card Market Analysis by Mordor Intelligence
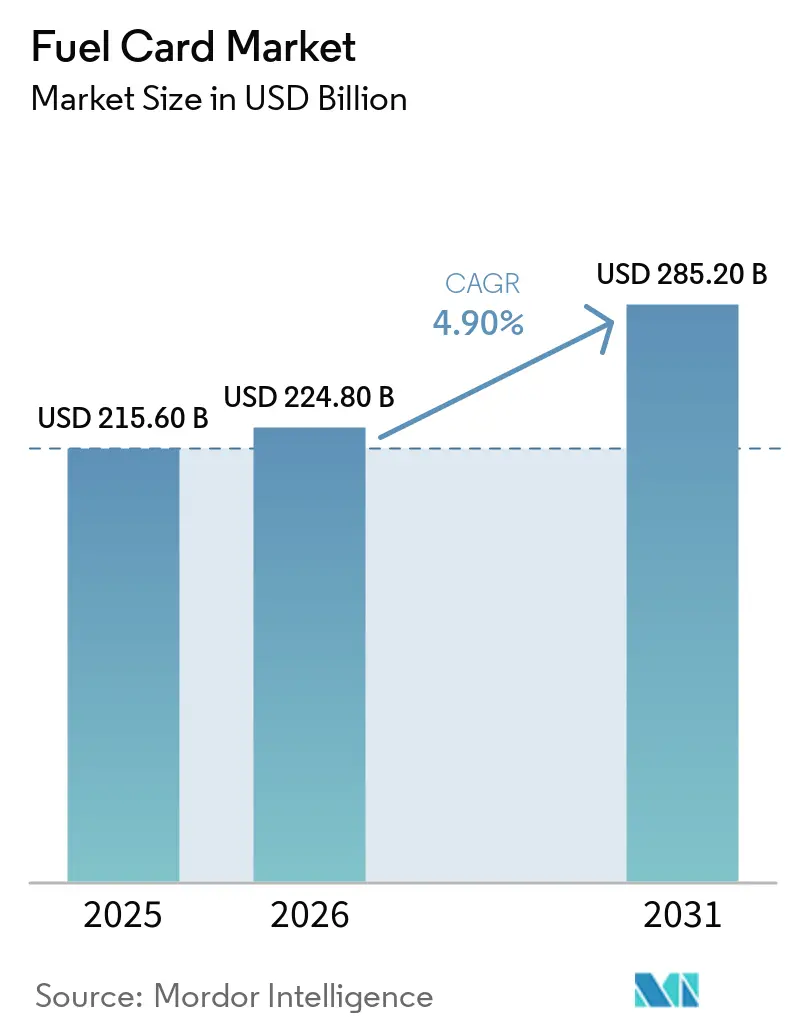
The fuel card market size was valued at USD 215.6 billion in 2025 and is estimated to grow from USD 224.8 billion in 2026 to reach USD 285.2 billion by 2031, at a CAGR of 4.9% during the forecast period (2026-2031). The fuel card market is supported by commercial fleets that need controlled purchasing, transaction records, and better oversight of fuel spending. Fleet operators are replacing cash purchases and receipt-based reimbursement with digital payment tools that provide clearer transaction visibility and spending controls. This shift also supports links between card payments and enterprise fleet systems, which makes fuel cards more useful in day-to-day fleet administration. Commercial vehicle activity and road-based logistics continue to create demand for managed refueling arrangements in established and developing transport markets. Competition is increasingly centered on payment data, telematics links, electric vehicle charging access, and the ability to combine several mobility expenses on a single invoice.
Key Report Takeaways
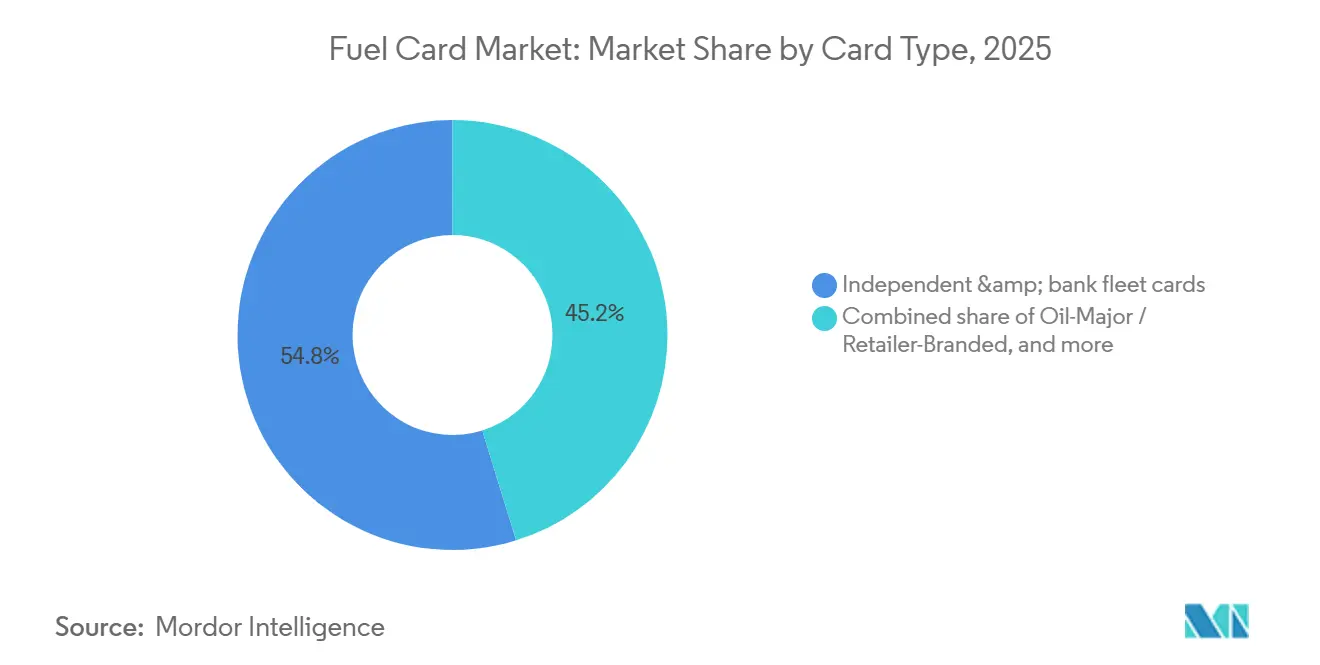
- By card type, independent and bank fleet cards captured 54.8% of the fuel card market share in 2025 and are projected to grow at a 5.6% CAGR through 2031.
- By vehicle type, heavy trucks and buses captured 62.3% of the fuel card market share in 2025, while light commercial vehicles are projected to grow at a 6.1% CAGR through 2031.
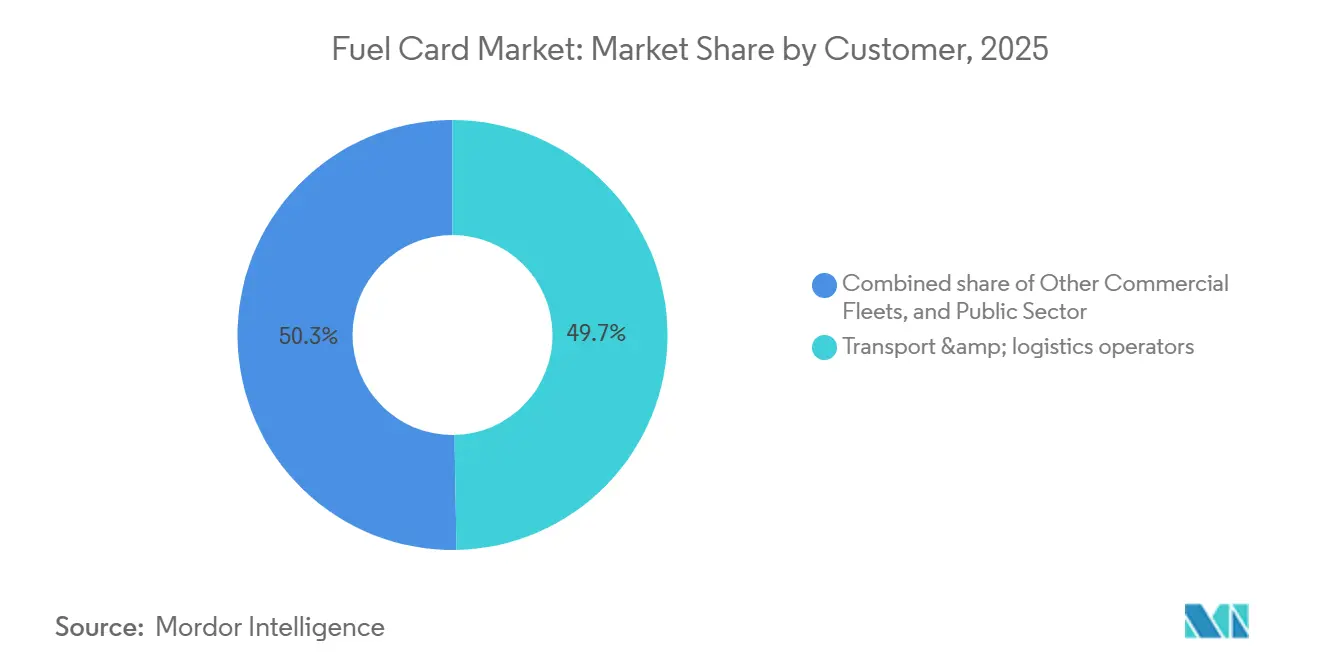
- By customer type, transport and logistics operators captured 49.7% of the fuel card market share in 2025, while the public sector is projected to grow at a 6.3% CAGR through 2031.
- By geography, North America captured 56.5% of the fuel card market share in 2025, while Asia-Pacific is projected to grow at a 7.8% CAGR through 2031.
Note: Market size and forecast figures in this report are generated using Mordor Intelligence’s proprietary estimation framework, updated with the latest available data and insights as of January 2026.
Global Fuel Card Market Trends and Insights
Drivers Impact Analysis*
| Driver | (~) % Impact on CAGR Forecast | Geographic Relevance | Impact Timeline |
|---|---|---|---|
| Commercial Fleet and Road Logistics Growth | +1.0% | Global | Short term (≤ 2 years) |
| Fleet Fuel Spend Control and Cost Visibility | +0.8% | Global | Short term (≤ 2 years) |
| Telematics and Fleet-System Integration | +0.7% | North America and European Union | Medium term (2-4 years) |
| Multi-Brand Acceptance Network Expansion | +0.6% | North America and European Union, expanding to Asia-Pacific | Medium term (2-4 years) |
| Integrated Fuel, Electric Vehicle Charging, and Mobility Payments | +0.5% | European Union, North America, and Asia-Pacific | Long term (≥ 4 years) |
| Real-Time Controls and Fraud Prevention | +0.4% | Global | Medium term (2-4 years) |
| Source: Mordor Intelligence | |||
Growth of Commercial Fleets and Road-Based Logistics Activity
Road freight activity and organized logistics remain a central source of demand for the fuel card market. Larger commercial fleets create more frequent fuel transactions and increase the need for controlled payment processes. India’s commercial vehicle sector is expected to reach 12.4 lakh units in fiscal 2027, supported by freight activity, easing interest rates, and improved purchase affordability after the September 2025 goods and services tax change[1]https://economictimes.indiatimes.com/industry/auto/lcv-hcv/indias-commercial-vehicle-volumes-to-hit-12-4-lakh-units-in-fy27-surpassing-previous-peak-crisil/articleshow/130513546.cms. In emerging markets, first-time adoption can occur when small operators move from cash spending to managed cards. This pattern gives the fuel card market access to new users rather than only replacement demand from existing cardholders.
Increasing Need for Fleet Fuel Spend Control and Cost Visibility
Fuel spending controls are a major reason that mid-sized fleets adopt card-based payment systems. Operators that rely on receipts and manual reconciliation have limited visibility into when, where, and how fuel was purchased. Transaction controls can include gallon limits, permitted purchase times, vehicle identification matching, and blocks on non-fuel spending. Shell stated that its Safer Payments system combines chip-enabled cards with real-time pattern recognition and AES and TLS encryption to identify suspicious activity before losses become systemic. As these features become more common, the fuel card market is serving fleet-management needs as well as payment needs.
Integration of Fuel Cards With Telematics and Fleet Management Systems
Telematics integration is making fuel card services more relevant to operators who manage complex fleets. Matching location, engine, and vehicle-utilization data with card transactions can help providers identify transactions that do not fit normal vehicle activity. WEX stated that SecureFuel checks real-time vehicle location and telematics data against a transaction before approval[2]https://www.wexinc.com/en-gb/resources/fleet/wex-adds-49-welcome-break-sites-to-growing-esso-uk-acceptance-network/. This approach can move fraud control from post-transaction review to prevention at the point of purchase. The fuel card market benefits when these connections reduce false declines for drivers making time-sensitive deliveries.
Increasing Demand for Integrated Fuel, Electric Vehicle Charging, and Mobility Payments
Commercial fleet electrification is increasing the demand for payment tools that cover more than conventional fuel. Fuel card providers already manage billing relationships, vehicle-level data, and merchant acceptance, which gives them a role in multi-energy payments. In January 2026, WEX introduced a fleet card that combined fuel and public electric vehicle charging payments within a single closed-loop network[3]https://ir.wexinc.com/news/news-details/2026/WEX-Unveils-First-of-its-Kind-Fleet-Card-Unifying-Fueling-and-Public-EV-Charging-Payments/default.aspx. The product supports one account and one invoice for internal-combustion, hybrid, and electric vehicles. The fuel card market can gain stronger customer retention when charging costs, fuel costs, and related fleet records are managed through the same platform.
Restraints Impact Analysis*
| Restraint | (~) % Impact on CAGR Forecast | Geographic Relevance | Impact Timeline |
|---|---|---|---|
| Cybersecurity, Data Privacy, and Payment-Data Risks | -0.5% | Global | Medium term (2-4 years) |
| Integration Complexity Across Payment, Station, and Fleet Systems | -0.4% | Global | Medium term (2-4 years) |
| Limited Network Coverage in Geographic and Cross-Border Corridors | -0.3% | Middle East and Africa, South America, and Asia-Pacific fringe markets | Long term (≥ 4 years) |
| Alternative Payment Channels and Margin Pressure | -0.3% | North America and European Union | Medium term (2-4 years) |
| Source: Mordor Intelligence | |||
Cybersecurity, Data Privacy and Payment-Data Risks
Fuel card networks hold payment information, vehicle data, and fleet-system records, which makes them a target for skimming, account takeover, and data theft. PCI DSS 4.0 became the active compliance standard for fuel retailers on March 31, 2025, with requirements that include multi-factor authentication and timely failure detection. Large providers can often absorb these requirements more easily than small issuers and independent fuel stations. Some smaller operators may move to hosted payment tools rather than fund their own compliant infrastructure. This can concentrate transaction data in fewer platforms and leave the fuel card market exposed to larger breach targets.
Integration Complexity Across Payment, Fuel-Station and Fleet Systems
Modern card deployments must connect payment networks, station point-of-sale systems, telematics applications, and enterprise management tools. These systems often use different data standards, contract terms, and update schedules. Integration delays can increase deployment costs and slow adoption among smaller fleets. The European Payments Council noted that the proposed European Union Payment Services Regulation includes measures for cross-border fraud intelligence sharing, while current data rules limit some sharing between payment providers. Limited acceptance coverage in some cross-border corridors and pricing pressure from alternative payment channels also restrict the fuel card market, especially for smaller providers.
*Our forecasts treat driver/restraint impacts as directional, not additive. The impact forecasts reflect baseline growth, mix effects, and variable interactions.
Segment Analysis
By Card Type: Independent Networks Hold a Broad-Acceptance Advantage
Independent and bank fleet cards captured 54.8% of segment revenue in 2025 and are forecast to grow at a 5.6% CAGR through 2031. Their position reflects fleet demand for broad acceptance and the ability to choose refueling locations by price and route requirements. Open and semi-open payment models give fleet managers more choice than restricted oil-major networks. AtoB offers a Mastercard-based fuel card that it says delivers an average diesel saving of USD 0.42 per gallon and is accepted wherever Mastercard is accepted in the United States. These offers target small and medium-sized fleets and owner-operators that were less well served by legacy closed-loop products.
Oil majors and retailer-branded cards remain important because they can pair loyalty programs with established station networks. In March 2025, Shell and WEX launched redesigned Shell Card Business products that covered 95% of United States gas stations and included access to several electric vehicle charging networks. Government programs are a smaller but durable part of the fuel card industry because public procurement creates multiyear contract structures. The United Kingdom Government Commercial Agency’s Fuel Cards and Associated Services VII framework runs from February 2026 to February 2030 and is available to central government, health authorities, local bodies, and emergency services. Security and data-sharing requirements may reduce differences between card types on compliance, while preserving an advantage for providers with strong transaction data.


By Vehicle: Heavy Transport Generates Spend While Light Vehicles Grow Faster
Heavy trucks and buses captured 62.3% of the fuel card market size by vehicle revenue in 2025. Their large share reflects the greater fuel use associated with long-haul freight and passenger transport. WEX launched the Esso Card Truck in the United Kingdom in May 2026 with fixed weekly fuel pricing, dedicated heavy goods vehicle lanes, and HMRC-compliant digital invoicing across more than 1,400 Esso forecourts. Heavy vehicle customers also need toll management, tax-recovery support, and fleet administration alongside refueling access. These requirements encourage providers to develop broader operating platforms rather than stand-alone payment cards.
Light commercial vehicles are the fastest-growing vehicle group, with a forecast CAGR of 6.1% from 2026 to 2031. E-commerce delivery activity and the electrification of urban vans support demand for flexible payment arrangements. The fuel card industry can serve this group through combined fuel and charging products that match mixed vehicle fleets. Company cars and gray fleets remain the smallest vehicle category. Corporate expense cards and virtual cards are increasingly used for irregular fuel reimbursement, which may limit demand for dedicated cards in this part of the fuel card market.
By Customer: Logistics Operators Remain the Largest Users
Transport and logistics operators captured 49.7% of the fuel card market size by customer revenue in 2025. High fleet density and fuel-intensive operations create higher annual spending per card than in many general commercial fleets. Combined card and telematics data can support route planning and help managers compare fuel prices across an accepted station network. Cross-border operators also value transaction records that support tax and administrative processes. These operating needs keep logistics firms at the center of the fuel card market.
The public sector is forecast to grow at a 6.3% CAGR from 2026 to 2031. Government fleet digitization, decarbonization commitments, and structured procurement programs reduce administrative barriers to adoption. The United Kingdom framework for Fuel Cards and Associated Services VII formalizes card purchasing across central government, health, local, and emergency-service fleets. Other commercial fleets include construction, utilities, agriculture, and distribution businesses. These groups can offer expansion potential because their telematics use remains lower and their payment processes are less standardized than those of large logistics fleets.
Geography Analysis
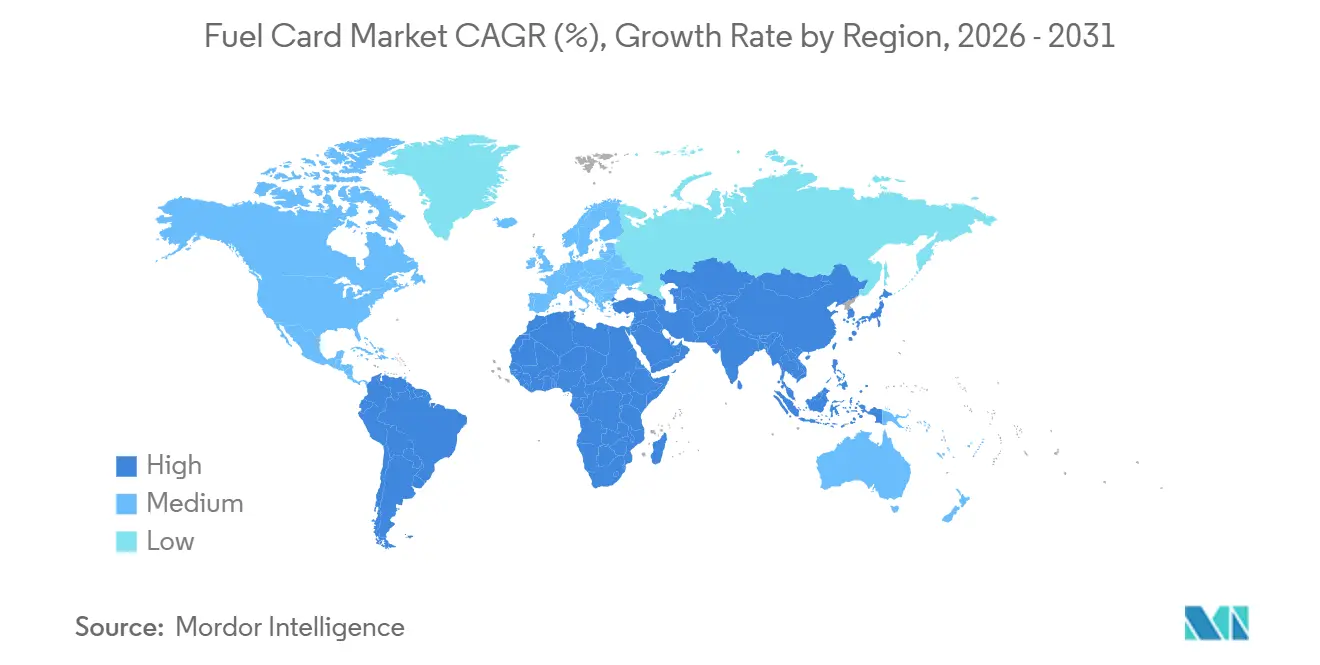
North America captured 56.5% of the fuel card market share in 2025. Its position rests on a large commercial fleet base, high fleet card penetration, and specialist payment networks. The United States General Services Administration uses WEX Fleet Cards across agencies, including Commerce, State, Homeland Security, and Agriculture. This form of institutional procurement reinforces the position of established providers in the United States. Canada and Mexico add demand through cross-border freight corridors and regional fleet operations.
Europe is a high-value part of the fuel card market because dense cross-border trucking creates demand for tax recovery, toll services, and multicurrency billing. Fleet operators often assess card offerings on these functions as well as fuel discounts. The region also has a strong need for payment security and fraud intelligence sharing across national borders. The European Payments Council identified cross-border fraud intelligence sharing as an issue that the proposed Payment Services Regulation seeks to address. Integrated providers can benefit when they combine fuel payments with tax, toll, and fleet-management functions.
Asia-Pacific is forecast to grow at a 7.8% CAGR from 2026 to 2031, making it the fastest-growing regional part of the fuel card market. China, India, and Southeast Asia each support demand through commercial vehicle activity and growing logistics networks. India’s fiscal 2027 commercial vehicle outlook points to 12.4 lakh units, which supports a wider base for organized fleet purchasing. The Middle East and Africa include developed fleet payment markets in Saudi Arabia and the United Arab Emirates, where logistics hubs and government-linked fleets support usage. Network limitations in sub-Saharan Africa and some cross-border corridors still limit wider penetration.

Competitive Landscape
The fuel card market has concentrated global leaders and a fragmented regional and small-fleet field. WEX, Corpay, DKV Mobility, and Eurowag compete as integrated payment platforms, while Shell, BP, ExxonMobil, TotalEnergies, Chevron, and Repsol operate branded card programs. Integrated platforms are adding electric vehicle charging, toll management, and fleet data capabilities. Oil majors are using payment partnerships to extend acceptance and modernize their products. This structure leaves room for local specialists and financial technology providers that focus on smaller fleets.
DKV Mobility acquired Dutch fuel and charge-card provider MKB Brandstof in May 2026. The acquisition added 115,000 fleet cards and 55,000 small and medium-sized business customers to DKV Mobility’s Benelux position. The deal also extended access to 76,000 fueling stations and more than 1 million charge points across Europe. WEX launched a unified fuel and public charging card in January 2026, covering more than 175,000 charging ports and over 90% of United States gas stations. These moves show how the fuel card market is moving toward wider mobility-payment coverage.
Smaller fleets remain an important competitive area because they may prefer open-loop cards with broad acceptance and direct savings. AtoB’s Mastercard-based offering focuses on this group and reports average diesel savings of USD 0.42 per gallon. Shell and WEX redesigned their United States card products in 2025 with access to 95% of gas stations and multiple charging networks. Eurowag and FincoEnergies introduced Biofuel Swap in March 2026 as a virtual hydrotreated vegetable oil decarbonization service within Eurowag’s digital mobility ecosystem.
Fuel Card Industry Leaders
Corpay, Inc.
WEX Inc.
Shell plc
BP p.l.c.
Exxon Mobil Corporation
- *Disclaimer: Major Players sorted in no particular order


Recent Industry Developments
- August 2026: WEX expanded the Esso Card acceptance network in the United Kingdom by adding 49 Welcome Break motorway service locations, including approximately 44 sites with dedicated HGV facilities, building on the May 2026 launch of the Esso Card Truck and extending total United Kingdom coverage to over 3,600 filling stations.
- May 2026: DKV Mobility acquired MKB Brandstof, a Dutch fuel and charge card provider with approximately 115,000 fleet cards and approximately 55,000 SME customers, adding access to approximately 76,000 fueling stations and over 1 million charge points across Europe to DKV’s Benelux presence.
- March 2026: Eurowag and FincoEnergies launched Biofuel Swap, a virtual HVO decarbonisation service integrated into Eurowag's digital mobility ecosystem, allowing European transport companies to achieve certified CO₂ reductions without changing operations, fueling stations, or vehicles.
- January 2026: WEX unveiled the first fleet card combining traditional fuel and public EV charging payments on a single closed-loop network, supporting ICE, hybrid, and EV vehicles on one account and one invoice across 175,000+ charging ports and 90%+ of United States gas stations.


Global Fuel Card Market Report Scope
| Oil-Major/Retailer-Branded |
| Independent & Bank Fleet Cards |
| Government Programmes |
| Heavy Trucks and Buses |
| Light Commercial Vehicles (Vans, Pickups) |
| Company Cars/Grey Fleet |
| Transport & Logistics Operators |
| Other Commercial Fleets (Construction, Industry, Distribution, Utilities, Agriculture) |
| Public Sector |
| North America | United States |
| Canada | |
| Mexico | |
| South America | Brazil |
| Argentina | |
| Rest of South America | |
| Europe | United Kingdom |
| Germany | |
| France | |
| Italy | |
| Spain | |
| Rest of Europe | |
| Asia-Pacific | China |
| Japan | |
| India | |
| South Korea | |
| Australia | |
| Indonesia | |
| Thailand | |
| Malaysia | |
| Singapore | |
| Vietnam | |
| Rest of Asia-Pacific | |
| Middle East and Africa | Saudi Arabia |
| United Arab Emirates | |
| Turkey | |
| South Africa | |
| Egypt | |
| Rest of Middle East and Africa |
| By Card Type | Oil-Major/Retailer-Branded | |
| Independent & Bank Fleet Cards | ||
| Government Programmes | ||
| By Vehicle | Heavy Trucks and Buses | |
| Light Commercial Vehicles (Vans, Pickups) | ||
| Company Cars/Grey Fleet | ||
| By Customer | Transport & Logistics Operators | |
| Other Commercial Fleets (Construction, Industry, Distribution, Utilities, Agriculture) | ||
| Public Sector | ||
| By Geography | North America | United States |
| Canada | ||
| Mexico | ||
| South America | Brazil | |
| Argentina | ||
| Rest of South America | ||
| Europe | United Kingdom | |
| Germany | ||
| France | ||
| Italy | ||
| Spain | ||
| Rest of Europe | ||
| Asia-Pacific | China | |
| Japan | ||
| India | ||
| South Korea | ||
| Australia | ||
| Indonesia | ||
| Thailand | ||
| Malaysia | ||
| Singapore | ||
| Vietnam | ||
| Rest of Asia-Pacific | ||
| Middle East and Africa | Saudi Arabia | |
| United Arab Emirates | ||
| Turkey | ||
| South Africa | ||
| Egypt | ||
| Rest of Middle East and Africa | ||


Key Questions Answered in the Report
What is driving fuel card adoption among fleet operators?
Digital spending controls, wider merchant acceptance, telematics links, and combined fuel and charging payments support adoption. These functions give managers clearer transaction records and more control over fleet expenditure.
How large is the fuel card market in 2026?
The fuel card market size is estimated at USD 224.8 billion in 2026 and is forecast to reach USD 285.2 billion by 2031. The forecast period CAGR is 4.9%.
Which card type leads fuel card use?
Independent and bank fleet cards held 54.8% of 2025 revenue and are projected to grow at a 5.6% CAGR through 2031. Broad acceptance supports their position with varied fleet operators.
Which vehicles create the most fuel card spending?
Heavy trucks and buses held 62.3% of 2025 vehicle revenue because of intensive fuel use in freight and passenger transport. Light commercial vehicles have the highest projected growth rate at 6.1%.
Which region has the strongest fuel card demand?
North America held 56.5% of 2025 revenue, while Asia-Pacific is projected to expand at a 7.8% CAGR through 2031. Cross-border freight and fleet formalization influence regional demand.
How are electric vehicles affecting fleet payment products?
Providers are adding public charging access to fuel cards so mixed internal-combustion, hybrid, and electric fleets can use one account and invoice. This reduces administrative complexity for operators managing more than one energy source.
Page last updated on:





