Market Overview
| Study Period | 2020 - 2031 |
|---|---|
| Forecast Data Period | 2026 - 2031 |
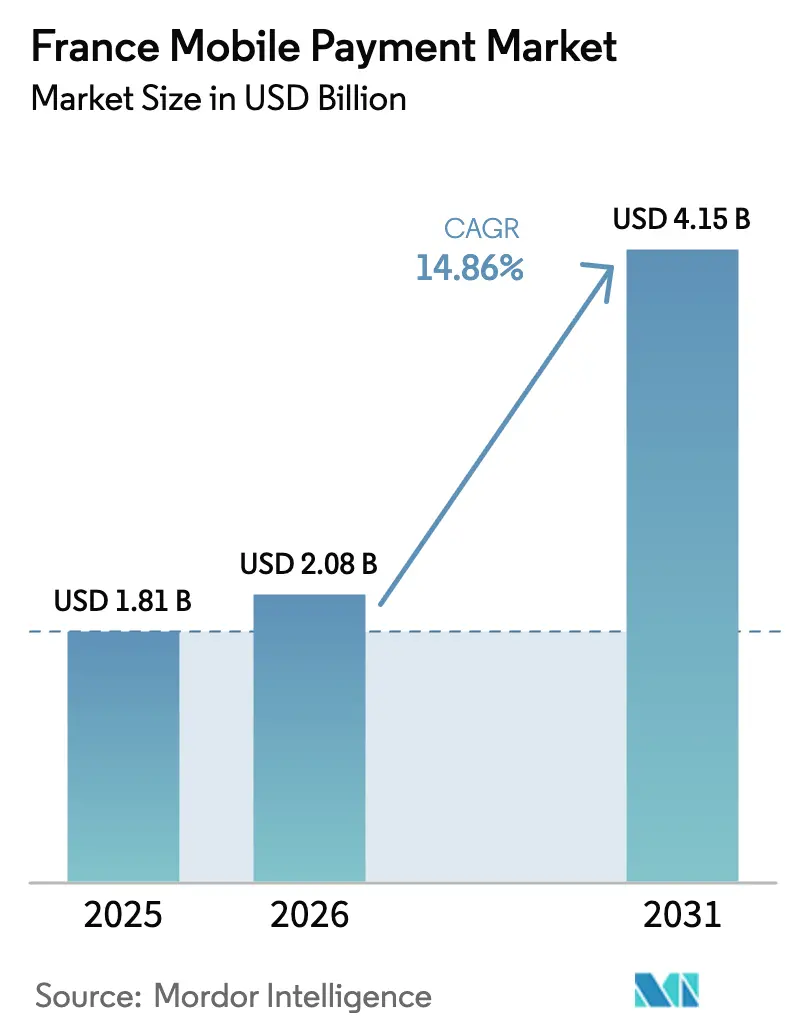
| Base Year Market Size (2025) | USD 1.81 Billion |
| Market Size (2026) | USD 2.08 Billion |
| Market Size (2031) | USD 4.15 Billion |
| Growth Rate (2026 - 2031) | 14.86% CAGR |
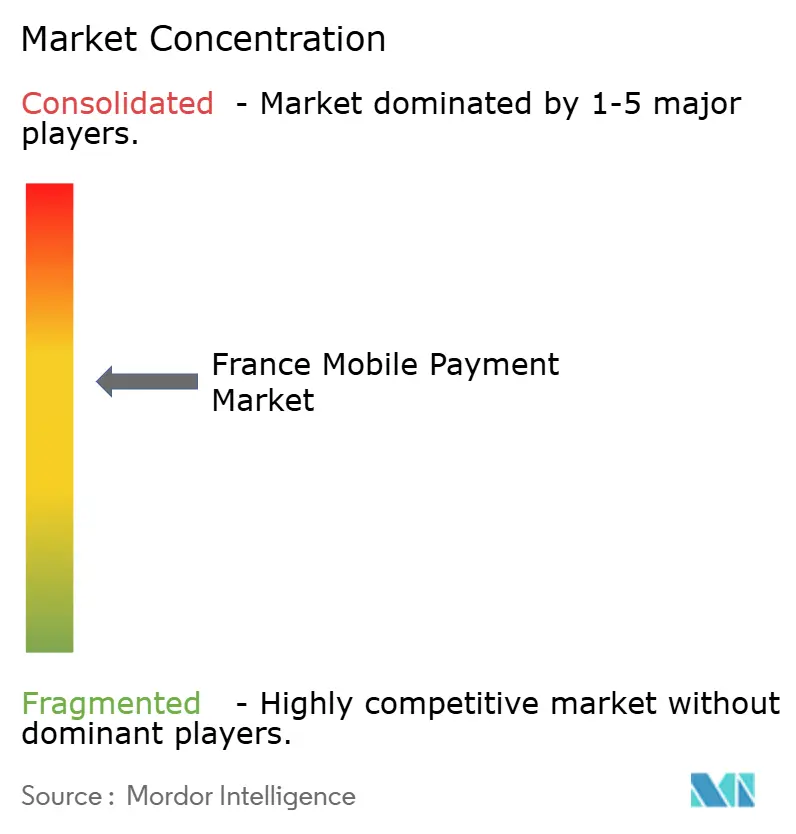
| Market Concentration | Medium |
Major Players*Disclaimer: Major Players sorted in no particular order Image © Mordor Intelligence. Reuse requires attribution under CC BY 4.0. | |
France Mobile Payment Market Analysis by Mordor Intelligence
The France mobile payment market size was valued at USD 1.81 billion in 2025 and estimated to grow from USD 2.08 billion in 2026 to reach USD 4.15 billion by 2031, at a CAGR of 14.86% during the forecast period (2026-2031). The France mobile payment market is benefiting from the country’s rapid move toward cash-free commerce, with card payments overtaking cash for the first time in 2024 and contactless volumes doubling in two years. Ongoing expansion of NFC terminals, accelerating e-commerce, and supportive open-banking rules are reinforcing demand, while biometric security advances are lowering fraud-related friction. European payment-sovereignty efforts such as Wero add fresh competitive energy, and SoftPOS roll-outs are widening acceptance among micro-merchants, broadening the France mobile payment market’s addressable base. Increasing instant-payment rails will further catalyze growth, positioning domestic providers to compete more evenly with global wallets.
Key Report Takeaways
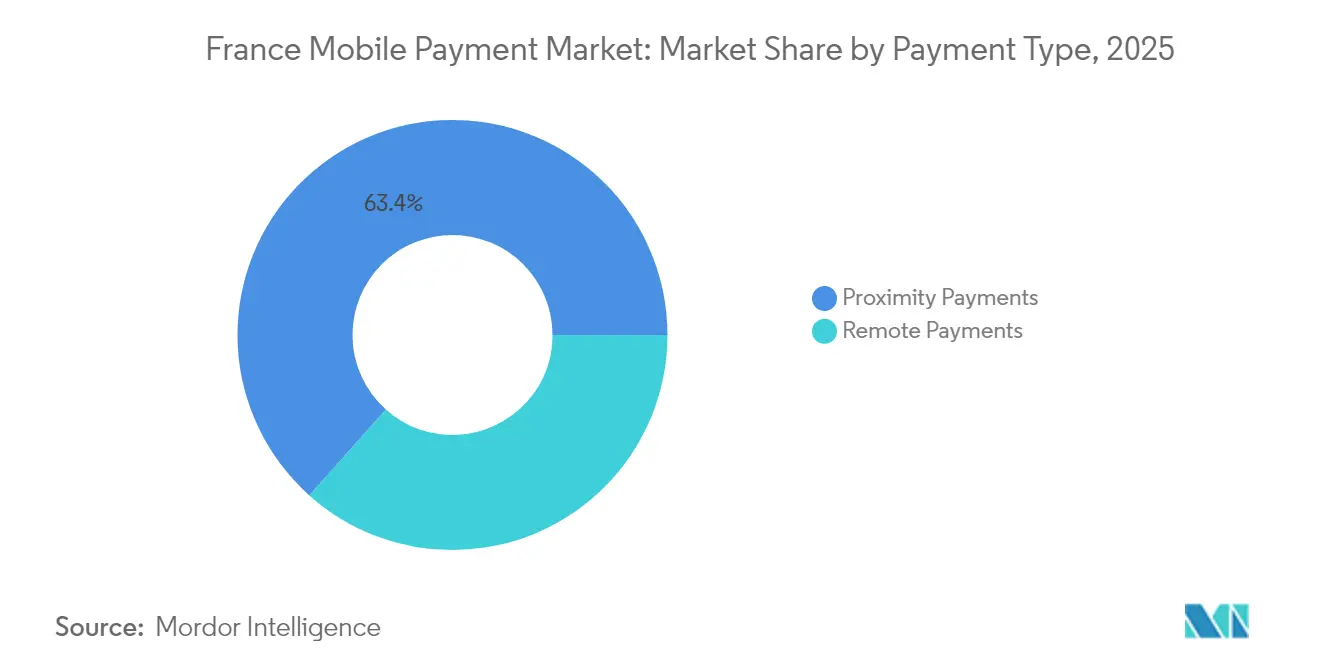
- By payment type, proximity services led with 63.40% revenue share in 2025, whereas remote services are forecast to expand at a 18.08% CAGR to 2031.
- By transaction type, P2P commanded 53.20% of the France mobile payment market share in 2025, while in-store POS is projected to grow fastest at 17.12% through 2031.
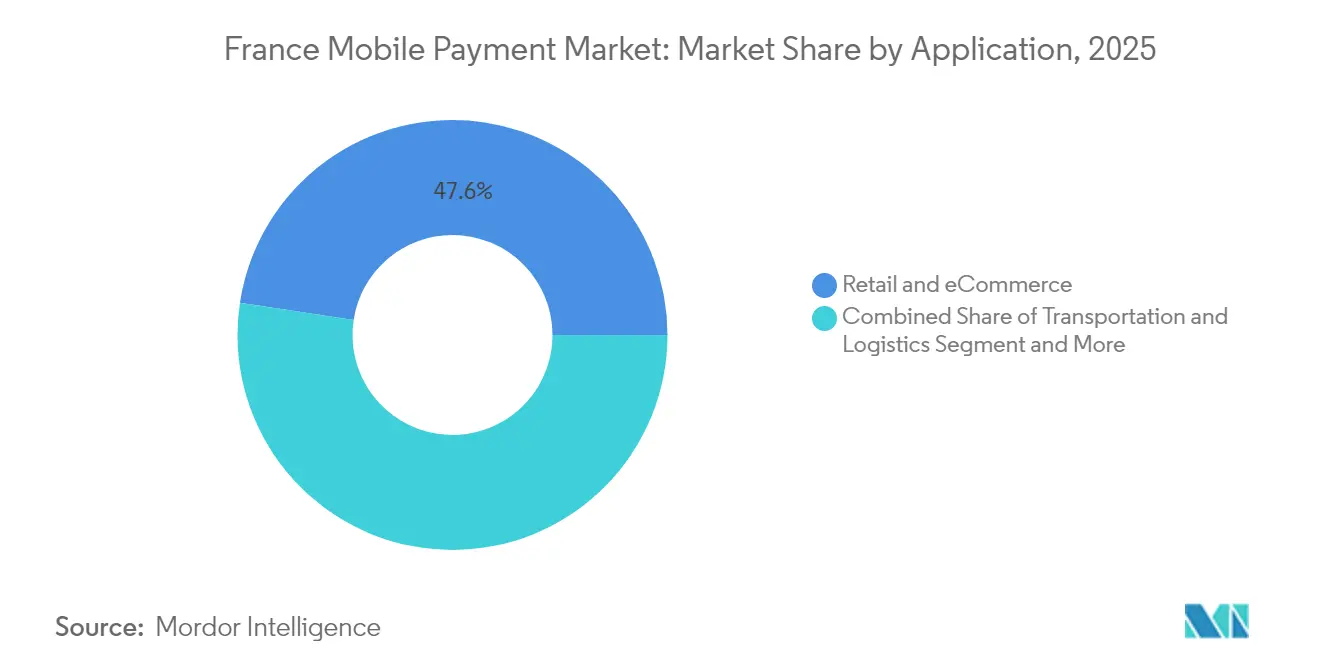
- By application, retail and e-commerce accounted for 47.60% of the France mobile payment market size in 2025; transportation and logistics is advancing at a 19.24% CAGR to 2031.
- By end-user, personal customers held 81.20% share in 2025, yet business adoption is rising at 16.18% CAGR as firms digitize B2B payments.
Note: Market size and forecast figures in this report are generated using Mordor Intelligence’s proprietary estimation framework, updated with the latest available data and insights as of 2026.
France Mobile Payment Market Trends and Insights
Drivers Impact Analysis*
| Driver | (~) % Impact on CAGR Forecast | Geographic Relevance | Impact Timeline |
|---|---|---|---|
| Rising internet penetration and booming e-commerce | 6.1% | National, with higher impact in urban centers | Short term (≤ 2 years) |
| Widespread NFC/contactless infrastructure across French retail | 4.5% | National, with concentration in major cities | Short term (≤ 2 years) |
| PSD2-driven open-banking and government cashless push | 3.8% | National, aligned with EU regulations | Medium term (2-4 years) |
| FIDO2 biometrics slash fraud and friction | 3.0% | National, with early adoption in banking sector | Medium term (2-4 years) |
| SoftPOS roll-outs unlock long-tail micro-merchants | 2.3% | National, with higher impact in rural areas | Long term (≥ 4 years) |
| Source: Mordor Intelligence | |||
Rising Internet Penetration and Booming E-commerce
Internet reach climbed to 88% of France’s population in 2024, and mobile commerce already represents 55% of online shopping, five points higher than in 2023. [2]Quable, “e-Commerce Figures for France: H1 2024,” quable.com The momentum placed EUR 150 billion (USD 162 billion) of web sales in 2024, generated by 2.3 billion transactions. Younger cohorts are shifting decisively to apps, with buyers aged 18-24 now 22% of all online shoppers, creating a receptive pool for mobile wallets. Retailers are responding by integrating one-click checkout and tokenized credentials that convert browsing into sales with minimal friction. As French e-commerce is forecast to grow 8-10% annually through 2030, the trend underpins sustained expansion of the France mobile payment market.
Widespread NFC/Contactless Infrastructure Across French Retail
Every active terminal on the Cartes Bancaires network now supports contactless, generating 15 billion transactions worth EUR 685 billion (USD 739 billion) in 2022. [4]Stripe, “A Guide to Cartes Bancaires,” stripe.com The permanent rise in contactless limits to EUR 50 (USD 54) normalized tap-and-go habits and doubled mobile-wallet usage in just two years. Global wallets leverage the same infrastructure, removing the need for merchants to invest in new hardware and accelerating acceptance across 1.5 million French points of sale. NFC ubiquity also enables SoftPOS, letting micro-merchants accept payments on smartphones, widening geographic coverage and reinforcing customer expectations of instant, seamless checkout. Combined, these shifts propel consumer familiarity and reliance on the France mobile payment market.
PSD2-Driven Open Banking and Government Cashless Push
Revised PSD2 rules unlocked account-to-account transfers and encouraged data-sharing APIs, moving open-banking user penetration from 8.5% in 2021 toward an expected 36% by 2027. Banks must process SEPA Instant payments at zero extra cost from 2025, trimming settlement times from days to seconds and making mobile options materially more attractive. The Banque de France’s National Retail Payments Strategy for 2025-2030 concentrates on innovation, fraud prevention and B2B modernization. [1]Banque de France, “French People Still Value Cash, Despite Using It Less,” banque-france.fr These coordinated initiatives improve the regulatory certainty that corporates and fintechs require to scale, anchoring growth prospects for France mobile payment market services across consumer and enterprise contexts.
FIDO2 Biometrics Slash Fraud and Friction
Adoption of FIDO2 standards cut mobile-payment fraud to 0.021% in 2023, two-thirds lower than the prior year and well beneath card fraud rates. ANSSI endorses FIDO tokens within its Zero Trust framework, boosting institutional confidence. Thales’ OneWelcome platform allows issuers to lifecycle-manage passkeys at scale, converting strong customer authentication from a compliance cost to a competitive differentiator. Reliable biometrics encourage higher transaction values via mobile wallets, strengthen user trust, and sharpen the value proposition of domestic providers determined to rival big-tech incumbents.
Restraints Impact Analysis*
| Restraint | (~) % Impact on CAGR Forecast | Geographic Relevance | Impact Timeline |
|---|---|---|---|
| Persistent fraud and privacy concerns among older users | -3.8% | National, more pronounced in rural areas | Medium term (2-4 years) |
| Interchange-fee caps squeeze provider margins | -3.0% | National, aligned with EU regulations | Long term (≥ 4 years) |
| Fragmented QR standards hinder remote in-store uptake | -2.3% | National, with higher impact in tourist areas | Medium term (2-4 years) |
| Limited offline-ready functionality in rural zones | -1.5% | Rural areas with limited connectivity | Short term (≤ 2 years) |
| Source: Mordor Intelligence | |||
Persistent Fraud and Privacy Concerns Among Older Users
The 2024 ECB SPACE survey found 58% of respondents still uneasy about digital-payment privacy, with anxiety highest in the 55-plus bracket. [3]European Central Bank, “Study on Payment Attitudes of Consumers 2024,” ecb.europa.eu Regulators reacted by ordering velocity caps that shrink from EUR 500 (USD 540) in June 2024 to EUR 0.01 (USD 0.01) by January 2026 for suspect transactions. While protective, these measures may add steps at checkout, slowing uptake among demographics already reluctant to adopt mobile wallets. Targeted education campaigns and simplified biometric flows are required to neutralize perception gaps and sustain progress within the France mobile payment market.
Interchange-Fee Caps Squeeze Provider Margins
EU rules cap interchange at 0.2% for debit and 0.3% for credit, curtailing revenue and potentially damping investment capacity in emerging features. In France, prior Competition Authority rulings already forced Visa and Mastercard below 0.28%. Providers respond by lifting merchant-service charges—from 0.27% to 0.44% between 2018 and 2022—yet smaller fintechs often lack scale to absorb margin pressure. Consolidation or multi-service platform strategies may follow, reshaping the competitive field of the France mobile payment market over the forecast horizon.
*Our forecasts treat driver/restraint impacts as directional, not additive. The impact forecasts reflect baseline growth, mix effects, and variable interactions.
Segment Analysis
By Payment Type: Proximity Dominates While Remote Accelerates
Proximity payments captured 63.40% of turnover in 2025 because the nationwide NFC backbone translates existing tap habits directly to mobile wallets. The France mobile payment market size attributed to this segment is projected to advance steadily at high-single-digit rates as shoppers favor convenience during everyday purchases. Widespread NFC support across 1.5 million terminals, plus SoftPOS adoption among micro-enterprises, enlarges acceptance points well beyond the hypermarket channel. Parallel roll-outs of Tap-to-Pay on iPhone and Android keep hardware upgrade needs minimal, protecting merchant economics.
Remote payments presently hold a smaller share, yet their 18.08% CAGR to 2031 signals outsized momentum. Surging mobile-commerce volumes and embedded biometrics mitigate historical security worries, pulling higher-ticket discretionary items online. One-click A2A flows, supported by PSD2 APIs, further trim scheme fees, nudging enterprises toward direct bank-based checkouts. With mobile app shopping already 55% of e-commerce, remote flows will gradually rebalance transaction mix inside the France mobile payment market.


By Transaction Type: P2P Leads While In-store POS Gains Momentum
Peer-to-peer transfers retained 53.20% share in 2025, helped by Wero’s instant A2A feature delivered through large French banks’ apps. The France mobile payment market share dominance in this use case stems from consumer familiarity and fee-free settlement, supported by real-time RIB lookup. Youth cohorts view phone-number transfers as the normative alternative to cash, and transaction frequency rises during high-spending social periods such as vacation seasons.
In-store POS flows are catching up, expected to compound at 17.12% through 2031. Retailers now combine NFC acceptance with loyalty integration, accelerating wallet uptake at checkout. Merchant enthusiasm is boosted when SoftPOS replaces standalone terminals, removing leasing costs and simplifying updates. As the digital euro lab tests programmable features, future store transactions may embed conditional coupons or split payments, widening utility and volume captured by the France mobile payment market.
By Application: Retail Dominates While Transportation Accelerates
Retail and e-commerce contributed 47.60% of 2025 revenue. High cart-conversion rates derive from stored credentials, tokenized card security and buy-now-pay-later orchestration. An estimated 65% of consumers used a digital wallet at least once in 2023. Omnichannel sellers synchronize online and in-store interaction, reinforcing repeat behavior and deepening engagement.
Transportation and logistics is the fastest-moving vertical, with a 19.24% CAGR outlook as operators replace closed-loop tickets with EMV and mobile wallets. Rennes Métropole’s EMV validators already accept Apple Pay and Samsung Pay for 353,000 daily riders. Logistics providers deploy Tap-on-Mobile for delivery-fee collection, erasing cash handling and improving reconciliation. These innovations elevate the France mobile payment market size within transit and shipping scenarios.
By End-user: Personal Users Dominate While Business Adoption Accelerates
Personal users represented 81.20% of transaction value in 2025, reflecting consumer-centric wallet promotion by handset makers and banks. Frequent low-value use cases such as coffee shops, transit rides, and bill splits entrench daily reliance. Apple Pay’s in-store utilization reached about 60% among wallet users by early 2024.
Business users are gathering pace, with 16.18% CAGR projected. Stablecoins offer 24/7 settlement and up to 80% cost savings in cross-border B2B, wooing exporters and freelancers. France’s mandatory e-invoicing roll-out from 2026 obliges corporates to digitize AR/AP workflows, naturally linking invoice and payment data. Ethical challenger Qileo embeds eco card rails into expense management, exemplifying how niche value propositions can open new corridors within the broader France mobile payment industry.
Geography Analysis
Urban France, especially the Paris-Lyon-Marseille triangle, accounts for the highest concentration of NFC terminals and mobile wallet penetration. Metropolitan consumers shifted decisively toward cashless modes when card transactions reached 48% of point-of-sale sales against cash’s 43% in 2024. The France mobile payment market size in these dense zones is forecast to expand faster than the national average, thanks to multi-modal transit wallets and high smartphone ownership.
Secondary cities such as Rennes, Lille, and Toulouse are posting double-digit growth because public transport operators migrate to contactless EMV and SoftPOS, unlocks acceptance for small merchants. Rural departments lag in connectivity, yet Tap-to-Phone eliminates hardware costs, signaling a potential closing of the adoption gap by the end of the decade. The government plans to improve 5G coverage to 95% of the population by 2027 will further democratize access.
France’s position inside Europe’s payment-sovereignty roadmap amplifies its influence. The digital euro innovation platform launched in May 2025 involves 70 private-sector participants, many headquartered in France, experimenting with programmable money features. Cross-border use cases developed here will feed into eurozone-wide standards, extending domestic innovations abroad and feeding back learnings that stabilize the France mobile payment market.
Competitive Landscape
The market hosts a balanced field of global wallets, European alliances and domestic banks creating layered competition. Apple Pay and Google Pay enjoy hardware-ecosystem advantages, yet their pricing is under scrutiny as banks evaluate bilateral fee arrangements. Wero, championed by BNP Paribas, Crédit Agricole and Société Générale, represents Europe’s strategic bid for autonomy, promising QR and BNPL functions by 2026.
Traditional banks have responded with biometric cards and instant-credit overlays to preserve customer primacy. J.P. Morgan’s March 2025 membership of Cartes Bancaires underscores the attractiveness of France’s payments market for foreign incumbents seeking local processing efficiencies. Fintech specialists such as Lydia target niche demand, including social micro-payments and youth budgeting, while Swile captures employee-benefits flows. Strategic partnerships are common: Worldline integrates Tap-on-Mobile into GPX Logistics to cement enterprise relationships and diversify beyond acquiring fees.
Margin compression from interchange caps encourages scale-driven consolidation, making acquisition pipelines active. Providers broaden revenue via data-analytics services, BNPL orchestration, and cross-border remittance corridors. Banks ally with telcos and Big-Tech to share CapEx, while fintechs pivot toward software-as-a-service for merchants to offset tightening take rates. These strategies will likely sustain moderate fragmentation, yet the emergence of pan-European platforms could raise concentration scores after 2027 across the France mobile payment market.
France Mobile Payment Industry Leaders
Google LLC
PayPal Holdings, Inc.
Visa Inc.
Mastercard Incorporated
American Express Company
- *Disclaimer: Major Players sorted in no particular order

Recent Industry Developments
- May 2025: The European Central Bank convened 70 market participants to prototype digital-euro use cases, aiming to test conditional payments and inclusion solutions; the move positions banks and fintechs to pre-commercialize innovations once legal clarity emerges, giving first movers an experiential edge.
- April 2025: Buckaroo integrated Wero to offer merchants a seamless on-boarding path to the pan-European wallet; for Wero, adding a PSP with 30,000 European merchants accelerates network effects critical to challenging global incumbents.
- March 2025: J.P. Morgan became the first U.S. bank to join Cartes Bancaires, securing local processing capabilities that reduce cross-border interchange leakage and strengthen its merchant-acquiring proposition across France.
- February 2025: Thales launched OneWelcome FIDO Key Lifecycle Management, enabling large organizations to manage passkeys at scale; the service helps issuers align with PSD2 SCA rules while differentiating on user experience.


Research Methodology Framework and Report Scope
Market Definitions and Key Coverage
Our study defines the France mobile payment market as the total euro value of domestic transactions initiated by a smartphone, smart-watch, or other mobile device using near-field communication, QR codes, or in-app tokenized card and account-to-account rails across retail, transport, bill pay, and peer-to-peer settings. Business and consumer users are both captured, and values are reported at face value of payments rather than provider fee revenue.
(Scope exclusion: cross-border remittances completed through money-transfer operators and purely virtual in-game micro-payments are outside this assessment.)
Segmentation Overview
- By Payment Type
- Proximity Payments
- Remote Payments
- By Transaction Type
- Peer-to-Peer (P2P)
- In-store Point-of-Sale (POS)
- Person-to-Merchant (P2M/Checkout)
- Other Transaction Types
- By Application
- Retail and eCommerce
- Transportation and Logistics
- Hospitality and Food-Service
- Government and Public Sector
- Other Applications (Education, Healthcare)
- By End-user
- Personal
- Business
Detailed Research Methodology and Data Validation
Primary Research
Interviews with French card networks, super-apps, major grocers, and transit operators allowed us to test ATV, cash-to-digital substitution rates, and NFC terminal density assumptions across Ile-de-France, Auvergne-Rhone-Alpes, and two secondary regions. Follow-up surveys of urban Gen Z shoppers and small merchants helped reconcile wallet usage gaps identified in secondary data.
Desk Research
We began with government sources such as Banque de France payment statistics, INSEE household ICT surveys, and ARCEP smartphone penetration data, then overlaid insights from the European Central Bank's instant-payment dashboards and Cartes Bancaires annual reports. Reputable trade bodies, including France Num, Fevad, and the European Payments Council, helped us size e-commerce ticket values, while company filings and investor decks from acquirers and wallet providers supplied average transaction value (ATV) guidance. According to Mordor Intelligence internal subscription tools, D&B Hoovers for company financials and Dow Jones Factiva for real-time deal news, market share splits and product rollout timelines were further refined.
These sources illustrate our desk approach and are not exhaustive; many additional public releases, patents, and press archives were reviewed to validate datapoints and clarify definitions.
Market-Sizing & Forecasting
A top-down build starts with 2024 payment volume reported by Cartes Bancaires and regulated e-money institutions, which is then split by mobile share using smartphone penetration and wallet activation ratios. Bottom-up checks, sampled acquirer transaction counts multiplied by region-specific ATVs, anchor the totals. Key variables guiding the model include 4G/5G coverage, NFC-enabled POS share, e-commerce GMV, mandated instant-payment adoption under PSD2, and real disposable income growth. Forecasts to 2030 employ multivariate regression that links these drivers to historical mobile payment uptake, and scenario analysis adjusts for regulatory or fee-cap shifts. Data gaps in supplier roll-ups are bridged with channel-check ranges that are revisited once new filings surface.
Data Validation & Update Cycle
Analysts run variance checks against monthly central-bank payment releases; material deviations trigger re-contact of at least one primary respondent group before sign-off.
Each France update is refreshed annually, with interim briefs issued within six weeks of notable regulatory or wallet-launch events.
Why Our France Mobile Payment Baseline Inspires Confidence
Published figures often differ because firms apply contrasting scopes, base years, or price-point filters. We acknowledge those realities upfront and show where methods diverge before clients rely on any number.
Key gap drivers include whether peer-to-peer flows are counted, how micro-ticket transit rides are annualized, currency-conversion timing, and refresh cadence. Mordor's 2024 base, constant-currency treatment, and inclusion of account-to-account wallets produce a fuller view than studies that stop at card-token spend or rely solely on merchant surveys.
Benchmark comparison
| Market Size | Anonymized source | Primary gap driver |
|---|---|---|
| USD 1.81 B (2025) | Mordor Intelligence | - |
| USD 1.59 B (2024) | Global Consultancy A | Excludes P2P and transit micro-tickets; narrower business coverage |
| USD 1.39 B (2023) | Regional Firm B | Relies on limited bank disclosures, omits account-to-account wallets |
These contrasts show why, by selecting the right scope variables, applying dual cross-checks, and updating every year, Mordor analysts deliver the balanced baseline that French payment strategists can depend on.


Key Questions Answered in the Report
What is the current value of the France mobile payment market?
The market is worth USD 2.08 billion in 2026 and is set to reach USD 4.15 billion by 2031 at a 14.86% CAGR.
Which payment type holds the largest share in France?
Proximity payments account for 63.40% of transaction value, supported by extensive NFC infrastructure in retail outlets.
How fast is remote mobile payment expected to grow?
Remote payments are projected to expand at a 18.08% CAGR through 2031, driven by booming mobile commerce.
Why is transportation a high-growth application?
Contactless EMV roll-outs on public transit and Tap-on-Mobile deployments in logistics are producing a 19.24% CAGR in the segment.
What role does Wero play in the competitive landscape?
Wero is a pan-European wallet launched by major French and EU banks to enhance payment sovereignty and offer instant P2P and future QR features.
How are interchange-fee caps affecting providers?
Caps at 0.2% for debit and 0.3% for credit compress margins, prompting providers to diversify revenue and consider scale-driven consolidation.
Page last updated on:


