Market Overview
| Study Period | 2021 - 2031 |
|---|---|
| Market Size (2026) | USD 48.92 Billion |
| Market Size (2031) | USD 66.87 Billion |
| Growth Rate (2026 - 2031) | 6.45% CAGR |
| Fastest Growing Market | Asia Pacific |
| Largest Market | North America |
| Market Concentration | Medium |
Major Players *Disclaimer: Major Players sorted in no particular order Image © Mordor Intelligence. Reuse requires attribution under CC BY 4.0. | |

Fracking Chemicals Market Analysis by Mordor Intelligence
Fracking Chemicals Market size in 2026 is estimated at USD 48.92 billion, growing from 2025 value of USD 45.96 billion with 2031 projections showing USD 66.87 billion, growing at 6.45% CAGR over 2026-2031.
Widespread horizontal drilling, advanced slick-water systems, and greater recovery from shale formations underpin growth, while innovations in salt-tolerant polymers and AI-assisted fluid design steadily reduce operating costs. North America maintains its structural dominance on the back of mature infrastructure, whereas the Asia-Pacific region accelerates with pro-development policies, unconventional resource discoveries, and rising energy security priorities. Environmental compliance has prompted operators to shift decisively toward water-based fluids and the reuse of produced water, driving demand for friction reducers, scale inhibitors, and biodegradable biocides. Simultaneously, lithium-by-product extraction from produced water is opening auxiliary revenue streams that enhance project economics and influence chemical selection strategies.
Key Report Takeaways
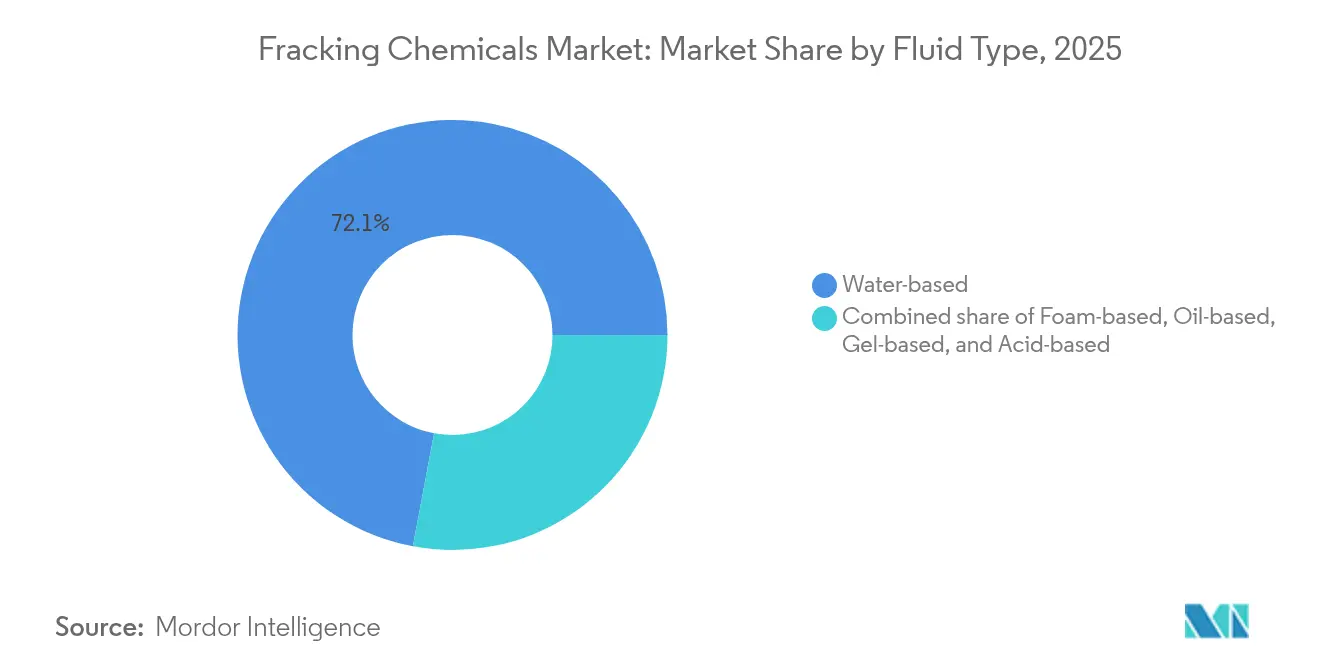
- By fluid type, water-based systems held 72.05% of the fracking chemicals market share in 2025, while foam-based systems are projected to expand at a 14.85% CAGR through 2031.
- By additive function, friction reducers led with 37.62% share of the fracking chemicals market size in 2025, whereas gelling agents are advancing at an 7.75% CAGR to 2031.
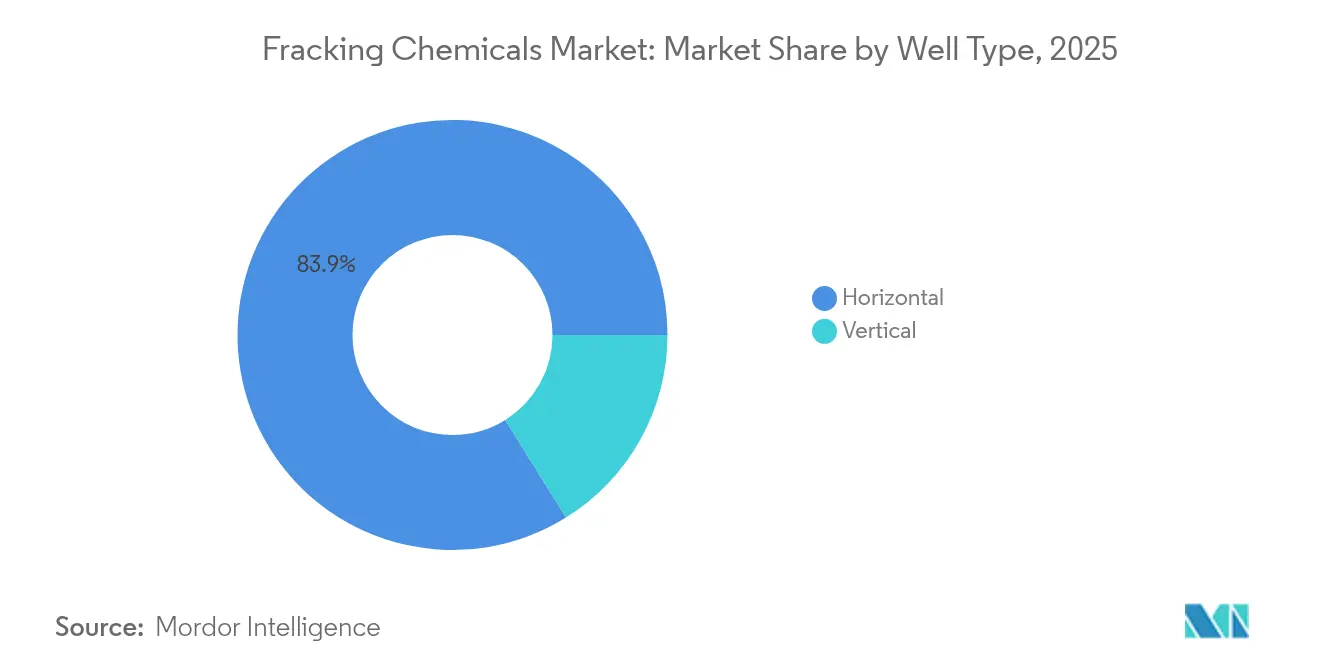
- By well type, horizontal wells accounted for 83.85% of the fracking chemicals market size in 2025 and are expected to continue growing at a 7.32% CAGR through 2031.
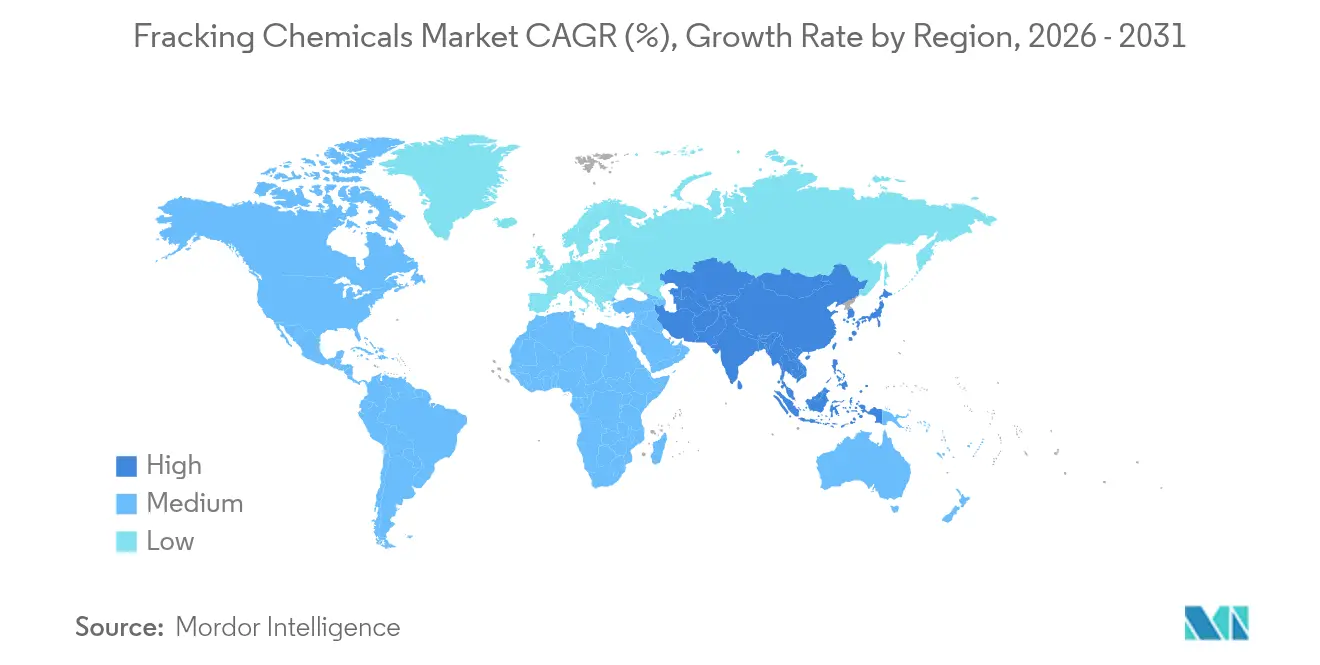
- By geography, North America captured 57.12% of fracking chemicals market share in 2025; Asia-Pacific is the fastest-growing region at an 8.05% CAGR to 2031
Note: Market size and forecast figures in this report are generated using Mordor Intelligence’s proprietary estimation framework, updated with the latest available data and insights as of 2026.
Global Fracking Chemicals Market Trends and Insights
Drivers Impact Analysis*
| Driver | (~) % Impact on CAGR Forecast | Geographic Relevance | Impact Timeline |
|---|---|---|---|
| Surge in horizontal drilling activity | 1.80% | Global; high in North America & Argentina | Medium term (2-4 years) |
| Growing demand for slick-water friction reducers | 1.20% | North America & Asia-Pacific; spill-over to MEA | Short term (≤ 2 years) |
| Expansion of shale development outside North America | 1.50% | APAC core; Latin America; Middle East emerging | Long term (≥ 4 years) |
| Re-fracturing of mature wells | 0.90% | North America; early gains in Eagle Ford & Permian | Medium term (2-4 years) |
| Lithium recovery from produced water initiatives | 0.70% | North America; concentrated in Pennsylvania & Texas | Long term (≥ 4 years) |
| AI-driven digital fluid-optimisation platforms | 0.60% | Global; early adoption in North America | Medium term (2-4 years) |
| Source: Mordor Intelligence | |||
Surge in Horizontal Drilling Activity
Rapid gains in drilling efficiency are translating into larger pad counts, longer laterals, and higher stage counts, collectively intensifying chemical consumption. Chevron’s triple-frac technology, applied to roughly half of its 2025 Permian wells, cut completion time by 25% and reduced per-well costs by 12%.[2]Reuters Staff, “Chevron’s Triple-Frac Cuts Completion Time in Permian,” reuters.com Multi-well simultaneous fracturing increases daily water and sand demand by approximately 60%, necessitating a corresponding rise in friction reducers, biocides, and scale inhibitors that can maintain performance under pumping pressures exceeding 10,000 psi. Operators in Canada, where wells drilled are forecast to reach 6,604 in 2025, are adopting similar practices to compensate for declines in legacy wells. Drilling contractors report that longer laterals elevate fluid friction, prompting higher dosages of slick-water additives to preserve pump rates. The spread of advanced completion designs into the Denver-Julesberg basin indicates that the growth dynamic is no longer confined to traditional shale heartlands.
Growing Demand for Slick-Water Friction Reducers
Polyacrylamide-based friction reducers now dominate additive spend because they maintain 65%–70% friction reduction even in produced-water salinities above 100,000 ppm total dissolved solids.[3]OnePetro Technical Paper SPE-204151-MS, “Salt-Tolerant Friction Reducers for Produced-Water Reuse,” onepetro.org Salt-tolerant chemistries enable operators to recycle on-site water, reducing freshwater withdrawals and trucking costs while maintaining constant pump horsepower. Field trials in low-permeability reservoirs demonstrate over 70% friction reduction without residual formation damage, thereby mitigating concerns about permeability impairment. The arrival of viscosity-building friction reducers blends slick-water and gel benefits, helping operators carry heavier proppant at elevated pumping rates. Demand is also buoyed by strict emission targets: slick-water systems require lower proppant concentrations than high-viscosity gels, which translates into shorter on-site times and lower diesel consumption.
Expansion of Shale Development Outside North America
Argentina’s Vaca Muerta completed 14,722 fracture stages in 2023, up 17.6% year on year, with a 2024 target of 18,000 stages. Saudi Arabia has demonstrated that proppant fracturing is effective in unconventional carbonate source rocks by utilizing seawater-based fluids designed to withstand high temperatures and pressures. China’s marine shale pilot wells in the Qiongzhusi formation are reporting gas flow rates comparable to those of early Barnett production, demonstrating effective technology transfer. As these basins accelerate, regional chemical suppliers must adapt to variable water chemistries, strict sourcing rules, and limited logistics. Long supply chains for guar, acrylamide, and specialty surfactants are driving joint ventures and local blending facilities across Asia-Pacific and the Middle East to mitigate cost volatility and customs delays.
Re-Fracturing of Mature Wells
Re-fracturing is increasingly favored over new drilling because existing surface infrastructure is already in place and reservoir pressure profiles are well understood. BPX Energy reported “triple-digit-plus” returns on Eagle Ford Shale refracs during 2024, supported by significant estimated ultimate recovery uplifts. Advanced diverting agents segment existing fractures, enabling operators to contact untouched pay zones without milling original plugs. The technique also uses tailored slick-water systems featuring modified breaker schedules to avoid prop washouts. Continuous pumping via coiled tubing eliminates time-consuming perforation swaps and maintains stable wellhead pressure, thereby further increasing additive throughput. As refracturing spreads to mature Bakken and Haynesville acreage, demand rises for chemicals engineered to navigate proppant-laden wellbores, re-establish conductivity, and inhibit scale in aged tubulars.
Restraints Impact Analysis*
| Restraint | (~) % Impact on CAGR Forecast | Geographic Relevance | Impact Timeline |
|---|---|---|---|
| Crude-oil price volatility | -1.10% | Global; acute impact in North America shale basins | Short term (≤ 2 years) |
| Stringent wastewater-disposal regulations | -0.80% | North America & EU; emerging impact in APAC | Medium term (2-4 years) |
| Consumer backlash after chemical-disclosure mandates | -0.50% | North America; spill-over to developed markets | Long term (≥ 4 years) |
| Acrylamide monomer supply-chain disruptions | -0.70% | Global; concentrated in North America & Europe | Short term (≤ 2 years) |
| Source: Mordor Intelligence | |||
Crude-Oil Price Volatility
Price swings alter drilling economics almost immediately, thereby throttling completion schedules, which in turn affect real-time chemical demand. The Dallas Federal Reserve reported feedstock input declines in the first half of 2025, including ethane at $0.09 per pound and ethylene at $0.21 per pound.[4]Federal Reserve Bank of Dallas, “Texas Petrochemical Outlook 1H 2025,” dallasfed.org Export interruptions of U.S. ethane to China earlier in 2025 exacerbated supply uncertainty for acrylamide and guar derivatives, which are crucial to friction reducers. Budget-constrained operators respond by shortening stage lengths or reducing proppant loading, translating into lower polymer and surfactant volumes per well. Chemical suppliers bear inventory risk and are compelled to renegotiate long-term contracts or idle under-utilized blending facilities until price signals stabilize. While hedging strategies mitigate some exposure, cash-flow strain during low-price windows may delay innovation spending on greener chemistries and digital platforms.
Stringent Wastewater-Disposal Regulations
The U.S. Environmental Protection Agency’s 2025 wastewater revision imposes tighter effluent limits while expanding reuse provisions, requiring additional biocide, scale-inhibitor, and oxidizer steps in treatment trains. Zero-discharge precedents set in the power sector are now influencing expectations for oil and gas operations, accelerating demand for bleach-free oxidants and membrane-compatible antiscalants. State-level disclosure mandates across at least 28 jurisdictions deepen compliance complexity, forcing chemical transparency and fostering consumer activism. Enhanced reporting obligations add cost but also drive adoption of lower-toxicity additives that meet toxicity characteristic leaching procedure (TCLP) thresholds. Some operators are piloting ceramic membrane concentrators coupled with crystallizers, which elevate demand for specialty antifoams and de-scaling agents. Overall, regulatory tightening is a short-term headwind but nudges the market toward higher-margin, environmentally friendly products.
*Our forecasts treat driver/restraint impacts as directional, not additive. The impact forecasts reflect baseline growth, mix effects, and variable interactions.
Segment Analysis
By Fluid Type: Water-Based Systems Drive Environmental Compliance
Water-based systems accounted for 72.05% of the fracking chemicals market size in 2025, as operators prioritized cost efficiency and regulatory alignment. Foam-based fluids, benefitting from reduced water logistics and superior proppant transport, are forecast at a 14.85% CAGR, outpacing overall market growth. The emergence of salt-tolerant friction reducers and biodegradable surfactants has further solidified water-based dominance by enabling 40%–60% reuse of produced water without penalties to pump rates. Operators in Argentina, for instance, employ aqueous fluids in over 95% of stages, illustrating the global standardization of water-centric chemistries. Meanwhile, seawater-based blends developed in Saudi Arabia effectively cope with high sulfate loads through the use of specialized scale inhibitors, thereby expanding their applicability in arid regions.
Oil-based and gelled-oil formulations retain niche roles in ultra-high-temperature carbonate reservoirs across the Middle East, where stability above 150 °C demands aromatic solvents and heavy loadings of surfactants. Gel-based systems continue to be used in North American workovers, where higher viscosity aids proppant suspension in low-pressure zones. Acid-based fluids remain indispensable for carbonate stimulation, though volumes represent a declining share as operators pivot toward hybrid acid-slick-water treatments that minimize corrosion risk. Given projected stricter disposal rules, water-based system suppliers are scaling on-site recycling units and inline additive dosing to maintain compliance and cost leadership.


By Additive Function: Friction Reducers Lead Market Evolution
Friction reducers captured 37.62% of the fracking chemicals market share in 2025, reflecting their central role in stabilizing pump friction during ever-longer laterals. Recent viscosity-building friction reducers bridge the performance gap between slick water and gel, enabling higher sand concentrations without significant increases in pump horsepower. Gelling agents, the fastest-growing additive category with an 7.75% CAGR, benefit from the demand for stable transport of 100-mesh sand in high-proppant-intensity designs. Surfactants alter wettability, improving fracturing fluid clean-up and hydrocarbon flowback, while biocides counter bacterial activity that could generate hydrogen sulfide or clog membranes in treatment units. Demand for corrosion and scale inhibitors intensifies as produced-water recycling becomes mainstream, exposing tubulars to elevated concentrations of chloride, iron, and sulfate.
Technology trends center on polyacrylamide grafts that offer salt tolerance exceeding 100,000 ppm TDS while maintaining 65%–70% friction reduction. Research into bio-sourced polysaccharide-polyacrylamide hybrids is accelerating to meet the coming biodegradability standards. Meanwhile, cross-linkers and enzyme breakers are optimized for lower activation temperatures to improve clean-up in refracturing campaigns. Collectively, these developments sustain strong additive demand and diversify the competitive landscape beyond the top three service companies.
By Well Type: Horizontal Wells Dominate Through Technical Superiority
Horizontal wells accounted for 83.85% of the fracking chemicals market in 2025, driving the majority of polymer, surfactant, and proppant consumption. The segment is projected to expand at a 7.32% CAGR through 2031 as operators extend laterals beyond 3 km. ExxonMobil reports drilling some of the longest Permian laterals on record, reinforcing momentum toward extended-reach wells that require more stages and chemical volume per foot. Vertical wells persist in select shallow or tight vertical plays but face competitive displacement as cost-per-barrel metrics favor horizontals. Workover-focused vertical recompletions do sustain small but steady demand for acid-based and guar-gel fluids.
Coiled-tubing-enabled horizontal refractures align with the twin goals of maximizing existing asset value and minimizing surface footprint impacts. Continuous pumping shifts chemical demand profiles, necessitating friction reducers with higher shear-rate resilience and breakers that function effectively under cooler wellbore conditions. As automation penetrates completion fleets, real-time optimization of dosage rates is expected to fine-tune chemical spend per horizontal well, improving cost management without sacrificing production uplift.
Geography Analysis
North America remained the epicenter of fracking activity, with a 57.12% market share of fracking chemicals in 2025, supported by abundant shale resources, robust midstream infrastructure, and long-tenured service companies. The United States still fields the majority of global hydraulic-fracturing horsepower, and Canada’s drilling rebound—forecast at 6,604 wells in 2025—bolsters regional demand for polymers and biocides. Regulatory clarity on produced-water reuse, coupled with the expansion of electric fleets in the Bakken and Permian, underscores the region’s readiness to integrate low-carbon chemical solutions.
Asia-Pacific is projected to post the fastest 8.05% CAGR through 2031, narrowing the gap with North America. China’s Qiongzhusi marine shale pilot wells mirror early Barnett Shale productivity, validating technology transfer efforts and spurring domestic chemical capacity expansions among Sinopec and CNPC affiliates. India and Indonesia are evaluating deep shale prospects that, if commercialized, could multiply regional demand for high-salinity-tolerant friction reducers and scale inhibitors. Water scarcity in parts of China and Australia is accelerating the adoption of foam-based and seawater-based fluids, reshaping additive portfolios toward lower-hydration-time polymers and high-foaming surfactants.
South America is anchored by Argentina’s Vaca Muerta, where fracture stages rose 17.6% year on year in 2023 and are on track for 18,000 stages in 2024. Localized supply constraints of guar and sand logistics have driven the development of innovative friction-reducer blends and modular sand-mine strategies. Brazil’s nascent onshore shale programs and Colombia’s exploratory work offer incremental upside for regional chemical suppliers.
Europe shows steady demand growth driven by refracturing in mature continental plays and the North Sea’s tight-gas redevelopment projects. While environmental scrutiny remains high, EU-sourced green additives that comply with REACH regulation are gaining ground. Pilot projects in Poland and Ukraine highlight the geological complexity, underscoring the need for advanced gelling agents and corrosion inhibitors that can withstand higher carbon dioxide partial pressures.
The Middle East and Africa combine emerging unconventional targets and carbonate stimulation programs. Saudi Arabia’s successful seawater-based fracturing and Oman’s tight-gas campaigns illustrate future demand for scale-resistant additives tailored to high-temperature settings. In Sub-Saharan Africa, Namibia’s onshore shale evaluations could open a frontier market, though infrastructure and water sourcing remain significant hurdles that will lean heavily on foam-based systems.

Competitive Landscape
The fracking chemicals market remains moderately fragmented, but consolidation is gathering pace. Halliburton, SLB, and Baker Hughes maintain leading positions through proprietary chemistries, integrated logistics, and digital execution platforms. SLB’s July 2025 acquisition of ChampionX is expected to deliver USD 400 million in pretax synergies within three years, cementing its reach across production chemicals and artificial lift solutions. Halliburton’s purchase of Multi-Chem in January 2025 secured the company’s position as the fourth-largest production-chemicals provider in North America, servicing over 30,000 wells.
SNF’s acquisition of PfP Industries and Ace Fluid Solutions in August 2024 expanded its friction-reducer and biocide offerings, providing a comprehensive suite of products for upstream customers. Technology differentiation is gravitating toward AI-enabled platforms: Halliburton’s OCTIV Auto Frac and Chevron’s ZEUS IQ closed-loop system have boosted operational efficiency by 17% and 25%, respectively, while reducing chemical overuse. Major players are also investing in electric fleets to slash diesel consumption and lower on-site emissions, further aligning with ESG-driven buyer preferences.
Smaller regional blenders compete on formulation agility and customized field support, especially in high-growth basins such as Vaca Muerta and Sichuan. Private-label providers and toll manufacturers supply white-label friction reducers to larger service firms, but rising transparency requirements and supply-chain audits are heightening performance documentation standards. With AI, automation, and ESG compliance increasingly shaping procurement decisions, competitive advantage is expected to hinge on the convergence of chemistry expertise, digital execution, and closed-loop water management capabilities.
Fracking Chemicals Industry Leaders
Halliburton Company
Schlumberger Ltd (SLB)
Baker Hughes Co.
BASF SE
Dow Inc.
- *Disclaimer: Major Players sorted in no particular order

Recent Industry Developments
- July 2025: SLB finalized the acquisition of ChampionX, adding production chemicals and artificial lift technologies to its portfolio.
- June 2025: Chevron and Halliburton launched ZEUS IQ, an intelligent, closed-loop fracturing platform that adapts in real-time to subsurface feedback.
- June 2025: Hess deployed the Zeus 2 electric fracturing system in North Dakota, resulting in a 35% reduction in CO2 emissions.
- March 2025: Chemours and Energy Fuels have formed a strategic alliance to establish a domestic supply chain for critical minerals, including rare earths, titanium, and zirconium.


Global Fracking Chemicals Market Report Scope
The fracking chemicals market report includes:
By Fluid Type
| Water-based |
| Oil-based |
| Foam-based |
| Gel-based |
| Acid-based |
By Additive Function
| Gelling Agents |
| Friction Reducers |
| Surfactants |
| Biocides |
| Corrosion and Scale Inhibitors |
| Cross-linkers |
| Breakers |
By Well Type
| Horizontal |
| Vertical |
By Geography
| North America | United States |
| Canada | |
| Mexico | |
| Europe | Germnay |
| United Kingdom | |
| France | |
| Italy | |
| Spain | |
| Russia | |
| Rest of Europe | |
| Asia Pacific | China |
| India | |
| Japan | |
| South Korea | |
| Australia | |
| ASEAN Countries | |
| Rest of Asia Pacific | |
| South America | Argentina |
| Brazil | |
| Rest of South America | |
| Middle East and Africa | Saudi Arabia |
| United Arab Emirates | |
| South Africa | |
| Nigeria | |
| Rest of Middle East and Africa |
| By Fluid Type | Water-based | |
| Oil-based | ||
| Foam-based | ||
| Gel-based | ||
| Acid-based | ||
| By Additive Function | Gelling Agents | |
| Friction Reducers | ||
| Surfactants | ||
| Biocides | ||
| Corrosion and Scale Inhibitors | ||
| Cross-linkers | ||
| Breakers | ||
| By Well Type | Horizontal | |
| Vertical | ||
| By Geography | North America | United States |
| Canada | ||
| Mexico | ||
| Europe | Germnay | |
| United Kingdom | ||
| France | ||
| Italy | ||
| Spain | ||
| Russia | ||
| Rest of Europe | ||
| Asia Pacific | China | |
| India | ||
| Japan | ||
| South Korea | ||
| Australia | ||
| ASEAN Countries | ||
| Rest of Asia Pacific | ||
| South America | Argentina | |
| Brazil | ||
| Rest of South America | ||
| Middle East and Africa | Saudi Arabia | |
| United Arab Emirates | ||
| South Africa | ||
| Nigeria | ||
| Rest of Middle East and Africa | ||


Key Questions Answered in the Report
What is the current value of the fracking chemicals market?
The fracking chemicals market size is valued at USD 48.92 billion in 2026.
How fast is the fracking chemicals market growing?
The market is forecast to post a 6.45% CAGR between 2026 and 2031.
Which region leads in fracking chemical consumption?
North America dominates with 57.12% market share thanks to extensive shale infrastructure.
What additive type holds the largest share?
Friction reducers lead with 37.62% of total additive revenue because they enable high-rate slick-water pumping.
Why are water-based fluids preferred?
They align with environmental regulations, permit produced-water reuse, and command 72.05% of fluid-type demand.
How is lithium recovery influencing chemical demand?
Produced-water lithium extraction projects generate additional revenue and stimulate the need for specialty separation chemicals.
Page last updated on:


