Food Trays And Bowls Market Size and Share
Market Overview
| Study Period | 2020 - 2031 |
|---|---|
| Market Size (2026) | USD 18.02 Billion |
| Market Size (2031) | USD 24.19 Billion |
| Growth Rate (2026 - 2031) | 6.07% CAGR |
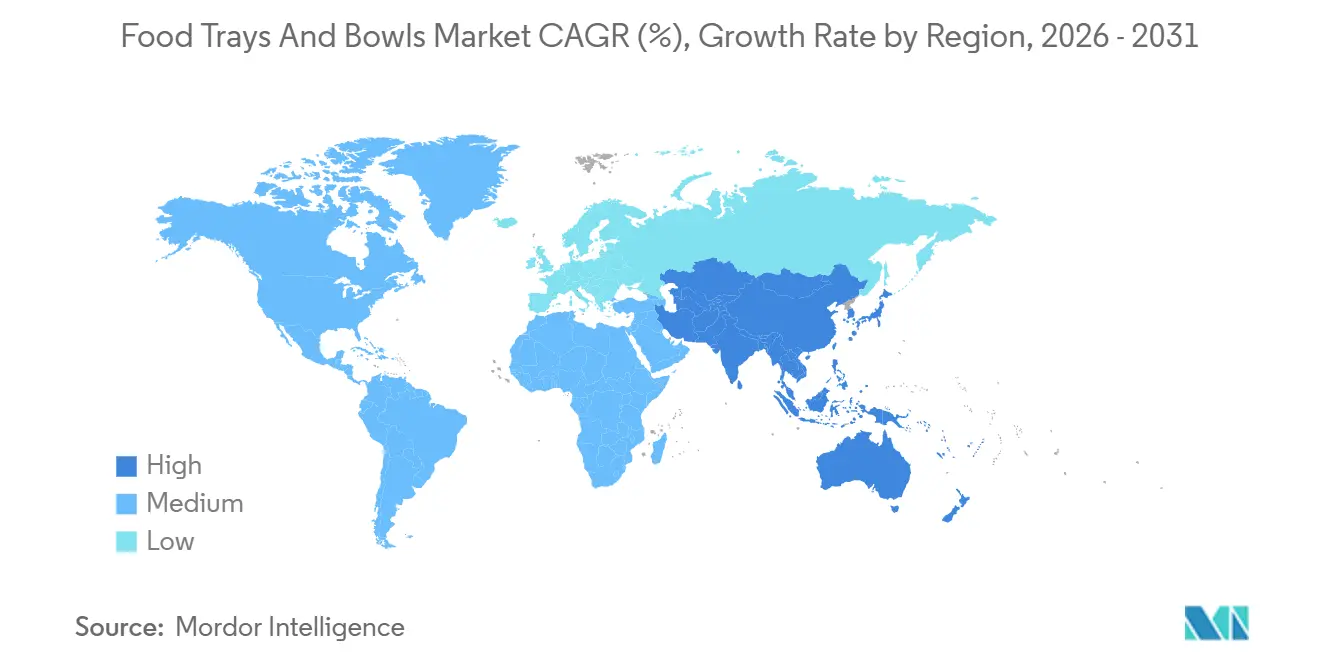
| Fastest Growing Market | Middle East |
| Largest Market | Asia Pacific |
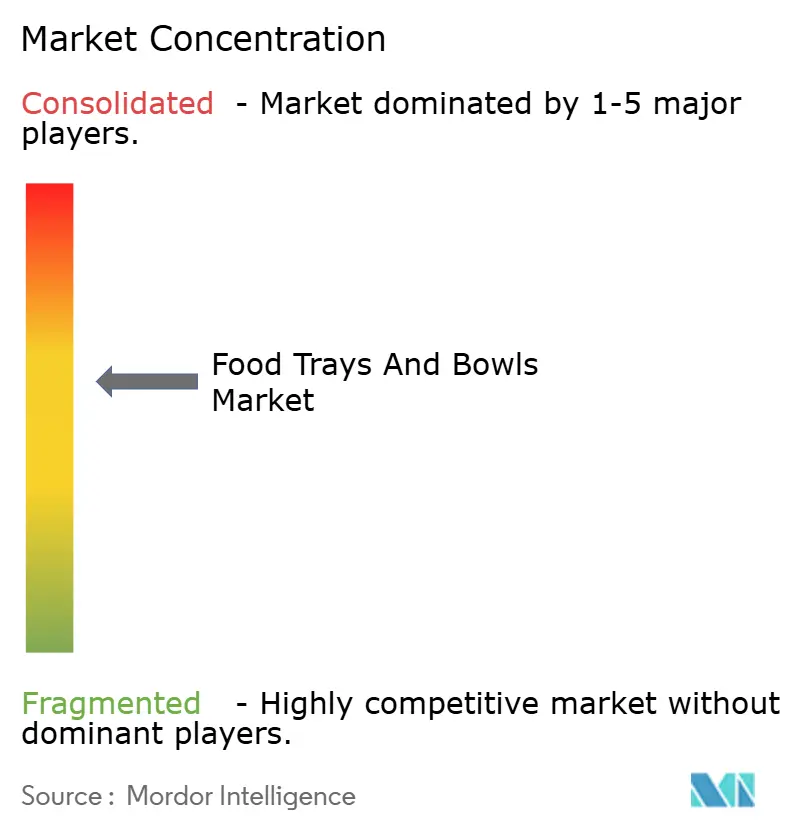
| Market Concentration | Medium |
Major Players *Disclaimer: Major Players sorted in no particular order Image © Mordor Intelligence. Reuse requires attribution under CC BY 4.0. | |
Food Trays And Bowls Market Analysis by Mordor Intelligence
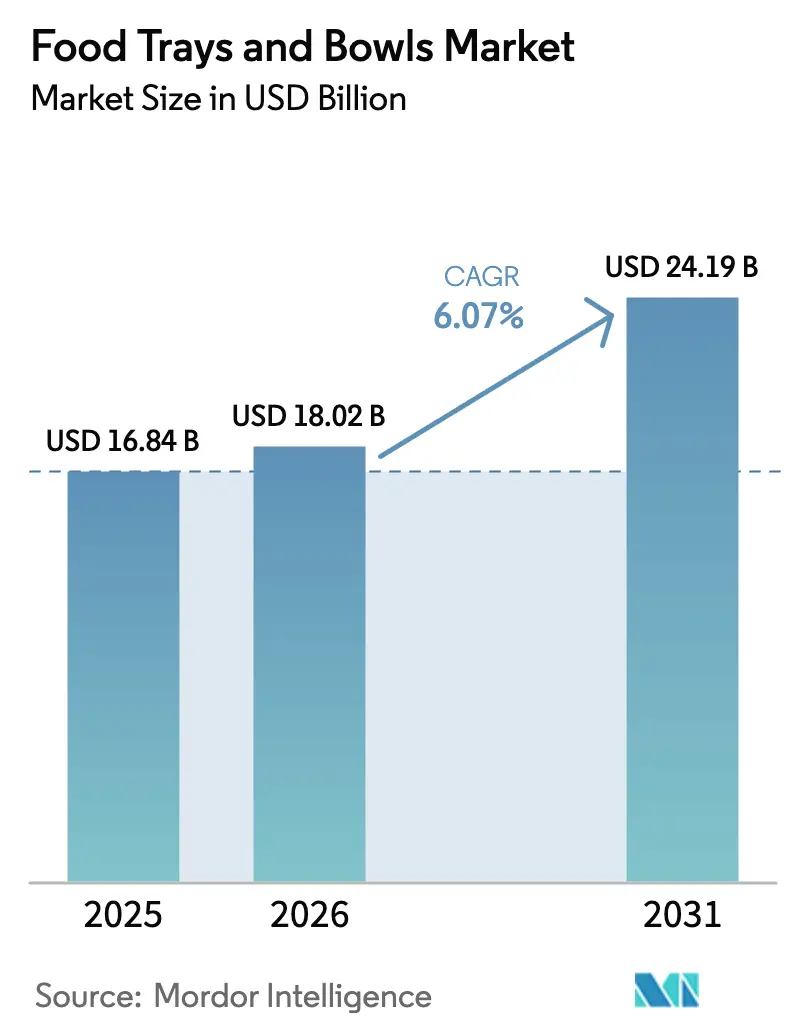
The food trays and bowls market size is expected to increase from USD 16.84 billion in 2025 to USD 18.02 billion in 2026 and reach USD 24.19 billion by 2031, growing at a CAGR of 6.07% over 2026-2031. Demand momentum remains strong as online food delivery volumes, quick-service-restaurant (QSR) rollouts, and corporate bans on single-use plastics converge to favor fiber-based and recyclable rigid-plastic formats. Regional bans on per- and polyfluoroalkyl substances (PFAS) are accelerating phase-outs of legacy foam trays, while molded-fiber technologies capable of withstanding oven and microwave temperatures are unlocking new prepared-meal categories. Platform economics are reshaping design parameters: tamper-evident seals, stackability, and courier-bag fit now influence tooling decisions as much as shelf-life performance. Capital is flowing toward modular pulp-molding lines and high-barrier coatings that meet global food-contact rules without PFAS, signaling sustained innovation investment through the forecast window.
Key Report Takeaways
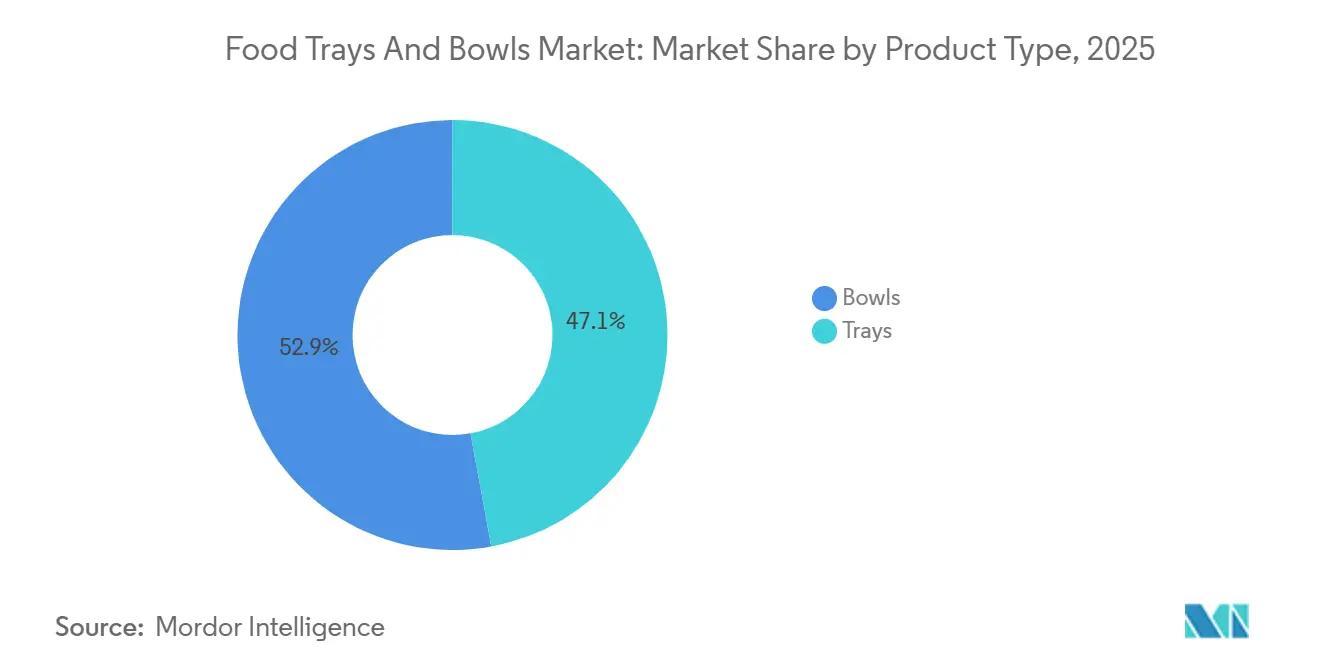
- By material type, rigid plastic led with 32.14% of the food trays and bowls market share in 2025, yet molded fiber is projected to advance at a 6.94% CAGR to 2031.
- By product type, trays commanded 47.12% of the 2025 revenue pool, while bowls are set to expand at a 6.52% CAGR through 2031.
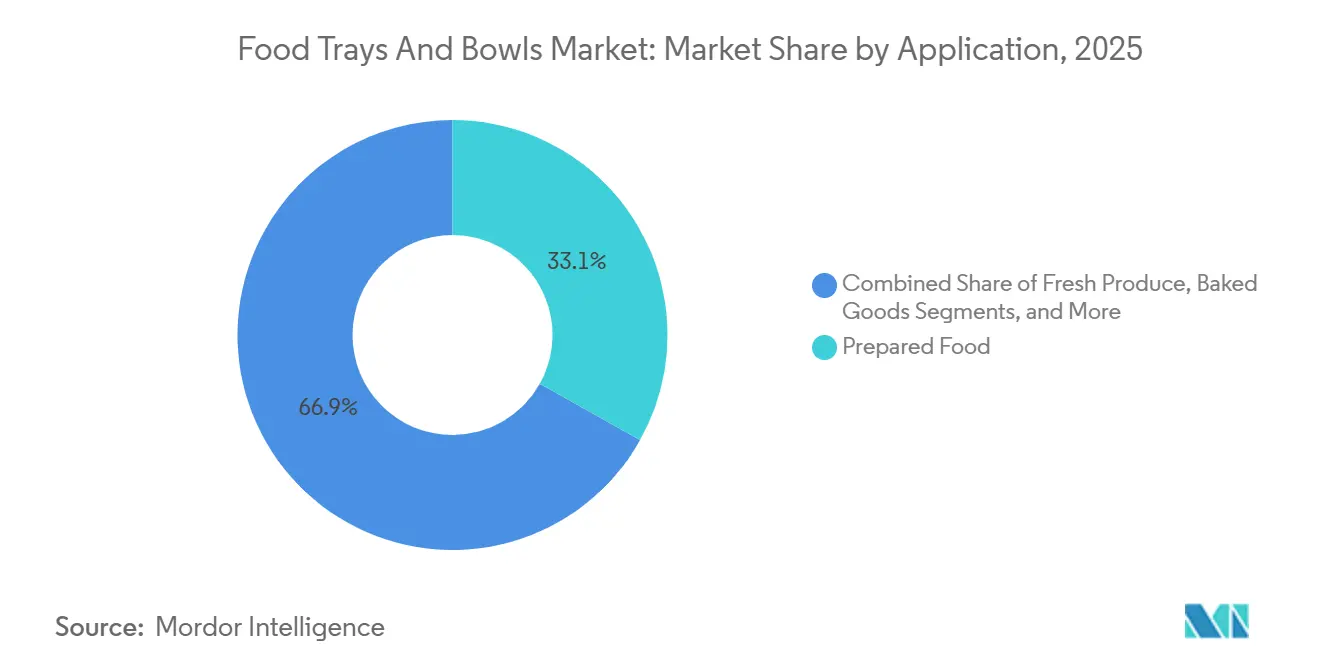
- By application, prepared food accounted for 33.12% of demand in 2025, whereas fresh produce is forecast to rise at a 7.02% CAGR to 2031.
- By end-user, QSR outlets held 36.12% volume in 2025, and convenience stores are expected to grow at a 6.94% CAGR during 2026-2031.
- By geography, Asia-Pacific contributed 40.32% of 2025 revenue, and the Middle East is the fastest-growing geography at a 6.05% CAGR to 2031.
Note: Market size and forecast figures in this report are generated using Mordor Intelligence’s proprietary estimation framework, updated with the latest available data and insights as of 2026.
Global Food Trays And Bowls Market Trends and Insights
Drivers Impact Analysis*
| Driver | (~) % Impact on CAGR Forecast | Geographic Relevance | Impact Timeline |
|---|---|---|---|
| Surging Penetration of Online Food Delivery Platforms | +1.2% | Global, with concentration in North America, Europe, and Asia-Pacific urban centers | Medium term (2-4 years) |
| Expansion of Global Quick Service Restaurant Chains | +1.0% | Global, led by Asia-Pacific (China, India) and Middle East (UAE, Saudi Arabia) | Medium term (2-4 years) |
| Corporate Sustainability Commitments Driving Fiber-Based Packaging | +0.8% | Global, strongest in Europe and North America; emerging in Asia-Pacific | Long term (≥ 4 years) |
| Emergence of Microwaveable Molded Fiber Trays for High-Heat Applications | +0.5% | North America and Europe core, spill-over to Asia-Pacific premium segments | Medium term (2-4 years) |
| Decentralized Ghost Kitchens Demanding Small-Batch Packaging Agility | +0.4% | North America and Asia-Pacific urban clusters; limited Middle East and Africa uptake | Short term (≤ 2 years) |
| Subsidies for Domestic Molded Pulp Machinery in Developing Countries | +0.3% | Asia-Pacific (India, China); selective South America and Africa programs | Long term (≥ 4 years) |
| Source: Mordor Intelligence | |||
Surging Penetration of Online Food Delivery Platforms
DoorDash’s 80.1 billion USD gross transaction value in 2024 and its 2025 acquisition of Deliveroo illustrate how aggregator scale now dictates packaging specifications for tamper evidence, thermal retention, and courier-bag optimization.[1]DoorDash Inc., “Investor Relations,” IR.DOORDASH.COM Merchant scorecards that penalize non-recyclable or oversized formats are accelerating the migration to right-sized molded-fiber and rigid-plastic containers. Higher order frequency justifies custom tooling for platform-approved shapes, lowering per-unit costs and making fiber economically viable for small restaurants. Anticipated EU digital product passport rules, scheduled for 2027, will embed QR or near-field-communication labels, further raising compliance barriers for non-standard suppliers.
Expansion of Global Quick Service Restaurant Chains
McDonald’s plans to reach 50,000 restaurants by 2027, with 2,600 openings slated for 2026, while Yum China surpassed 15,000 stores after adding 1,300 units in 2024,. Store-count growth demands standardized trays and bowls that meet grease-resistance and microwave-compatibility thresholds, prompting converters to co-locate plants near high-growth markets. Investments such as Huhtamaki’s 45 million USD molded-fiber facility in India and Sonoco’s 35 million USD South Carolina plant confirm the localization trend. Reusable pilots exist in select European cities, yet drive-through and delivery formats continue to favor single-use options that meet ISO 22000 food-safety requirements.
Corporate Sustainability Commitments Driving Fiber-Based Packaging
Marks and Spencer removed 500 million plastic units by March 2025 by shifting to Forest Stewardship Council-certified molded-fiber trays co-developed with Graphic Packaging. Amcor earmarked 1 billion USD for sustainable-packaging R&D, launching its AmFiber range in 2024.[2]Amcor plc, “Sustainability Report 2024,” AMCOR.COM Retailers and brand owners are internalizing waste-management costs under extended-producer-responsibility laws, making recyclable substrates financially attractive. The technical challenge is achieving moisture and oxygen barriers without PFAS; dispersion polymers and plant-based waxes are emerging solutions, though commercial validation and EU migration testing add cost and time to market.
Emergence of Microwaveable Molded Fiber Trays for High-Heat Applications
Graphic Packaging’s May 2025 pilot with Marks and Spencer demonstrated molded fiber that withstands 220 °C for 25 minutes, opening ready-meal segments once limited to aluminum or coated paperboard.[3]Graphic Packaging Holding Company, “Press Release May 2025,” GRAPHICPKG.COM Multi-layer pressing densifies the fiber matrix, while plant-based wax coatings prevent grease strike-through. Early adopters include meal-kit providers and airline caterers keen to combine sustainability with reheating convenience. ASTM D6868 compostability testing and FDA food-contact notifications require up to 12 months and roughly 30,000 USD in third-party fees, tempering speed of adoption but not market enthusiasm.
Restraints Impact Analysis*
| Restraint | (~) % Impact on CAGR Forecast | Geographic Relevance | Impact Timeline |
|---|---|---|---|
| Volatile Prices of Sustainable Raw Materials | -0.8% | Global, acute in regions dependent on imported pulp (Middle East, Africa, parts of Asia-Pacific) | Short term (≤ 2 years) |
| Stringent Food-Contact Compliance Testing Costs | -0.5% | Global, most pronounced in North America (FDA) and Europe (EU Regulation 1935/2004) | Medium term (2-4 years) |
| Limited Barrier Coating Solutions for High-Moisture Ethnic Cuisines | -0.4% | Asia-Pacific, Middle East, and diaspora markets in North America and Europe | Medium term (2-4 years) |
| Consumer Perception Risk From PFAS Incidents in Molded Fiber Packaging | -0.3% | North America (Maine, California, Minnesota bans) and Europe (REACH restrictions) | Long term (≥ 4 years) |
| Source: Mordor Intelligence | |||
Volatile Prices of Sustainable Raw Materials
Northern bleached softwood kraft pulp averaged 1,050 USD per metric ton in 2024, swinging up to 20% quarter-to-quarter, while polypropylene and polyethylene terephthalate fluctuated between 1,200 USD and 1,600 USD per metric ton during 2024-2025,. Such volatility squeezes converters locked into fixed-price QSR contracts and deters investment in new molded-fiber lines that assume stable inputs over a five-year payback horizon. Extended-producer-responsibility fees narrow the cost gap between plastics and fiber but do little to smooth commodity swings, leaving smaller players exposed to margin shocks.
Stringent Food-Contact Compliance Testing Cost
The U.S. FDA’s food-contact substance notification pathway and the EU’s Regulation 1935/2004 require migration, toxicology, and environmental tests that run 10,000-50,000 USD per formulation and can last up to 18 months,. For small converters introducing PFAS-free coatings or bio-based resins, these expenses are a formidable barrier, effectively reinforcing the incumbency of large multinationals able to amortize costs across global volumes. Duplicate national rules within the EU compound the burden, slowing innovation cycles and limiting substrate diversity.
*Our forecasts treat driver/restraint impacts as directional, not additive. The impact forecasts reflect baseline growth, mix effects, and variable interactions.
Segment Analysis
By Product Type: Bowls Gain Share Through Portion-Control Demand
Trays held 47.12% of revenue in 2025, reflecting dominance in meat, poultry, seafood, and ready-meal applications where flat surfaces ease overwrap and labeling processes. The food trays and bowls market size for bowls is projected to rise at a 6.52% CAGR, driven by QSR build-your-own menus, convenience-store grab-and-go meals, and the visual appeal of round containers on aggregator apps. Molded-fiber bowls are entering premium channels, although a 20-25% cost premium over plastic restrains mass uptake.
Bowls are also benefiting from design tweaks such as spill-resistant lids and internal ridges that maintain ingredient separation. Trays, however, retain an edge in automated fresh-produce lines due to rectangular footprints that maximize pallet density. Regulatory nudges under the EU Single-Use Plastics Directive are nudging retailers toward fiber-based trays, reinforcing gradual share shifts without displacing legacy plastic overnight.


By Material Type: Molded Fiber Disrupts Rigid Plastic’s Cost Moat
Rigid plastic captured 32.14% of 2025 volume thanks to superior barriers and high-speed thermoforming rates, yet molded fiber is advancing at a 6.94% CAGR as brand owners internalize waste fees and consumers equate paper-based options with environmental stewardship. Foam polystyrene is retreating as municipal bans spread, forcing retooling toward fiber and recyclable rigid plastics.
The food trays and bowls market size linked to molded fiber is scaling faster where government subsidies offset capital costs for pulp-molding equipment, particularly in India and China. Even so, rigid plastic’s unit economics below 0.10 USD and unmatched shelf-life performance for extended-shelf-life meals ensure a gradual, not abrupt, share erosion. Compliance with ASTM D6400 and ISO 14855 for compostability adds certification steps and costs that molded-fiber newcomers must budget into project timelines.
By Application: Fresh Produce Outpaces Prepared Food on Spoilage-Reduction Tech
Prepared food commanded 33.12% of demand in 2025, supported by supermarket ready-meals and meal-kit subscriptions requiring multi-compartment trays. Fresh produce, however, is forecast to expand at a 7.02% CAGR as modified-atmosphere packaging, ethylene absorbers, and cold-chain investments extend shelf life and reduce shrink. The food trays and bowls market share for produce applications is rising fastest in Asia-Pacific supermarkets adopting pre-cut salad kits.
Meat, poultry, and seafood remain reliant on high-barrier multilayer rigid plastics, while baked goods continue to favor lightweight paperboard. Plasma-coated pulp trials hint at a future fiber pathway for chilled proteins, but commercialization is several years away. U.S. Department of Agriculture rules on active packaging and European Food Safety Authority positive lists shape material choices, steering converters toward proven barrier chemistries.

By End-User: Convenience Stores Leverage Micro-Fulfillment Density
QSR outlets represented 36.12% of end-user volume in 2025, but convenience stores are growing at a 6.94% CAGR as urban density and last-mile delivery apps convert neighborhood outlets into micro-fulfillment hubs. 7-Eleven’s hot-food pilots in Asia-Pacific highlight the traction for microwave-safe bowls with steam-vent lids.
Institutional catering values cost and hygiene, still favoring single-use trays despite European pilots of reusable polycarbonate systems. Supermarkets deploy trays and bowls primarily in deli and produce sections where shelf-life gains justify higher-barrier substrates. Airlines, food-service distributors, and event caterers form a fragmented tail demanding stackability and portion control more than sustainability badges.
Geography Analysis
Asia-Pacific generated 40.32% of global revenue in 2025, buoyed by China’s QSR network topping 500,000 outlets and India’s double-digit growth in institutional catering. Yum China’s 1,300 store additions in 2024 alone created demand for an estimated 400 million units of disposable packaging per year. Growth is diffusing inland as tier-two and tier-three cities gain aggregator coverage, while coastal megacities mature. Japan and South Korea remain premium molded-fiber leaders because corporate emissions targets outweigh cost sensitivities.
The Middle East leads growth at a 6.05% CAGR through 2031, fueled by Saudi Vision 2030 tourism developments and the United Arab Emirates’ localization of packaging supply. Almarai’s 2024 investments in PFAS-free molded-fiber capacity underscore government pressure to align with circular-economy goals. QSR franchise agreements tied to mega-projects in Riyadh and Neom will further lift volume, although resin import dependence can stretch lead times.
North America and Europe account for roughly 35% of 2025 revenue. Growth, at 4.5-5%, is tempered by saturated QSR saturation and extended-producer-responsibility fees that push lightweighting rather than net-new unit volume. The U.S. FDA’s voluntary PFAS phase-out is spurring rapid R&D in alternative coatings, while the EU’s 2027 digital passport requirement will tack 0.02-0.05 USD per unit onto compliance costs. South America’s advance centers on Brazil and Argentina, where Chinese pulp-molding machines help local converters compete. Africa is nascent but poised for lift as multinational QSR brands enter Nigeria and South Africa.

Competitive Landscape
The top five suppliers—Amcor, Huhtamaki, Pactiv Evergreen, Sealed Air, and Mondi—collectively hold an estimated 35-40% of global revenue, giving the food trays and bowls market a moderately concentrated profile. Scale enables long-term supply contracts with QSR giants, but private-label converters use 10-15% lower pricing to win supermarket tenders. Amcor’s 56.5 million USD acquisition of MDK Verpackungen in 2024 secured proprietary water-based coatings, while Sonoco’s 3.9 billion USD purchase of Eviosys that same year broadened substrate reach and cross-selling latitude.
Competition is fiercest in molded fiber where patent expiries and sustainability-focused venture funding lower barriers to entry. Huhtamaki’s 158.2 million USD acquisition of Elif added barrier-film depth, and Graphic Packaging’s ovenable-tray collaboration with Marks and Spencer exemplifies co-development paths to lock in demand. Sealed Air’s SEE Automation sensors cut scrap by up to 12%, a benefit smaller rivals struggle to replicate.
Supplier bargaining power is moderate for pulp and resin due to multiple mills and petrochemical sources, but specialty PFAS-free additives remain controlled by a handful of chemical firms that command premium pricing. Buyer power is high in QSR and catering channels where standardized specs facilitate supplier switching, yet it is moderate in fresh produce where proprietary ventilation designs create stickiness. Reusable-container pilots represent a distant but rising substitute threat, limited for now by hygiene logistics and consumer deposit reluctance.
Food Trays And Bowls Industry Leaders
EasyPak LLC
Envaplaster S.A.
Genpak LLC
Graphic Packaging Holding Company
Pactiv Evergreen Inc.
- *Disclaimer: Major Players sorted in no particular order

Recent Industry Developments
- January 2026: Pactiv Evergreen commissioned a Missouri line that boosts annual EarthChoice compostable tray capacity by 800 million units, targeting QSR and institutional-catering clients.
- October 2025: DoorDash closed its Deliveroo acquisition, unifying 30 million subscribers and signaling a shift toward standardized tamper-evident, courier-optimized packaging.
- May 2025: Graphic Packaging and Marks and Spencer launched an FSC-certified ovenable fiber tray capable of withstanding 220 °C for 25 minutes, opening premium ready-meal categories to molded fiber.
- January 2025: Amcor signed an agreement with NOVA Chemicals to source mechanically recycled polyethylene from the latter’s Indiana plant, advancing a 30% recycled-content goal by 2030.


Global Food Trays And Bowls Market Report Scope
Food trays and bowls are food-service containers used to hold, serve, store, or package food items. They are designed for convenience, hygiene, and portion control across settings such as homes, restaurants, catering, takeaways, and food processing industries. The food trays and bowls market analysis examines consumption patterns across quick-service restaurants, food service establishments, and allied sectors.
The Food Trays and Bowls Market Report is Segmented by Product Type (Trays, Bowls), Material Type (Rigid Plastic, Plastic Foam, Paperboard, Molded Fiber), Application (Meat Poultry and Seafood, Prepared Food, Baked Goods, Fresh Produce, Other Food Applications), End-User (Quick Service Restaurants, Institutional Catering, Supermarket and Hypermarket, Convenience Stores, Other End-Users), and Geography (North America, Europe, Asia-Pacific, South America, Middle East, Africa). The Market Forecasts are Provided in Terms of Value (USD).
| Trays |
| Bowls |
| Rigid Plastic |
| Plastic Foam (EPS) |
| Paperboard |
| Molded Fiber |
| Meat, Poultry, and Seafood |
| Prepared Food |
| Baked Goods |
| Fresh Produce |
| Other Food Applications |
| Quick Service Restaurants |
| Institutional Catering |
| Supermarket and Hypermarket |
| Convenience Stores |
| Other End-Users |
| North America | United States |
| Canada | |
| Mexico | |
| Europe | Germany |
| United Kingdom | |
| France | |
| Italy | |
| Spain | |
| Rest of Europe | |
| Asia-Pacific | China |
| Japan | |
| India | |
| South Korea | |
| Australia | |
| Thailand | |
| Malaysia | |
| Rest of Asia-Pacific | |
| South America | Brazil |
| Argentina | |
| Rest of South America | |
| Middle East | United Arab Emirates |
| Saudi Arabia | |
| Turkey | |
| Rest of Middle East | |
| Africa | South Africa |
| Nigeria | |
| Rest of Africa |
| By Product Type | Trays | |
| Bowls | ||
| By Material Type | Rigid Plastic | |
| Plastic Foam (EPS) | ||
| Paperboard | ||
| Molded Fiber | ||
| By Application | Meat, Poultry, and Seafood | |
| Prepared Food | ||
| Baked Goods | ||
| Fresh Produce | ||
| Other Food Applications | ||
| By End-User | Quick Service Restaurants | |
| Institutional Catering | ||
| Supermarket and Hypermarket | ||
| Convenience Stores | ||
| Other End-Users | ||
| By Geography | North America | United States |
| Canada | ||
| Mexico | ||
| Europe | Germany | |
| United Kingdom | ||
| France | ||
| Italy | ||
| Spain | ||
| Rest of Europe | ||
| Asia-Pacific | China | |
| Japan | ||
| India | ||
| South Korea | ||
| Australia | ||
| Thailand | ||
| Malaysia | ||
| Rest of Asia-Pacific | ||
| South America | Brazil | |
| Argentina | ||
| Rest of South America | ||
| Middle East | United Arab Emirates | |
| Saudi Arabia | ||
| Turkey | ||
| Rest of Middle East | ||
| Africa | South Africa | |
| Nigeria | ||
| Rest of Africa | ||


Key Questions Answered in the Report
How large is the food trays and bowls market in 2026?
The food trays and bowls market size stands at USD 18.02 billion in 2026.
What is the expected CAGR for food-contact trays and bowls through 2031?
The market is projected to grow at a 6.07% CAGR between 2026 and 2031.
Which material is growing fastest in disposable food packaging?
Molded fiber is the fastest-growing substrate, advancing at a 6.94% CAGR as brands seek PFAS-free, recyclable solutions.
Why are convenience stores increasing demand for disposable bowls?
Urban micro-fulfillment models and grab-and-go meal formats are lifting bowl demand at a 6.94% CAGR among convenience retailers.
Which region leads global revenue for disposable trays and bowls?
Asia-Pacific generates the largest share, accounting for 40.32% of 2025 sales.
What factor most accelerates adoption of fiber-based trays?
Corporate sustainability commitments and related extended-producer-responsibility fees are driving fiber uptake across QSR and retail channels.
Page last updated on:


