
Food Bleaching Agents Market Size and Share
Market Overview
| Study Period | 2021 - 2031 |
|---|---|
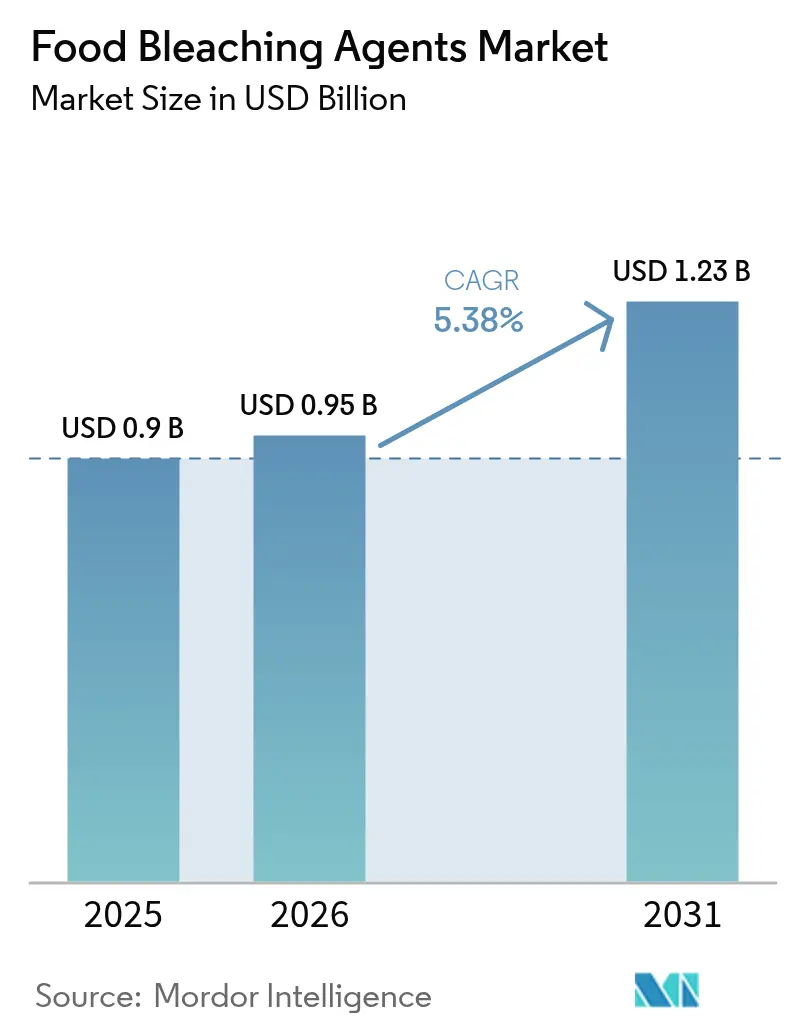
| Market Size (2026) | USD 0.95 Billion |
| Market Size (2031) | USD 1.23 Billion |
| Growth Rate (2026 - 2031) | 5.38 % |
| Fastest Growing Market | South America |
| Largest Market | Asia Pacific |
| Market Concentration | Medium |
Major Players
*Disclaimer: Major Players sorted in no particular order Image © Mordor Intelligence. Reuse requires attribution under CC BY 4.0. |
|
Food Bleaching Agents Market Analysis by Mordor Intelligence
The food bleaching agents market size was valued at USD 0.9 billion in 2025 and estimated to grow from USD 0.95 billion in 2026 to reach USD 1.23 billion by 2031, at a CAGR of 5.38% during the forecast period (2026-2031). This growth is primarily driven by the increasing demand from industrial baking, dairy products requiring extended shelf life, and starch modification processes, all of which rely on effective whitening and antimicrobial properties. Regulatory approvals for the use of hydrogen peroxide and chlorine dioxide in food applications, along with advancements in liquid dosing systems, are facilitating their widespread adoption. These developments align with the industry's shift toward cleaner label claims, as brands aim to meet consumer expectations for transparency and reduced additive usage. Producers are leveraging enzyme-bleach synergies to minimize additive levels, a strategy that not only addresses consumer concerns but also ensures operational efficiency. Additionally, investments in local hydrogen peroxide production facilities across the Asia-Pacific region are reducing reliance on imports, thereby strengthening the market's long-term competitiveness and ensuring a stable supply chain.
Key Report Takeaways
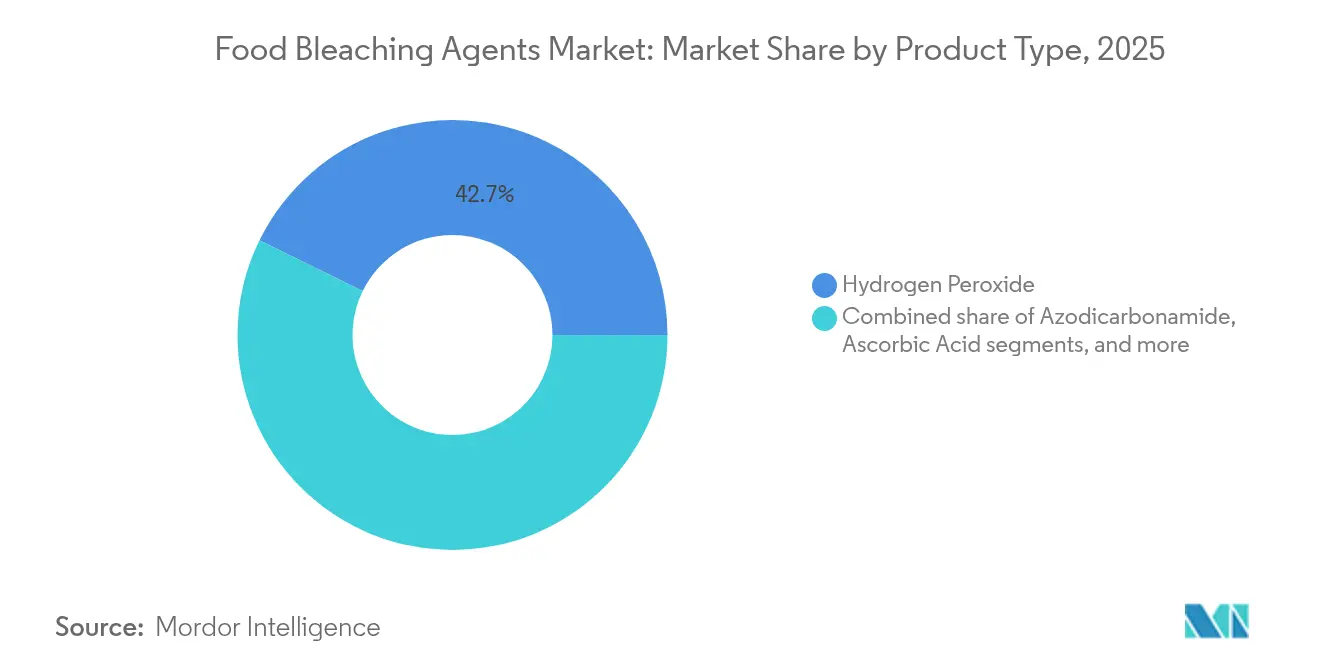
- By type, hydrogen peroxide led with 42.74% of the food bleaching agents market share in 2025; ascorbic acid is projected to expand at 7.33% CAGR to 2031.
- By form, powder commanded 40.92% share of the food bleaching agents market size in 2025, while liquid posted the highest CAGR at 7.52% through 2031.
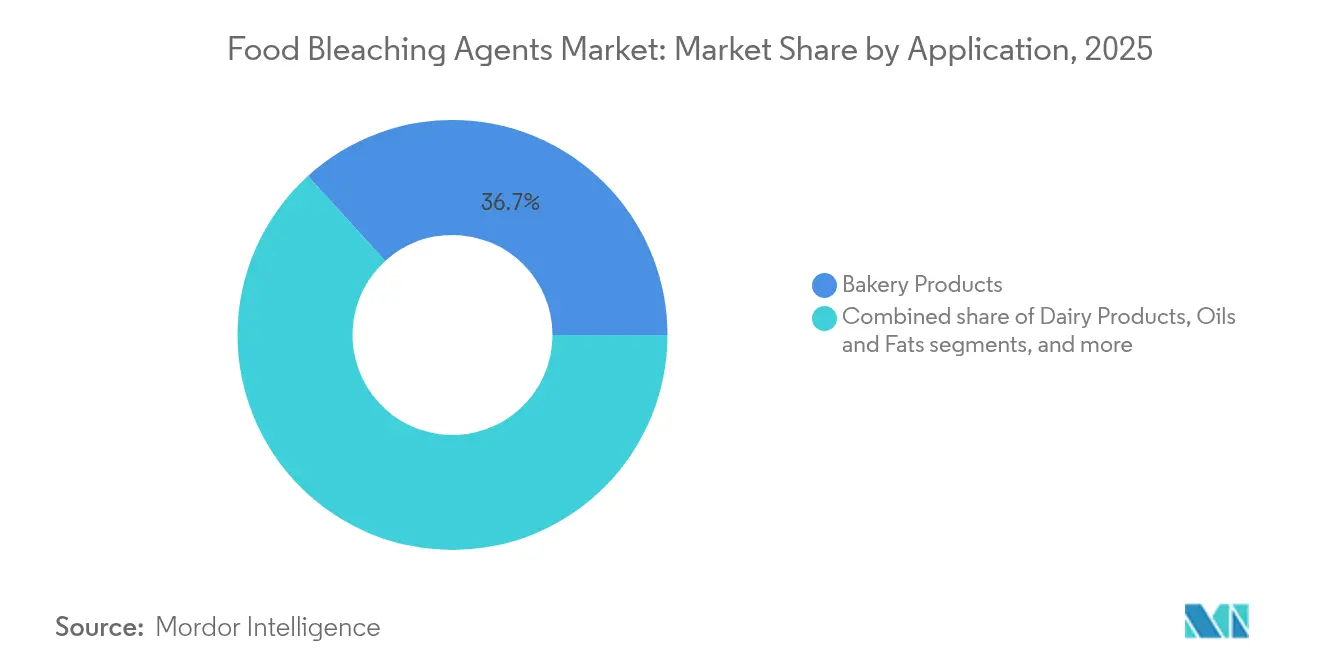
- By application, bakery products captured 36.74% of the food bleaching agents market size in 2025; dairy is advancing at a 7.66% CAGR to 2031.
- By geography, Asia-Pacific held 34.41% revenue share in 2025; South America is the fastest-growing region at 7.55% CAGR through 2031.
Note: Market size and forecast figures in this report are generated using Mordor Intelligence’s proprietary estimation framework, updated with the latest available data and insights as of 2026.
Global Food Bleaching Agents Market Trends and Insights
Drivers Impact Analysis*
| Drivers | (~) % Impact on CAGR Forecast | Geographic Relevance | Impact Timeline |
|---|---|---|---|
| Increasing demand for processed and packaged foods | +1.2% | Global, with strongest impact in Asia-Pacific and South America | Medium term (2-4 years) |
| Technological advancements in bleaching processes | +0.8% | North America and EU leading innovation, spreading to APAC | Long term (≥ 4 years) |
| Rising demand for bleached flour in fast food and quick-service restaurants | +0.9% | Global, particularly North America and urban Asia-Pacific | Short term (≤ 2 years) |
| Broad applications in bakery, confectionery, and dairy industries | +1.1% | Global, with mature markets in North America and EU, growth in emerging markets | Medium term (2-4 years) |
| Enzyme-bleach synergy reducing additive use in industrial bakeries | +0.6% | North America and EU primarily, expanding to Asia-Pacific | Long term (≥ 4 years) |
| Growing use of bleaching agents in starch and derivative production | +0.7% | Global, with significant impact in Asia-Pacific starch processing hubs | Medium term (2-4 years) |
| Source: Mordor Intelligence | |||
Increasing demand for processed and packaged foods
As global demand for processed and packaged foods surges, manufacturers are turning to food bleaching agents to enhance product appearance, extend shelf life, and ensure consistency. Urbanization and fast-paced lifestyles are steering consumers towards ready-to-eat and convenience foods, many of which, especially bakery products, refined oils, and sugar-based items, rely on bleaching agents during production. Agents like hydrogen peroxide and benzoyl peroxide are pivotal in achieving the desired whiteness and texture in flour and dairy processing. The burgeoning industrial-scale food manufacturing, particularly in emerging markets such as India, China, and Brazil, underscores the escalating demand for standardized ingredients. Moreover, advancements in food technology and a bolstered supply chain infrastructure have facilitated the penetration of packaged foods into rural and semi-urban locales. In tune with shifting consumer preferences, multinational food brands are broadening their product lines, inadvertently amplifying the demand for functional additives. Regulatory nods for food-grade bleaching agents across various regions have further cemented their role in mainstream food production. With a global tilt towards visually appealing and shelf-stable foods, the trajectory for bleaching agents points upwards.
Technological advancements in bleaching processes
Innovations in bleaching technology are driving the development of more efficient and environmentally sustainable processing methods, effectively addressing regulatory compliance and operational cost challenges. In March 2025, Dr. Jong Min Kim's team introduced a revolutionary carbon catalyst capable of achieving over 80% efficiency in hydrogen peroxide production. This process utilizes low oxygen concentrations from the air, marking a significant advancement in on-site production capabilities[1]Source: National Research Council of Science and Technology, "Carbon catalyst uses airborne oxygen to boost green hydrogen peroxide production", www.nst.re.kr. The resulting hydrogen peroxide solutions, with a 3.6% concentration, not only surpass medical-grade standards but also provide food processors with enhanced control over their bleaching operations, improving efficiency and reducing dependency on external suppliers. Additionally, Evonik's creation of ultra-pure hydrogen peroxide specifically designed for food disinfectant processing underscores the growing emphasis on sustainable food safety solutions. This innovation aligns with the increasing demand for cleaner and safer food processing practices. Moreover, the integration of UV-C light with hydrogen peroxide for package sterilization achieves a 5-log reduction in bacterial spores while adhering to FDA residual chemical regulations. These technological advancements collectively enable food processors to achieve superior bleaching results, minimize chemical inputs, and enhance safety profiles, thereby meeting both industry standards and consumer expectations.
Rising demand for bleached flour in fast food and quick-service restaurants
Globally, quick-service restaurant (QSR) chains are expanding rapidly, leading to a surge in demand for standardized flour products. These products undergo consistent bleaching to meet both visual and functional standards. Fast food operators, with thousands of locations, emphasize ingredient uniformity to guarantee product quality, making bleached flour a vital part of their supply chains. The International Franchise Association reported that in 2024, the U.S. boasted 195,245 quick-service restaurant franchise establishments, underscoring the heightened demand[2].Source: International Franchise Association, "Number of quick service restaurant (QSR) franchise establishments in the United States from 2007 to 2024, with a forecast for 2025", www.franchise.org Beyond mere appearance, standardization now encompasses functional attributes, such as protein modification and enhanced dough handling, both of which are benefits of bleaching agents. Emerging markets, especially in Asia-Pacific and Latin America, are becoming new demand hubs for bleached flour products, thanks to the QSR expansion. The industry's focus on speed and efficiency dovetails with the advantages of bleached flour, which offers benefits like shorter mixing times and better machinability. Furthermore, as the QSR industry consolidates its supply chain, purchasing power is increasingly concentrated among a handful of larger suppliers, all of whom insist on uniform bleaching standards across their ingredient offerings.
Broad applications in bakery, confectionery, and dairy industries
Bleaching agents are experiencing widespread adoption across the food industry, with applications in bakery, confectionery, and dairy segments significantly contributing to market growth. In 2024, the bakery sector dominates the market, accounting for a 37.18% share. Manufacturers in this segment focus on flour whitening and dough conditioning to achieve consistent quality and high-volume production, which are critical for large-scale operations. The dairy industry, on the other hand, is emerging as a rapidly growing application area, projected to register a 7.85% CAGR during the forecast period (2025–2030). This growth is driven by increasing consumer demand for visually appealing dairy products and the need for extended shelf life, particularly in processed cheese and milk powders. Similarly, the confectionery segment is gaining traction, where bleaching agents are essential for refining sugar and ensuring uniform color in products such as fondants and gummies. The multifunctionality of bleaching agents in enhancing product aesthetics, improving processing efficiency, and ensuring functional stability across diverse food categories underscores their critical role in modern food manufacturing.
Restraints Impact Analysis*
| Restraint | (~) % Impact on CAGR Forecast | Geographic Relevance | Impact Timeline |
|---|---|---|---|
| Stringent food safety and additive regulations | -0.9% | Global, with strongest impact in North America and EU | Short term (≤ 2 years) |
| Growing preference for clean-label and additive-free products | -1.1% | North America and EU leading, spreading globally | Medium term (2-4 years) |
| Health concerns over chemical residues in bleached foods | -0.7% | Global, with heightened awareness in developed markets | Medium term (2-4 years) |
| Risk of nutrient degradation in over-processed bleached foods | -0.5% | Primarily North America and EU, emerging in Asia-Pacific | Long term (≥ 4 years) |
| Source: Mordor Intelligence | |||
Stringent food safety and additive regulations
Regulatory tightening across major markets is fundamentally reshaping the competitive dynamics of the food bleaching agents market. Compliance costs and extended approval timelines have become critical factors influencing business operations. The FDA's revocation of brominated vegetable oil and the impending ban on Red Dye No. 3, effective January 2027, highlight a broader regulatory trend toward stricter oversight of food additives. Similarly, California's Food Safety Act, also effective January 2027, prohibits several additives, including potassium bromate, creating significant compliance challenges for manufacturers operating across multiple jurisdictions. Additionally, the FDA's enhanced post-market assessment program for food chemicals now requires continuous safety documentation, further increasing operational costs for bleaching agent suppliers. In Europe, the Corporate Sustainability Reporting Directive introduces stringent environmental compliance requirements, directly impacting market access for chemical suppliers. These evolving regulatory frameworks are driving industry consolidation, as smaller players struggle to absorb rising compliance costs. However, this environment also presents opportunities for companies that proactively invest in regulatory expertise, advanced safety systems, and sustainable practices, enabling them to gain a competitive edge in the market.
Growing preference for clean-label and additive-free products
Consumer demand for minimally processed foods is driving significant changes in product formulations, compelling manufacturers to align functional requirements with clean-label positioning strategies. A study on Portuguese older adults highlights that while clean-label products initially receive lower liking scores, they exhibit higher purchase intent, particularly among consumers with higher education levels. This trend underscores the growing importance of clean-label products in influencing purchasing decisions. The clean-label movement is fostering innovation in natural ingredient alternatives. For example, companies like Sparxell are leveraging cellulose technology to develop plant-based colors as replacements for synthetic dyes, addressing consumer preferences for natural and sustainable options. This shift is most evident in developed markets, where consumers are willing to pay premium prices for products perceived as healthier and more natural. In response, manufacturers are reformulating products to minimize additive content while preserving functionality, creating a ripple effect across the supply chain. This evolution is pressuring suppliers of bleaching agents to innovate and deliver more efficient, natural solutions to meet the changing market demands.
*Our forecasts treat driver/restraint impacts as directional, not additive. The impact forecasts reflect baseline growth, mix effects, and variable interactions.
Segment Analysis
By Type: Hydrogen Peroxide Leadership and Ascorbic Acid Innovation
In 2025, hydrogen peroxide retains its dominant 42.74% market share, driven by its exceptional versatility as both a bleaching agent and an antimicrobial compound. This adaptability makes it indispensable across a wide range of food processing applications. The FDA, under regulation 21 CFR 178.1005, permits the use of hydrogen peroxide solutions at concentrations of up to 35% for sterilizing food-contact surfaces, providing manufacturers with clear regulatory guidance and operational flexibility. Additionally, its approval for applications such as flour treatment and packaging sterilization highlights its technical reliability and regulatory acceptance. The EPA's exemption of hydrogen peroxide residues from tolerance requirements in food commodities, when used in sanitizing solutions, further underscores its safety and broad applicability. A key advantage of hydrogen peroxide is its decomposition into water and oxygen, offering significant environmental benefits over chlorine-based alternatives. As sustainability becomes a critical focus in food processing operations, hydrogen peroxide's eco-friendly profile strengthens its market leadership and ensures its continued dominance.
Ascorbic acid is projected to be the fastest-growing segment, with an impressive CAGR of 7.33% from 2026 to 2031. This growth is attributed to its dual functionality as a bleaching agent and antioxidant, which aligns with the increasing demand for clean-label formulations. The FDA's designation of ascorbic acid as Generally Recognized as Safe (GRAS) provides manufacturers with confidence in its regulatory stability and consumer acceptance. Derived from natural sources and known for its vitamin C properties, ascorbic acid enables food processors to achieve effective bleaching while enhancing nutritional value, meeting consumer preferences for functional and natural ingredients. The FDA's food additive regulations under 21 CFR Part 172 further support its expanding applications beyond traditional bleaching roles. Research demonstrates ascorbic acid's effectiveness in preventing browning reactions during food processing, particularly when combined with citric acid, showcasing its technical advantages in specialized applications. Its compatibility with clean-label trends, coupled with its regulatory stability, positions ascorbic acid as a preferred alternative to synthetic bleaching agents, driving its rapid growth in the market.



By Form: Powder Stability and Liquid Precision
In 2025, powder formulations dominate the market with a 40.92% share, primarily due to their superior storage stability and cost-effective transportation. These characteristics make them highly appealing to large-scale food processors focused on enhancing operational efficiency. The powder form's resistance to degradation during storage and handling ensures consistent performance, a critical factor for industrial applications requiring long-term reliability. Additionally, FDA regulations mandate clear labeling for powder formulations, ensuring proper identification and safe usage. The reduced weight and volume of powders compared to liquid formulations significantly lower shipping costs, benefiting global supply chains. Furthermore, powder bleaching agents often eliminate the need for cold storage, simplifying logistics and reducing operational expenses for food processors. Their compatibility with automated dosing systems not only ensures precise application but also maintains the stability advantages that underpin their market leadership.
Liquid formulations, on the other hand, are projected to grow at the fastest rate, with a 7.52% CAGR from 2026 to 2031. This growth reflects the increasing demand from manufacturers for precise dosing capabilities and automated application systems. Liquid formulations enable advanced dosing systems that can dynamically adjust bleaching agent concentrations in real-time, aligning with specific product requirements and processing conditions. Their superior mixing properties and ability to achieve uniform distribution are particularly advantageous for consistent bleaching outcomes in food processing. Additionally, liquid formulations integrate seamlessly with continuous processing systems and automated quality control measures, driving their rapid adoption in modern food manufacturing facilities. The ability of liquid bleaching agents to provide precise pH control and facilitate real-time reaction monitoring further enhances process optimization and ensures consistent product quality, making them a preferred choice for manufacturers.
By Application: Bakery Leadership Challenged by Dairy Growth
In 2025, bakery products hold the largest application share at 36.74%, underscoring their critical reliance on bleaching agents to maintain consistent flour quality and enhance the visual appeal of baked goods. These agents perform essential functions in flour treatment, including modifying protein content, improving dough handling properties, and extending shelf life. The sector has also seen significant advancements, such as enzyme-bleach synergy technologies, which address the growing demand for clean-label products while maintaining performance. As consumer expectations for uniform texture, volume, and appearance in bakery products continue to rise, bleaching agents remain indispensable for ensuring consistency and efficiency in large-scale production processes.
Dairy products represent the fastest-growing application, with a projected CAGR of 7.66% from 2026 to 2031. This growth is driven by the increasing importance of product aesthetics and shelf life in a highly competitive retail environment. As consumers prioritize visually clean and fresh-looking dairy products, manufacturers are increasingly adopting food-grade bleaching agents to preserve product appearance throughout complex and extended distribution networks. Additionally, advancements in dairy processing technologies, such as the development of extended shelf-life milk and plant-based dairy alternatives, are further driving the demand for specialized bleaching formulations. This growth trajectory aligns with broader trends in premiumization and product differentiation, as manufacturers strive to meet evolving consumer preferences and stand out in the market.
Geography Analysis
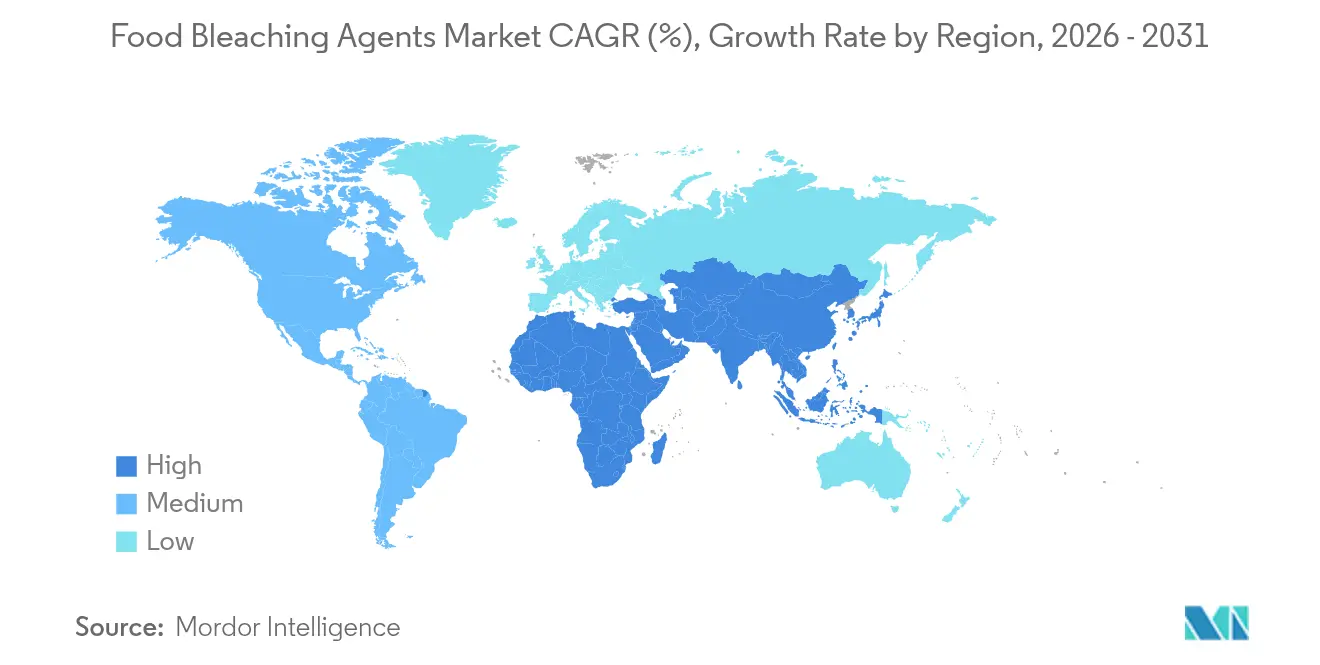
In 2025, Asia-Pacific holds a dominant 34.41% market share, attributed to its extensive food processing operations and the rapid shift in consumer preferences toward convenience and premium food products. China is experiencing significant growth in food manufacturing, driven by robust domestic demand and favorable government policies that support the sector. Similarly, India is witnessing a surge in processed food consumption, fueled by urbanization and changing dietary habits. The region's consistent growth over recent years is underpinned by increasing industrialization and the expansion of the middle-class population. Government-backed initiatives and foreign investments are strengthening food supply chains and enhancing processing capacities, which, in turn, are driving the demand for food-grade additives such as bleaching agents. The expansion of global food brands in Asia-Pacific further underscores the region's scalability in production and the growing emphasis on product consistency and visual appeal in processed food offerings.
South America is emerging as the fastest-growing region, with a projected CAGR of 7.55% from 2026 to 2031. Brazil leads the region with a USD 233 billion food processing sector in 2024, focusing on high-value export markets. The region's emphasis on innovation, particularly in plant-based and clean-label products, is creating opportunities for advanced bleaching technologies that meet international quality standards and cater to evolving consumer preferences. Argentina's strong agricultural processing base adds further growth potential as the country seeks to enhance the value of its commodity exports and expand its footprint in global food markets. South America's competitive edge in agricultural raw materials, coupled with improving processing infrastructure, positions the region as a key driver of demand for bleaching agents.
North America and Europe, as mature markets, are undergoing significant transformations driven by regulatory changes and the growing demand for clean-label products. These shifts are increasing the need for advanced bleaching solutions that comply with stringent safety and quality standards. The FDA's March 2025 GRAS rule reform, which mandates enhanced safety documentation for new food ingredients, highlights the region's leadership in food safety. In Europe, the Corporate Sustainability Reporting Directive is influencing purchasing decisions by prioritizing suppliers with strong sustainability credentials, reflecting the growing importance of environmental compliance. Meanwhile, the Middle East and Africa are showing potential for growth as food processing infrastructure develops and consumer preferences evolve. However, market penetration in these regions remains limited compared to more established markets, presenting opportunities for future expansion.

Regulatory Landscape
Regulation of food bleaching agents remains jurisdiction-specific, with notable divergence between North America and several European markets. In the United States, the FDA continues to regulate flour bleaching under standards of identity that require labeling when flour is bleached (21 CFR 137.105), while also maintaining ingredient-specific permissions. In September 2025, the FDA issued a final rule (90 FR 42535) amending 21 CFR 173.356 to permit hydrogen peroxide as an antimicrobial, oxidizing, reducing, and bleaching agent in meat and poultry processing under specified conditions, which expands the scope of food-processing use cases beyond traditional flour and dairy-related applications.
In Europe, Regulation (EC) No 1333/2008 uses a positive-list approach to additives, and chemical flour bleaching agents are tightly restricted or generally not authorized for flour and bread applications relative to U.S. practice. The UK further hardened its stance in one jurisdiction when The Bread and Flour (Wales) Regulations 2025 (2025 No. 88) entered into force on February 19, 2025, prohibiting the use of flour bleaching agents in the preparation of bread or flour. Alongside additive rules, supplier obligations are increasing through frameworks such as the EU Corporate Sustainability Reporting Directive, which influences procurement and documentation requirements for chemical suppliers serving food and packaging chains.
Value Chain Analysis
The value chain starts with upstream chemical feedstocks and manufacturing of oxidizing agents (notably hydrogen peroxide, chlorine dioxide, and benzoyl peroxide) and extends through formulation into food-grade products (powders and liquids), packaging, and distribution to industrial users in bakery, dairy, starch processing, and food packaging sterilization. Safety and regulatory compliance shape manufacturing and logistics: benzoyl peroxide used for flour and certain cheeses is affirmed as GRAS in the United States under 21 CFR 184.1157 with use governed by current Good Manufacturing Practice, and it is commonly formulated as powder blends with carriers (for example, starch and tricalcium phosphate) to improve dosing safety and mitigate handling risks during transport and at milling sites.
Midstream participants include specialty chemical producers and toll manufacturers, along with distributors that aggregate regional demand and manage food-grade storage and transport constraints for reactive peroxides. Downstream, large food processors integrate bleaching into process steps (flour treatment, whey and dairy applications, starch modification, and packaging sterilization), and they increasingly pair bleaching chemistry with process controls (automated dosing, monitoring, and validation) to meet residue limits and documentation expectations. Innovation also moves through the enzyme supply chain: EFSA published a positive safety evaluation in April 2024 for extending use of a peroxidase enzyme (from genetically modified Aspergillus niger) by DSM Food Specialties B.V. for bleaching in plant-based dairy analogue production, reinforcing an alternative route where chemical bleaching faces tighter regional constraints.
Competitive Landscape
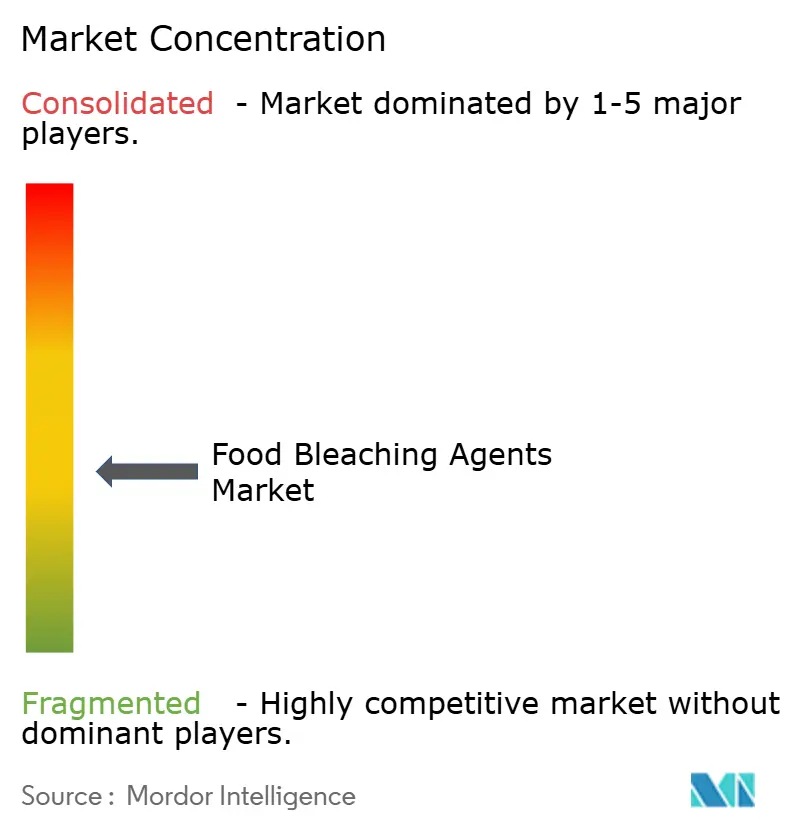
The global food bleaching agents market is moderately fragmented, comprising a mix of multinational chemical manufacturers and regional players competing across industrial and clean-label formulations. Leading companies such as BASF SE, Evonik Industries AG, and Brenntag SE dominate the market with established product portfolios, including hydrogen peroxide and benzoyl peroxide, which cater to industrial-scale applications. Simultaneously, newer entrants are gaining momentum by focusing on natural and enzyme-based alternatives, aligning with the increasing consumer preference for clean-label and sustainable solutions. Market differentiation is primarily driven by compliance with stringent food safety regulations and advancements in eco-friendly, residue-free bleaching technologies. This competitive environment fosters moderate pricing power while driving continuous innovation and specialization in niche segments to meet evolving consumer and regulatory demands.
Regulatory compliance has become a pivotal factor in shaping competitive strategies within the market. Companies are significantly investing in robust safety documentation, quality management systems, and supply chain transparency to meet the dynamic requirements of regulatory authorities such as the FDA and EFSA. The hydrogen peroxide contamination outbreak in 2024, which peaked at 26 reported cases before declining to 7 by early 2025, highlighted the critical importance of stringent quality systems. Firms with advanced safety protocols and transparent supply chains were better equipped to mitigate risks and maintain consumer trust, gaining a competitive edge during the crisis. This incident underscored the growing emphasis on regulatory adherence as a key determinant of market success and resilience.
Innovation in food bleaching technologies continues to accelerate, as demonstrated by recent patent activity in areas such as corn flour bleaching methods and advanced starch modification techniques. These advancements highlight the industry's dedication to R&D and its focus on addressing emerging market demands. Significant opportunities exist in developing sustainable production methods, exploring enzyme-bleach synergy applications, and creating specialized formulations for emerging food categories. As regulatory frameworks evolve to promote cleaner and safer processing technologies, the industry's proactive response to regulatory changes and safety concerns has driven consolidation trends. Companies are increasingly pursuing scale advantages and technical expertise to navigate the complexities of compliance, ensuring their competitiveness and long-term growth in a rapidly transforming market landscape.
Food Bleaching Agents Industry Leaders
-
BASF SE
-
Evonik Industries AG
-
Spectrum Chemical Mfg. Corp.
-
Brenntag SE
-
Arkema S.A
- *Disclaimer: Major Players sorted in no particular order

Market Opportunities and Future Outlook
Opportunities concentrate in solutions that help multinational processors operate across divergent additive regimes while maintaining consistent appearance and shelf-life outcomes. In permissive markets, regulatory clarity around core oxidizers supports formulation and application expansion: benzoyl peroxide remains affirmed as GRAS for flour bleaching under 21 CFR 184.1157 (GMP-limited), and hydrogen peroxide is listed under 21 CFR 184.1366 for specified food uses (including bleaching of dried egg whites and colored cheese whey). This regulatory base underpins demand for standardized, auditable food-grade supply and controlled dosing systems in large-scale processing.
In restrictive markets where chemical flour bleaching is prohibited or tightly constrained (including the EU framework under Regulation (EC) No 1333/2008 and regional bans such as China prohibiting benzoyl peroxide and calcium peroxide in flour production since 2011), whitespace exists for enzyme-led or process-led alternatives that deliver whitening without relying on banned chemistries. The April 2024 EFSA safety evaluation supporting peroxidase use for bleaching in plant-based dairy analogue production provides a concrete pathway for suppliers to build compliant enzyme-bleach systems for new categories. Another cross-region opportunity sits in starch and derivatives, where bleached starch is recognized under Codex GSFA and supported by updated JECFA specifications (including attention to residual reagents and byproducts), encouraging suppliers to offer reagent control, analytical testing, and documentation packages that ease customer audits and export compliance.
Recent Industry Developments
- March 2026: BASF finalized a definitive agreement for Silox to acquire selected hydrosulfite-related assets, including intellectual property rights, specialized containers, production equipment, technical expertise, and trademarks. The move followed BASF's September 2025 decision to discontinue hydrosulfite production at its Ludwigshafen site, reshaping supply options for reductive bleaching chemistries and shifting customers toward alternative sourcing and product qualification.
- March 2025: Nouryon launched Eka HP Puroxide, a food-grade hydrogen peroxide positioned with a lower carbon footprint for applications such as flour, starch, and oat hull processing. The product strengthens supplier differentiation around purity and sustainability credentials that industrial food processors increasingly require in audits and procurement.
- April 2024: Evonik introduced a carbon-neutral hydrogen peroxide in Europe under its Way to GO2 initiative. This added a certified route for customers seeking to reduce Scope 3 emissions while maintaining bleaching performance, supporting broader adoption of lower-footprint oxidizers in food and packaging-related processes.


Research Methodology Framework and Report Scope
Market Definition and Coverage
This market covers bleaching agents used in food processing to improve color, clarity, and consistency in finished foods, and it is sized in value terms based on sales of these agents across major food applications and regions.
Scope exclusions: We exclude bleaching used outside food processing, and we do not count downstream food sales value where bleaching agents are only an input.
Segmentation Overview
-
By Type
- Azodicarbonamide
- Hydrogen Peroxide
- Ascorbic Acid
- Chlorine Dioxide
- Calcium Peroxide
- Benzoyl Peroxide
- Others
-
By Form
- Powder
- Liquid
- Gas
-
By Application
- Bakery Products
- Dairy Products
- Oils and Fats
- Sugar and Sweeteners
- Others
-
By Geography
-
North America
- United States
- Canada
- Mexico
- Rest of North America
-
South America
- Brazil
- Argentina
- Colombia
- Chile
- Peru
- Rest of South America
-
Europe
- Germany
- United Kingdom
- Italy
- France
- Netherlands
- Poland
- Belgium
- Sweden
- Rest of Europe
-
Asia-Pacific
- China
- India
- Japan
- Australia
- Indonesia
- South Korea
- Thailand
- Singapore
- Rest of Asia-Pacific
-
Middle East and Africa
- South Africa
- Saudi Arabia
- United Arab Emirates
- Nigeria
- Egypt
- Morocco
- Turkey
- Rest of Middle East and Africa
-
North America
Data Sources, Market Sizing, and Validation
Desk Research
Desk work started with building a clear list of permitted food bleaching chemistries and their common end uses, so inputs did not get mixed with broader food additives. We referenced public sources such as food additive standards and evaluations from FDA and FAO and WHO JECFA, along with Codex Alimentarius references where applicable, to understand allowed use cases and typical labeling rules.
Next, we used supporting data to set realistic demand and pricing boundaries. This included trade and production statistics such as UN Comtrade for relevant chemical codes, USDA and Eurostat indicators tied to flour milling and bakery throughput, and selected peer-reviewed food science papers for usage rates and processing practices. Company filings, product catalogs, investor materials, and reputable press were also reviewed to track capacity additions, application focus, and price movement, and then a paid subscription covering company financials and a separate paid patent database were used to cross-check corporate exposure and innovation direction. These desk sources are illustrative, and other public and paid references were also used for data collection, validation, and research clarification.
Primary Interviews and Surveys
Primary work focused on checking what is actually being used and purchased in key food categories, then reconciling that with desk inputs on regulations and supply availability. We spoke with participants across ingredient manufacturing, food processor procurement, quality and regulatory teams, and distribution. Coverage was balanced across major consuming regions so assumptions on dosage, substitution, and pricing stayed realistic.
Distribution of primary research fieldwork respondents
| Company type | Respondent position | Region |
|---|---|---|
| Top tier: 37% | CXOs: 12% | APAC: 39% |
| Mid tier: 43% | Functional/Unit leaders: 37% | EMEA: 35% |
| Smaller Players: 20% | Managers: 51% | Americas: 26% |
Market-Sizing & Forecasting
Sizing was built using a top-down and bottom-up approach, where food processing demand pools were reconstructed from indicators like flour milling volumes, bakery and confectionery output trends, edible oil refining activity, and packaged food production signals. Those totals were then translated into bleaching agent demand using typical treatment rates and adoption levels by application. To keep the numbers grounded, we also ran selective bottom-up checks using sampled supplier ranges, distributor channel feedback, and a simple volume-by-average-selling-price build for priority regions, then adjusted where gaps showed up.
Key inputs that shaped the model included changes in regulations and permissible use limits, observed substitution between agent chemistries, import and export movement for relevant chemicals, price trends for major inputs, and regional shifts in processed food output. Forecasts were mainly driven through scenario analysis, where demand indicators for processed foods were projected and then stress-tested with primary feedback on pricing pass-through and expected usage-rate change, especially in markets tightening additive scrutiny. Where country data was thin, we filled gaps using proxy indicators like milling output and trade flows, then normalized results using interview-based ranges.
Data Validation & Update Cycle
Validation was done by comparing model outputs against independent signals, such as trade balances, production trends in high-bleaching applications, and observable price movement, then investigating any large variances before the numbers were finalized. Outliers were reviewed by another analyst, and assumptions were re-checked with follow-up calls when a region or application looked inconsistent with how buyers described their actual purchasing.
Reports are refreshed on an annual cycle, and interim updates are made when material events occur, such as regulatory changes, major capacity moves, or sharp raw material price swings. Before delivery, a final pass is completed so clients receive the latest updated view.
Mordor Intelligence's Food Bleaching Agents Market Estimate Compared With Other Published Estimates
It is normal to see different market numbers for food bleaching agents, mainly because sources draw the scope in different places and do not always use the same time base. Differences also come from how each publisher treats mixed-use chemicals, regional coverage depth, and whether the value is counted at the ingredient level or gets blended into broader food additives.
By tracking application-level demand indicators, food-grade inclusion rules, and annual price refreshes, Mordor Intelligence keeps the total centered on sales of bleaching agents used in foods, instead of allowing broader whitening chemicals or non-food processing uses to be counted in the same pool.
Benchmark comparison
| Source | Market Size | Gaps in Research Methodology |
|---|---|---|
| Mordor Intelligence | USD 0.90 B (2025) | |
| Industry Publisher A | USD 0.65 B (2020) | Uses an older base year and leans more on historical consumption patterns, which can miss later processed-food mix shifts and price resets that lift value in current years. |
| Industry Publisher B | USD 0.87 B (2026) | Uses a different base year and may apply wider inclusion around bleaching-related inputs by application, which changes the counted demand pool versus a tight food-grade agent definition. |
Taken together, the spread is largely explained by the year used and whether adjacent, mixed-use chemicals are included in the counted revenue. When the same demand pool signals and pricing refresh cadence are applied consistently, the market size becomes easier to reconcile across regions and end uses.


Key Questions Answered in the Report
What is the current size of the food bleaching agents market and how fast is it growing?
The market stands at USD 0.95 billion in 2026 and is forecast to rise to USD 1.23 billion by 2031, reflecting a 5.38% CAGR.
Which bleaching agent holds the largest share today?
Hydrogen peroxide leads with 42.74% of global revenue thanks to its dual bleaching and antimicrobial functions.
Why are liquid bleaching formulations gaining traction?
Liquid formats enable precise, automated dosing that reduces chemical use and fits seamlessly into continuous processing lines, driving a 7.52% CAGR.
Which application segment is expanding the quickest?
Dairy products are advancing at a 7.66% CAGR as processors use bleaching agents to improve visual appeal and extend refrigerated shelf life.
Page last updated on:


 Your data is secure and never sold or shared.


