Market Overview
| Study Period | 2021 - 2031 |
|---|---|
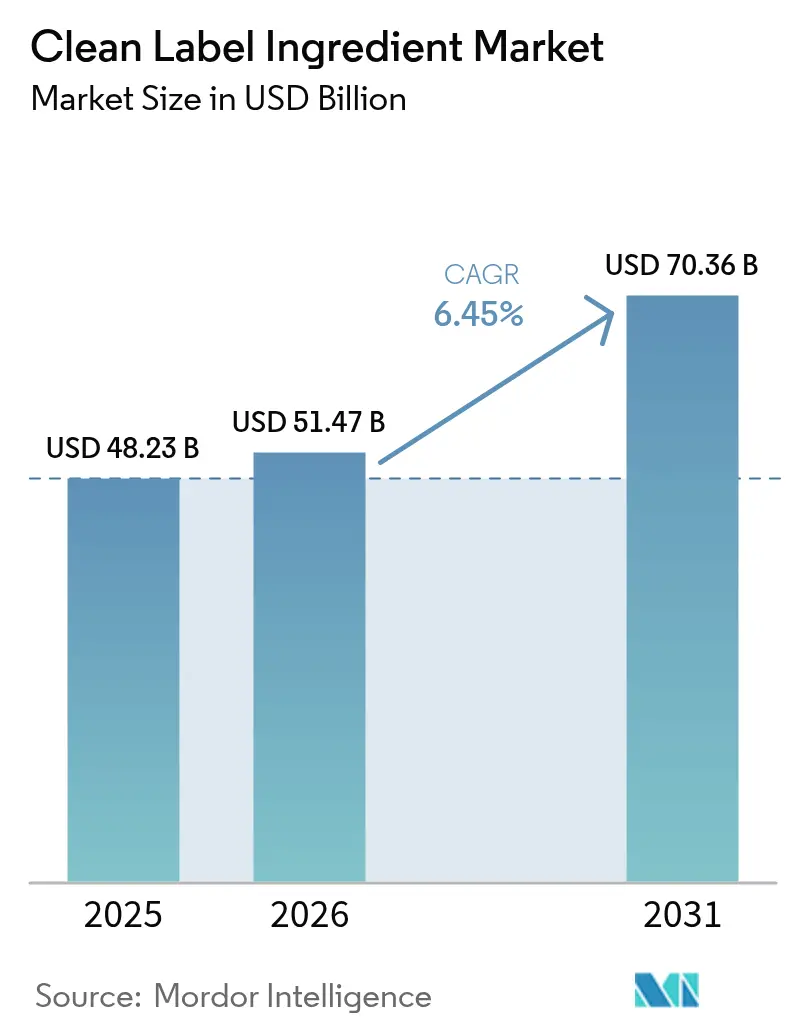
| Market Size (2026) | USD 51.47 Billion |
| Market Size (2031) | USD 70.36 Billion |
| Growth Rate (2026 - 2031) | 6.45% CAGR |
| Fastest Growing Market | Europe |
| Largest Market | North America |
| Market Concentration | Low |
Major Players
*Disclaimer: Major Players sorted in no particular order Image © Mordor Intelligence. Reuse requires attribution under CC BY 4.0. |
|
Clean Label Ingredient Market Analysis by Mordor Intelligence
The clean label ingredients market size was valued at USD 48.23 billion in 2025 and estimated to grow from USD 51.47 billion in 2026 to reach USD 70.36 billion by 2031, at a CAGR of 6.45% during the forecast period (2026-2031). The global clean label ingredients market is driven by increasing consumer demand for transparent, minimally processed, and naturally sourced products in the food and beverage industry. Heightened awareness of health and wellness, along with concerns about artificial additives, preservatives, colors, and genetically modified ingredients, has led manufacturers to reformulate products with simple and recognizable components. Regulatory requirements and stricter labeling standards in developed markets are further encouraging brands to provide clearer ingredient declarations and eliminate synthetic inputs. Moreover, the rising demand for plant-based, organic, and non-allergenic formulations is fostering innovation in natural emulsifiers, stabilizers, sweeteners, and colorants. The growth of premium and functional food segments, combined with the role of social media and digital platforms in educating consumers about ingredient sourcing and processing, is further supporting market expansion globally.
Key Report Takeaways
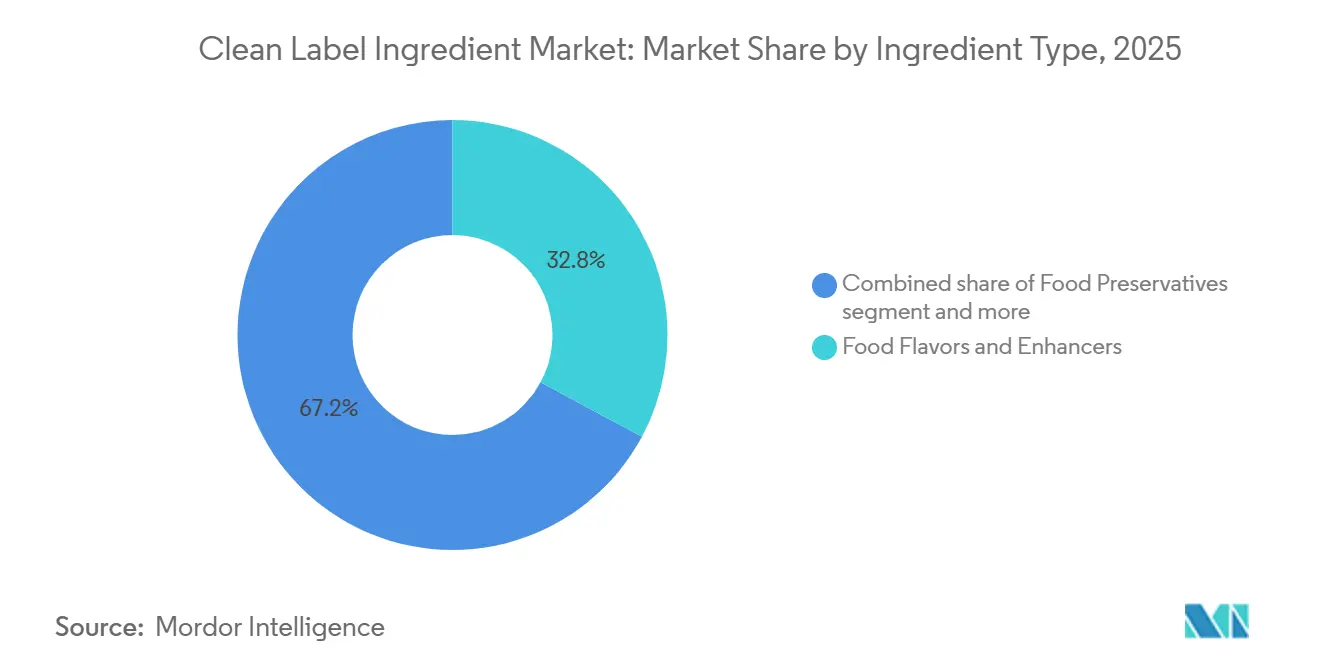
- By ingredient type, food flavors and enhancers led with 32.84% of the clean-label ingredients market share in 2025, while food colorants are forecast to expand at a 7.94% CAGR through 2031.
- By form, dry ingredients accounted for 55.71% share of the clean-label ingredients market size in 2025, whereas liquid formats are projected to grow at an 8.04% CAGR over 2026-2031.
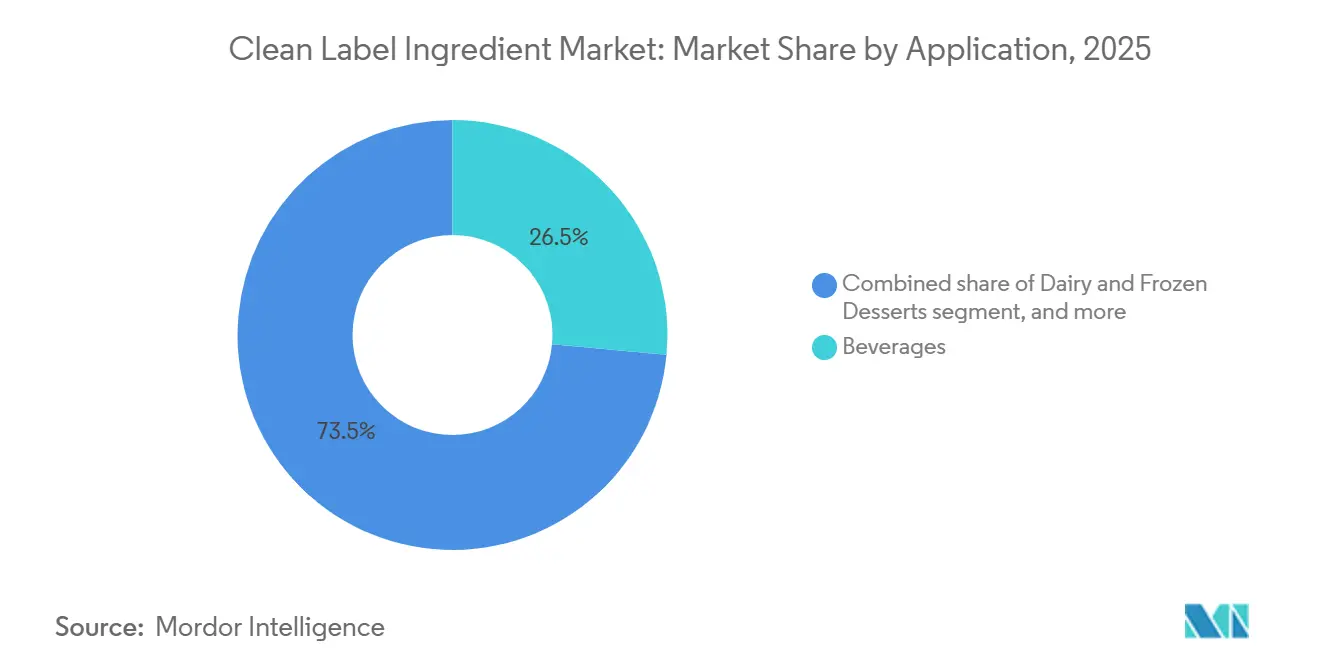
- By application, beverages held 26.47% revenue share in 2025, yet meat and meat products are advancing at a 7.53% CAGR to 2031.
- By geography, North America commanded 34.64% of the 2025 value; however, Europe is set to register the fastest 7.35% CAGR during the forecast period.
Note: Market size and forecast figures in this report are generated using Mordor Intelligence’s proprietary estimation framework, updated with the latest available data and insights as of 2026.
Global Clean Label Ingredient Market Trends and Insights
Drivers Impact Analysis*
| Driver | (~) % Impact on CAGR Forecast | Geographic Relevance | Impact Timeline |
|---|---|---|---|
| Rising health consciousness and concerns over artificial additives | +1.2% | Global | Medium term (2-4 years) |
| Increasing demand for plant-based, organic, and natural formulations | +1.1% | Global, with concentration in North America and Europe | Medium term (2-4 years) |
| Growing consumer preference for "free-from" and transparent labeling | +0.9% | North America and Europe | Short term (≤ 2 years) |
| Expansion of vegan and vegetarian product portfolios | +0.8% | Global, led by Europe and North America | Medium term (2-4 years) |
| Global health emergencies reinforcing demand for healthier diets | +0.6% | Global | Short term (≤ 2 years) |
| Increased R&D investment in clean-label ingredient innovation | +1.0% | Global, concentrated in North America, Europe, Asia-Pacific | Long term (≥ 4 years) |
| Source: Mordor Intelligence | |||


Rising health consciousness and concerns over artificial additives
Consumers are scrutinizing ingredient panels with unprecedented rigor, treating artificial additives as red flags rather than benign processing aids. The FDA's Red No. 3 ban in January 2025 validated years of consumer advocacy, forcing confectionery and bakery manufacturers to reformulate thousands of SKUs within compressed timelines[1]Source: U.S. Food and Drug Administration, "FDA to Revoke Authorization for the Use of Red No. 3 in Food and Ingested Drugs," fda.gov. This regulatory action followed California's 2024 prohibition of the same dye, creating a de facto national standard as brands opted for unified formulations rather than state-specific variants. The shift extends beyond colorants; preservatives such as BHA, BHT, and sodium benzoate face growing retailer restrictions, with major United States grocery chains publishing exclusion lists that mirror consumer petitions. Ingredion's 2025 consumer study documented that 45% of shoppers prioritize ingredient transparency over price, a behavioral pivot that narrows the cost disadvantage of natural alternatives and accelerates adoption across mid-tier brands[2]Source: Ingredion, "Less mystery, more meaning: Clean labels win consumer preference," ingredion.com. This trend is compressing product lifecycles, as brands that delay clean-label transitions risk shelf-space losses to competitors who preemptively reformulate.
Increasing demand for plant-based, organic, and natural formulations
Plant-derived ingredients are transitioning from niche to mainstream as food manufacturers respond to dual pressures: consumer demand for recognizable components and sustainability mandates from retail partners. The European Union's Farm to Fork strategy, launched in 2020 and gaining enforcement momentum through 2025, set a target of 25% organic farmland by 2030, indirectly boosting demand for organic-certified food ingredients as processors align supply chains with retailer sustainability scorecards[3]Source: European Environment Agency, "Agricultural area under organic farming in Europe," eea.europa.eu. Organic food sales in Europe reached record levels in 2025, with Germany, France, and the Netherlands leading per-capita consumption, creating pull-through demand for organic starches, natural emulsifiers, and plant-based texturizers. In North America, the USDA Organic seal remains a premium differentiator, yet its influence is spreading into conventional product lines as brands adopt "organic-inspired" formulations using non-GMO, minimally processed ingredients that approximate organic positioning without full certification costs
Growing consumer preference for “free-from” and transparent labeling
Consumer preference for "free-from" and transparent labeling is a key driver of the global clean label ingredients market. Shoppers are increasingly examining product labels and avoiding artificial additives, synthetic preservatives, GMOs, allergens, and chemically derived ingredients. Modern consumers prioritize clarity regarding ingredient sourcing, processing methods, and functional roles, prompting manufacturers to simplify formulations and use familiar, easily recognizable components. The growing influence of health-conscious millennials and Gen Z consumers, coupled with increased access to nutritional information via digital platforms, has amplified the demand for authenticity and brand accountability. In response, food and beverage companies are reformulating products to eliminate controversial ingredients and emphasize claims such as "no artificial colors," "no added preservatives," and "non-GMO." This trend is driving the adoption of natural emulsifiers, sweeteners, colors, and texturizers in global markets.
Expansion of vegan and vegetarian product portfolios
Vegan and vegetarian product lines are expanding beyond traditional plant-based meat and dairy analogs into condiments, snacks, and ready meals, each requiring clean-label ingredient solutions that deliver texture, flavor, and shelf stability without animal-derived inputs. Hydrocolloids such as pectin, guar gum, and xanthan gum are replacing gelatin and casein in applications ranging from gummy confections to yogurt alternatives, yet formulators face challenges replicating the mouthfeel and heat stability of animal proteins. Yeast extracts and fermented ingredients are gaining traction as umami enhancers in vegan sauces and seasonings, providing savory depth without monosodium glutamate or hydrolyzed vegetable protein, both of which carry negative consumer perceptions despite regulatory approval. The European market is particularly dynamic, with Germany and the United Kingdom leading vegan product launches. This proliferation is driving demand for multifunctional ingredients that simplify formulations, as brands seek to minimize label length while achieving performance parity with conventional products.
Restraint Impact Analysis*
| Restraint | (~) % Impact on CAGR Forecast | Geographic Relevance | Impact Timeline |
|---|---|---|---|
| Elevated cost of clean-label raw materials | -0.7% | Global, acute in price-sensitive emerging markets | Medium term (2-4 years) |
| Low consumer awareness in developing regions | -0.4% | Asia-Pacific (excluding Japan, South Korea), Middle East and Africa, parts of South America | Long term (≥ 4 years) |
| Regulatory complexity and approval challenges | -0.3% | Global, particularly cross-border manufacturers | Medium term (2-4 years) |
| Competition from lower-priced conventional ingredients | -0.5% | Global, concentrated in cost-driven segments | Short term (≤ 2 years) |
| Source: Mordor Intelligence | |||
Elevated cost of clean-label raw materials
Natural ingredient sourcing incurs structural cost premiums due to agricultural variability, lower extraction yields, and limited supplier bases compared to synthetic alternatives produced via established chemical synthesis routes. Ingredion's 2025 research quantified consumer willingness to pay 20% to 30% premiums for clean-label products, yet this tolerance varies sharply by category and income segment, creating adoption barriers in value-tier products where price elasticity remains high. Natural colorants exemplify this challenge; beetroot red and spirulina extract, both FDA-approved in 2025, cost 3 to 5 times more than synthetic Red No. 40 on a per-unit basis, and their lower tinctorial strength requires higher dosing to achieve equivalent hue intensity. Hydrocolloids face similar economics; organic-certified guar gum and pectin command premiums of 40% to 60% over conventional grades, driven by limited organic acreage and certification costs that cascade through supply chains. These cost differentials compress margins for food manufacturers, particularly in competitive categories like beverages and snacks, where retail pricing power is constrained, forcing brands to absorb costs or reformulate with lower-cost natural alternatives that may compromise sensory attributes.
Low consumer awareness in developing regions
Clean-label adoption exhibits stark geographic disparities, with awareness and willingness-to-pay concentrated in North America, Western Europe, and affluent Asia-Pacific markets, while price sensitivity and unfamiliarity with ingredient terminology limit uptake in emerging economies. In India, despite the Food Safety and Standards Authority of India (FSSAI) implementing stricter additive regulations, ingredient transparency ranks below price, brand familiarity, and convenience in purchase decisions for mass-market food products. Similar patterns emerge in Southeast Asia, Latin America, and Sub-Saharan Africa, where rising middle classes prioritize caloric density and affordability over label claims, and retail infrastructure skews toward traditional trade channels with limited space for premium-positioned clean-label SKUs. This awareness gap constrains market expansion, as ingredient suppliers and food manufacturers face longer education cycles and higher marketing costs to shift consumer preferences, delaying return on reformulation investments in these regions.
*Our forecasts treat driver/restraint impacts as directional, not additive. The impact forecasts reflect baseline growth, mix effects, and variable interactions.
Segment Analysis
By Ingredient Type: Flavors Lead, Colorants Accelerate
Food flavors and enhancers held 32.84% of market share in 2025, reflecting their ubiquity across applications from beverages to sauces, where they mask off-notes from functional ingredients and deliver signature taste profiles without synthetic additives. Yeast extracts and fermented ingredients are displacing monosodium glutamate and hydrolyzed vegetable protein in savory applications, providing umami depth while satisfying clean-label criteria. Additionally, food Sweeteners are navigating a complex landscape where stevia, monk fruit, and allulose compete for share against legacy options like cane sugar and high-fructose corn syrup, with regulatory approvals varying by region and consumer acceptance still building for some natural alternatives.
Food colorants are projected to grow at 7.94% CAGR through 2031, the fastest rate among ingredient types, driven by regulatory phase-outs of synthetic dyes and consumer rejection of artificial hues. The FDA's approval of beetroot red and spirulina extract as natural colorants, paired with the Red No. 3 ban, is accelerating reformulation in confectionery, dairy, and beverage categories where visual appeal is a primary purchase driver. Food Preservatives are experiencing steady demand as manufacturers replace synthetic sorbates and benzoates with rosemary extract, vinegar-based solutions, and fermentation-derived antimicrobials like nisin, though cost premiums and shorter shelf-life windows remain formulation hurdles.


By Form: Dry Dominates, Liquid Gains in Beverages
Dry ingredients accounted for 55.71% of market share in 2025, favored for their extended shelf life, lower transportation costs, and ease of storage in manufacturing facilities with limited cold-chain infrastructure. Powdered natural colorants, spray-dried flavors, and granulated sweeteners dominate bakery, confectionery, and snack applications where moisture content must be tightly controlled to prevent microbial growth and maintain crispness. Dry formats retain advantages in export-oriented markets and ambient-stable product categories, where transportation economics and shelf-life duration outweigh the processing convenience of liquids.
Liquid forms are expanding at 8.04% CAGR through 2031, the faster growth trajectory, as beverage and dairy manufacturers prioritize uniform dispersion and rapid incorporation in high-speed production lines where dry ingredients risk clumping or incomplete hydration. Liquid natural colors, such as beetroot juice concentrate and turmeric oleoresin, deliver superior color stability in acidic beverage systems compared to powdered equivalents, reducing formulation complexity and quality variability. Liquid preservatives, including vinegar-based solutions and fermented vegetable extracts, are gaining adoption in refrigerated dairy and ready-to-eat meal categories where they integrate seamlessly into aqueous matrices without requiring pre-dissolution steps. The shift toward liquid formats is also driven by clean-label positioning; consumers perceive liquid ingredients as less processed than spray-dried or encapsulated forms, even when functional performance is equivalent.
By Application: Beverages Anchor, Meat Reformulates Rapidly
Beverages captured 26.47% of application share in 2025, driven by clean-label reformulations in carbonated soft drinks, functional beverages, and plant-based milk alternatives, where consumers scrutinize ingredient lists and reject products containing artificial colors, flavors, or preservatives. The category's dominance reflects high SKU counts, frequent new product introductions, and retail shelf visibility that amplifies clean-label claims as competitive differentiators. Natural sweeteners like stevia and monk fruit are displacing aspartame and sucralose in zero-calorie beverages, though formulators continue refining blends to eliminate lingering bitter or metallic notes that depress repeat purchase rates.
Meat and meat products are advancing at 7.53% CAGR through 2031, the fastest growth among applications, as processors replace synthetic nitrites, phosphates, and flavor enhancers with fermentation-derived preservatives, plant extracts, and clean-label binders that maintain color, texture, and shelf life in fresh and processed meats. Bakery and confectionery applications are undergoing parallel transformations, with natural colors replacing synthetic dyes in icings, fillings, and coatings, and enzyme-modified starches substituting for chemically modified alternatives in texture systems. Sauces and condiments are adopting vinegar-based preservatives and natural thickeners to replace synthetic antimicrobials and modified starches, though achieving shelf-stable performance in ambient-distributed products requires higher dosing and careful pH management.
Geography Analysis
North America held 34.64% of the market share in 2025, driven by mature clean-label adoption influenced by consumer activism, retailer exclusion lists, and regulatory measures. Consumer activism has led to increased demand for transparency in product labeling, pushing manufacturers to adopt clean-label practices. Retailer exclusion lists, which outline unacceptable ingredients, have further pressured companies to reformulate products to meet these standards. Regulatory measures, including stricter guidelines on ingredient disclosures, have also played a significant role in shaping the market. The region's leading position is supported by the concentrated power of major grocery chains, which establish industry norms through published ingredient standards, and by a strong supply base of ingredient innovators capable of quickly scaling natural alternatives.
Europe is projected to grow at a CAGR of 7.35% through 2031, marking the fastest regional growth rate. This growth is driven by several factors, including the European Food Safety Authority's additive re-evaluation program, which aims to ensure the safety of food additives used within the region. Additionally, the EU's Farm to Fork sustainability strategy is promoting sustainable food production and consumption practices, further influencing market dynamics. High per-capita organic food consumption in countries such as Germany, France, and the Netherlands is also contributing significantly to this growth, as consumers increasingly prefer organic and clean-label products. The region's stringent regulatory environment is fostering clean-label transitions, with manufacturers proactively reformulating products to comply with potential future restrictions. This proactive approach helps companies avoid disruptions caused by bans or regulatory changes after products have entered the market.
Asia-Pacific exhibits bifurcated dynamics, with Japan, South Korea, and Australia mirroring Western clean-label trends, while China, India, and Southeast Asia balance rapid urbanization and rising health awareness against price sensitivity and lower familiarity with ingredient terminology. China's revised food safety standards, tightened additive limits and introduced traceability requirements that are elevating demand for natural ingredients among domestic and multinational brands targeting premium segments. South America is experiencing gradual adoption, with Brazil's organic food market expanding and Argentina leveraging its agricultural base to supply natural ingredients domestically and for export, though economic volatility and currency fluctuations constrain investment in reformulation. Middle East and Africa are emerging markets for clean-label ingredients, with halal certification intersecting with natural ingredient demand in Muslim-majority countries, and rising health awareness in the Gulf Cooperation Council nations driving premium product launches that feature simplified ingredient panels.


Competitive Landscape
The clean-label ingredients market is fragmented, characterized by dispersed competition. No single player holds a dominant share, with regional specialists, fermentation startups, and botanical extract suppliers competing alongside multinational ingredient conglomerates. This structure creates white-space opportunities for agile entrants who can deliver cost-effective natural alternatives with superior functionality, particularly in categories like natural preservatives and plant-based texturizers, where incumbents face performance trade-offs.
Strategic patterns reveal a bifurcation: large players such as Cargill, ADM, and Ingredion are leveraging scale to invest in fermentation platforms and enzyme technologies that reduce production costs, while mid-tier specialists like Kalsec and Sensient focus on niche applications, natural spice extracts, botanical colorants, where technical expertise and customer co-development justify premium pricing.
Technology deployment is reshaping competitive positioning, with companies investing in AI-driven formulation platforms that predict ingredient interactions and optimize sensory outcomes, reducing reformulation cycles from months to weeks. Emerging disruptors include precision fermentation startups producing animal-free dairy proteins and heme analogs, ingredients that satisfy clean-label criteria while addressing sustainability concerns, though commercialization timelines and regulatory approvals remain multi-year hurdles. The competitive landscape is further complicated by vertical integration moves, with food manufacturers acquiring ingredient suppliers to secure supply and capture margin.
Clean Label Ingredient Industry Leaders
-
Archer-Daniels-Midland Company
-
Cargill, Incorporated
-
Ingredion Incorporated
-
DSM-Firmenich
-
International Flavor and Fragrances Inc.
- *Disclaimer: Major Players sorted in no particular order

Recent Industry Developments
- April 2025: Shiru, a company focused on AI-driven ingredient innovation, commenced large-scale production of two new plant-based clean-label ingredients, uPro™ and OleoPro™. uPro™ is a structured protein derived from potato protein, offering effective texturizing and emulsification properties for various food formulations. OleoPro™, on the other hand, is a protein-based fat substitute aimed at significantly reducing saturated fat content while maintaining the functional performance and sensory qualities of traditional fats.
- November 2024: GNT Group B.V. launched EXBERRY Shade Vivid Orange, a clean-label product made from non-GMO paprika. The product delivers orange coloring without using conventional paprika oleoresins or extracts.
- July 2024: Givaudan Sense color launched Amaize orange-red. Amaize line of corn-based anthocyanin colors has a bright orange-red shade that closely matches Red 40 in acidic applications. It is available in powder and liquid forms and is suitable for low-pH applications including beverages, confections, fruit preps, ice lollies, sorbets, and snack seasonings.
- May 2024: JK Sucralose Inc. has launched a sucralose technical transformation project in Sheyang Port Economic Development Zone, investing over CNY 1 billion. According to the brand, the project covers 390,000 square meters, including nearly 100,000 square meters for new production facilities. With an annual capacity of 4,000 tons, it is expected to generate an output value of CNY 2 billion at full operation.
- February 2024: Ajinomoto Co. opened a new office in Silicon Valley, United States. The office provides different types of food solutions, including clean-label ingredients, in the United States market. The purpose of this expansion was to expand the company’s business.


Global Clean Label Ingredient Market Report Scope
Clean label ingredients refer to products that are derived through simpler processes, free from genetically modified organisms (GMOs), or have label-friendly claims made by manufacturers. Additionally, products that are free from unsafe additives or ingredients and free of vague or misleading terminology that hides health risks or implies non-existent health benefits are not considered clean label ingredients.
The clean label ingredients market is segmented by ingredient type, form, application, and geography. By ingredient type, the market is segmented into food preservatives, food sweeteners, food colorants, food hydrocolloids, food flavors and enhancers, and other ingredient types. By form, the market is segmented into dry and liquid. By application, the market is segmented into beverages, bakery and confectionery, dairy and frozen desserts, meat and meat products, sauce and condiments, and other applications. By geography, the market is segmented into North America, Europe, Asia-Pacific, South America, the Middle East, and Africa. The market sizing has been done in value terms in USD for all the abovementioned segments.
By Ingredient Type
| Food Preservatives |
| Food Sweeteners |
| Food Colorants |
| Food Hydrocolloids and Texturizers |
| Food Flavors and Enhancers |
| Other Ingredients Types |
By Form
| Dry |
| Liquid |
By Application
| Bakery and Confectionery |
| Dairy and Frozen Desserts |
| Beverages |
| Meat and Meat Products |
| Sauces and Condiments |
| Other Applications |
By Geography
| North America | United States |
| Canada | |
| Mexico | |
| Rest of North America | |
| South America | Brazil |
| Argentina | |
| Colombia | |
| Chile | |
| Peru | |
| Rest of South America | |
| Europe | United Kingdom |
| Germany | |
| France | |
| Italy | |
| Spain | |
| Netherlands | |
| Poland | |
| Belgium | |
| Sweden | |
| Rest of Europe | |
| Asia-Pacific | China |
| Japan | |
| India | |
| South Korea | |
| Australia | |
| Indonesia | |
| Thailand | |
| Singapore | |
| Rest of Asia-Pacific | |
| Middle East and Africa | Saudi Arabia |
| South Africa | |
| United Arab Emirates | |
| Nigeria | |
| Morocco | |
| Egypt | |
| Turkey | |
| Rest of Middle East and Africa |
| By Ingredient Type | Food Preservatives | |
| Food Sweeteners | ||
| Food Colorants | ||
| Food Hydrocolloids and Texturizers | ||
| Food Flavors and Enhancers | ||
| Other Ingredients Types | ||
| By Form | Dry | |
| Liquid | ||
| By Application | Bakery and Confectionery | |
| Dairy and Frozen Desserts | ||
| Beverages | ||
| Meat and Meat Products | ||
| Sauces and Condiments | ||
| Other Applications | ||
| By Geography | North America | United States |
| Canada | ||
| Mexico | ||
| Rest of North America | ||
| South America | Brazil | |
| Argentina | ||
| Colombia | ||
| Chile | ||
| Peru | ||
| Rest of South America | ||
| Europe | United Kingdom | |
| Germany | ||
| France | ||
| Italy | ||
| Spain | ||
| Netherlands | ||
| Poland | ||
| Belgium | ||
| Sweden | ||
| Rest of Europe | ||
| Asia-Pacific | China | |
| Japan | ||
| India | ||
| South Korea | ||
| Australia | ||
| Indonesia | ||
| Thailand | ||
| Singapore | ||
| Rest of Asia-Pacific | ||
| Middle East and Africa | Saudi Arabia | |
| South Africa | ||
| United Arab Emirates | ||
| Nigeria | ||
| Morocco | ||
| Egypt | ||
| Turkey | ||
| Rest of Middle East and Africa | ||


Key Questions Answered in the Report
What is driving the clean label ingredients market growth?
Demand for healthier diets, stricter additive regulations and brand reformulation initiatives underpin the sector’s 6.45% CAGR forecast.
Which ingredient segment is growing the fastest?
Food colorants lead growth with a projected 7.94% CAGR, propelled by regulatory moves to eliminate synthetic dyes.
Which region currently dominates global revenue?
North America holds the largest regional share at 34.64% owing to a well-informed consumer base and active FDA oversight.
Why do beverages hold the largest application share?
Quick innovation cycles allow beverage makers to showcase natural flavors, colors and functional claims that resonate with health-minded shoppers.
Page last updated on:


