Allergy Immunotherapy Market Size and Share
Market Overview
| Study Period | 2020 - 2031 |
|---|---|
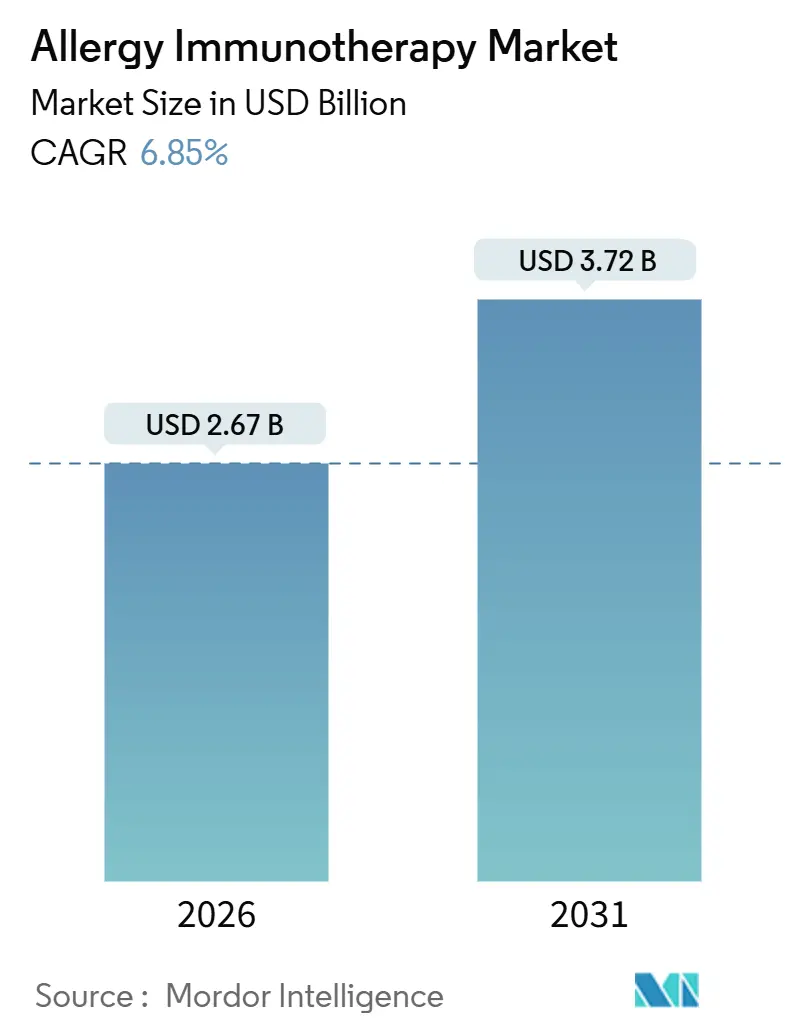
| Market Size (2026) | USD 2.67 Billion |
| Market Size (2031) | USD 3.72 Billion |
| Growth Rate (2026 - 2031) | 6.85% CAGR |
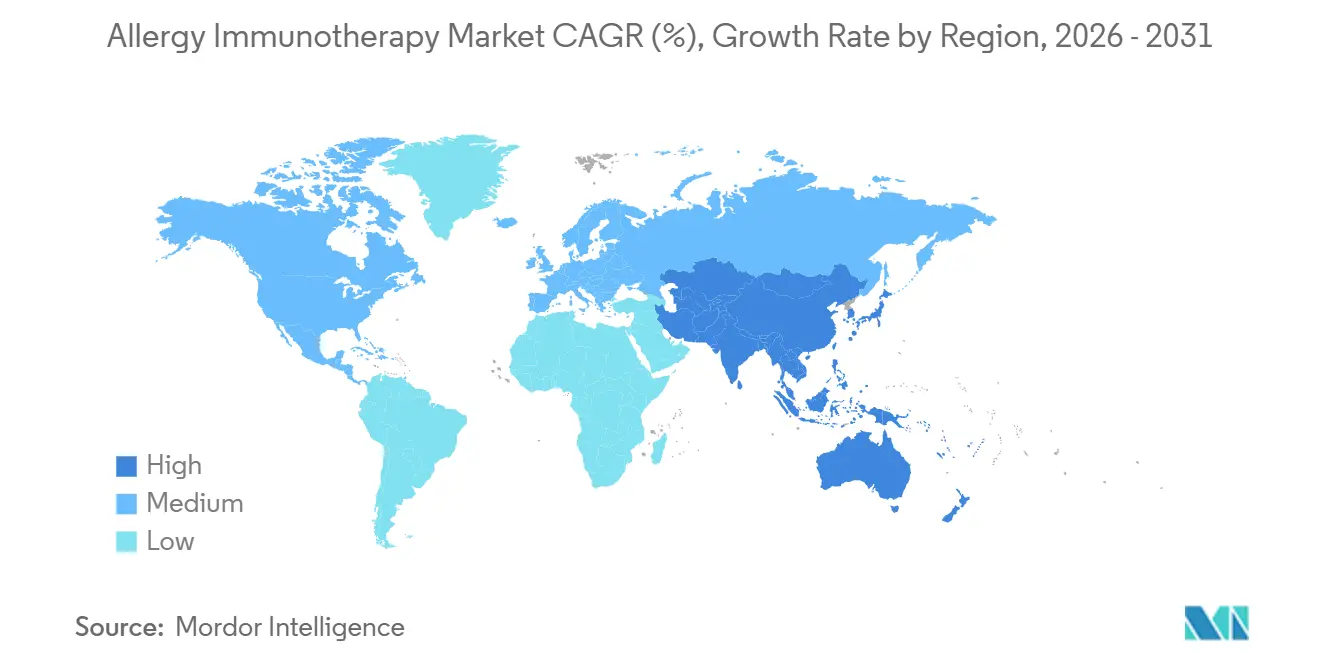
| Fastest Growing Market | Asia-Pacific |
| Largest Market | North America |
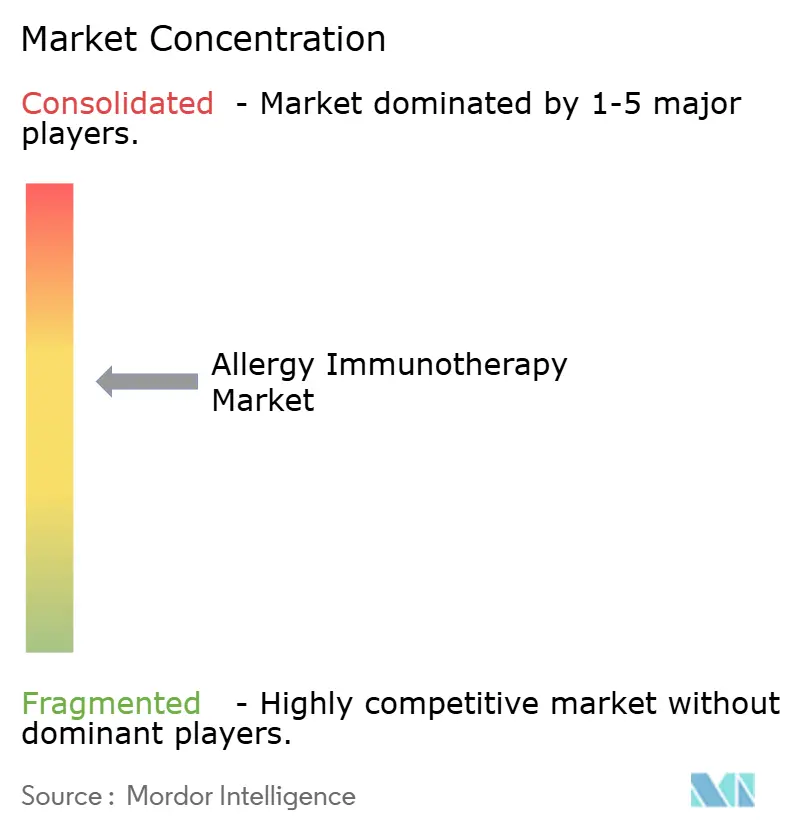
| Market Concentration | Medium |
Major Players *Disclaimer: Major Players sorted in no particular order Image © Mordor Intelligence. Reuse requires attribution under CC BY 4.0. | |
Allergy Immunotherapy Market Analysis by Mordor Intelligence
The Allergy Immunotherapy Market size is estimated at USD 2.67 billion in 2026, and is expected to reach USD 3.72 billion by 2031, at a CAGR of 6.85% during the forecast period (2026-2031).
This expansion rests on a structural pivot from symptomatic relief toward disease-modifying care, aided by swift regulatory approvals for sublingual immunotherapy tablets, widening pediatric labels, and incentives within value-based care contracts that reward durable remission. Regulatory milestones such as the FDA’s 2025 pediatric expansion for ODACTRA and the 2024 toddler approval for PALFORZIA enlarged the treatable population and validated clinical confidence in earlier intervention. Payers are motivated by the sizable economic burden—food and respiratory allergies cost the United States nearly USD 110 billion per year—which underscores the financial logic of funding disease-modifying approaches that trim emergency visits and long-term drug use. Competitive intensity is moderate, with ALK-Abelló holding roughly 45% of global revenue in 2024, while Stallergenes Greer, HAL Allergy, and Allergy Therapeutics share much of the remainder. Adoption hurdles persist in low-income regions, yet digital telemedicine platforms and mail-order pharmacy models lower access barriers and signal fresh growth pathways.
Key Report Takeaways
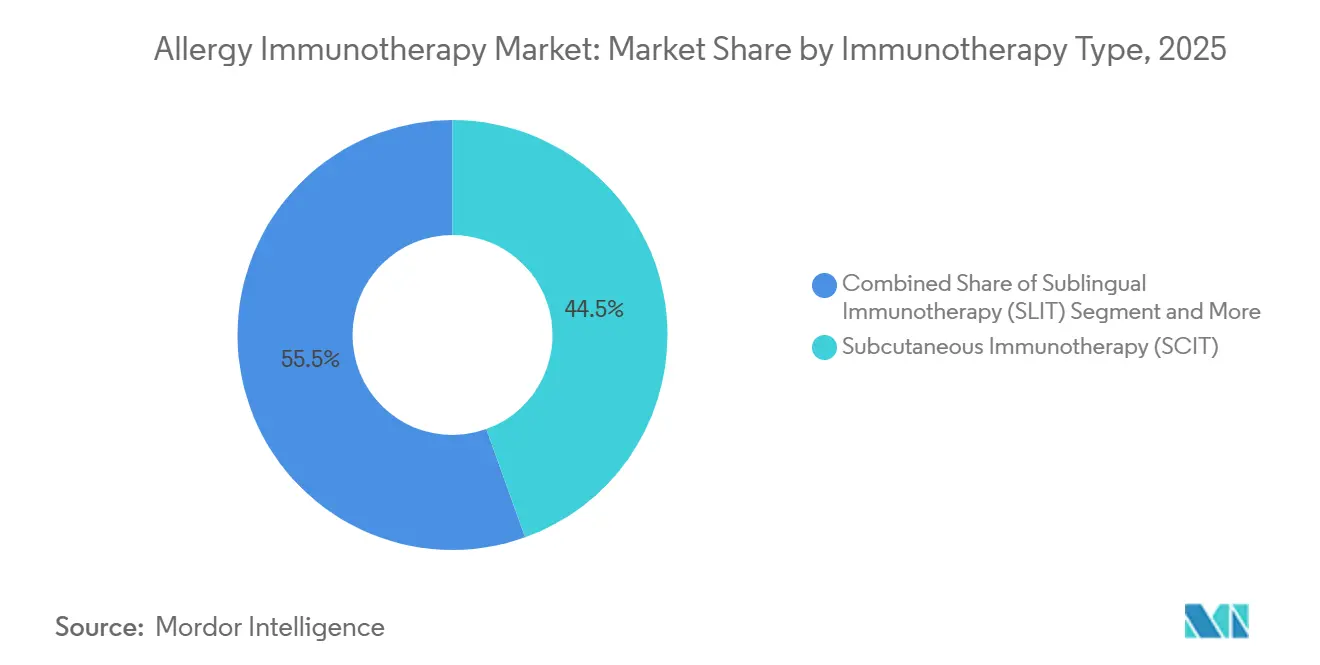
- By immunotherapy type, Subcutaneous Immunotherapy led with 44.55% Allergy Immunotherapy market share in 2025, while Sublingual Immunotherapy is on track for a 15.25% CAGR to 2031.
- By allergy type, Allergic Rhinitis commanded 47.53% of the Allergy Immunotherapy market size in 2025; Food Allergy is projected to accelerate at a 16.85% CAGR through 2031.
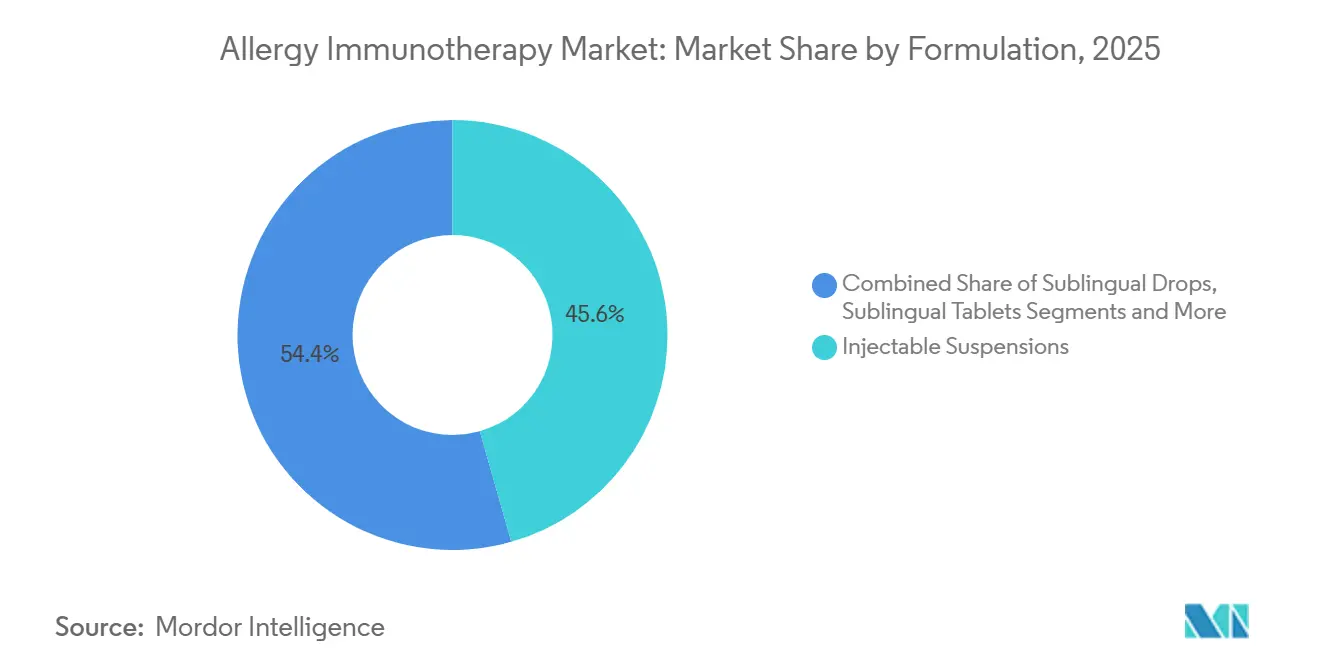
- By formulation, Injectable Suspensions generated 45.63% of 2025 revenue, whereas Sublingual Tablets will rise at a 15.87% CAGR.
- By distribution, Retail and Hospital Pharmacies held 51.23% share in 2025; E-commerce and Mail-Order channels are set for a 17.7% CAGR to 2031.
- By geography, North America contributed 42.53% of 2025 revenue, but Asia-Pacific will grow at a 15.21% CAGR over the forecast window.
Note: Market size and forecast figures in this report are generated using Mordor Intelligence’s proprietary estimation framework, updated with the latest available data and insights as of January 2026.
Global Allergy Immunotherapy Market Trends and Insights
Drivers Impact Analysis*
| Driver | (~) % Impact on CAGR Forecast | Geographic Relevance | Impact Timeline |
|---|---|---|---|
| Growing global burden & economic cost of respiratory and food allergies | +1.8% | Global, with highest burden in North America & EU | Long term (≥ 4 years) |
| Expedited approvals & reimbursement of SLIT tablets in US, EU & Japan | +1.5% | North America, EU, Japan | Medium term (2-4 years) |
| Inclusion of AIT in value-based care frameworks | +1.0% | North America & EU | Medium term (2-4 years) |
| Home-based self-administration platforms improving adherence | +1.2% | Global, early adoption in North America | Short term (≤ 2 years) |
| AI-guided personalization of allergen extracts & micro-dosing regimens | +0.7% | North America, EU, Asia-Pacific (pilot markets) | Long term (≥ 4 years) |
| Microbiome-modulating adjuvants boosting efficacy & durability | +0.6% | Global (preclinical to early clinical) | Long term (≥ 4 years) |
| Source: Mordor Intelligence | |||
Growing Global Burden & Economic Cost of Respiratory and Food Allergies
Direct medical spending and productivity losses from food, nasal, and asthma-linked allergies now exceed USD 110 billion in the United States, amplifying payer appetite for interventions that promise durable relief. Global prevalence continues to climb as urbanization and lifestyle shifts intensify exposure, pushing peanut allergy alone to affect 1.5 million U.S. children. Biologic therapies carry five-figure annual costs, positioning long-course immunotherapy as a comparatively economical option for health systems. Employers recognize that unmanaged allergies drive absenteeism, especially among school-age children whose reactions disrupt parental work schedules. The magnitude of this economic drag supplies momentum for broader reimbursement of disease-modifying therapies.
Expedited Approvals & Reimbursement of SLIT Tablets in US, EU & Japan
Between 2024 and 2025 the FDA, EMA, and PMDA approved multiple pediatric and adult SLIT indications, shrinking regulatory bottlenecks and sharpening the competitive edge of tablet formats. Concurrent payer rule changes added Relative Value Units for home-based dosing and clarified CPT billing, trimming administrative hurdles[1]Centers for Medicare & Medicaid Services, “Medicare Physician Fee Schedule and Reimbursement Updates,” CMS, cms.gov. These synchronized updates lower out-of-pocket costs and accelerate commercial uptake, especially among pediatric cohorts now eligible for earlier treatment. The trajectory signals a virtuous cycle where regulatory validation feeds payer confidence and vice versa.
Inclusion of AIT in Value-Based Care Frameworks
Commercial insurers and Medicare Advantage plans bundled multi-year SLIT and SCIT regimens into performance-tied packages starting in 2024, paying bonuses when symptom control cuts emergency visits and rescue prescriptions. Providers now measure outcomes through remote symptom apps, rendering immunotherapy a quantifiable quality metric. For allergists this model converts previously episodic revenue streams into predictable cash flow, whereas payers benefit from lower total cost of care.
Home-Based Self-Administration Platforms Improving Adherence
Telemedicine startups deliver at-home SLIT kits alongside virtual allergist consultations, removing geographic and scheduling barriers. Platforms such as Wyndly and Curex scaled sharply after introducing subscriptions priced at USD 99 per month and embedding dosing reminders and pollen alerts within mobile apps. Early discontinuation rates drop when patients avoid weekly office visits, confirming convenience as a primary adoption lever. Regulatory acceptance of virtual initiation visits buttresses this shift and widens reach to rural communities.
Restraints Impact Analysis*
| Restraint | (~) % Impact on CAGR Forecast | Geographic Relevance | Impact Timeline |
|---|---|---|---|
| Low diagnosis & therapy uptake in low-income regions | -0.9% | Sub-Saharan Africa, South Asia, Latin America | Long term (≥ 4 years) |
| Product-specific anaphylaxis risk & safety-monitoring costs | -0.6% | Global | Short term (≤ 2 years) |
| Irregular supply of GMP-grade allergen source materials | -0.5% | Global, acute in Europe & North America | Medium term (2-4 years) |
| Regulatory uncertainty for novel adjuvants & delivery systems | -0.4% | Global, particularly US & EU | Medium term (2-4 years) |
| Source: Mordor Intelligence | |||
Low Diagnosis & Therapy Uptake in Low-Income Regions
Many emerging economies lack allergists, diagnostic labs, and reimbursement pathways, forcing patients to rely on over-the-counter drugs that mask rather than resolve disease. Import tariffs and cold-chain challenges inflate extract costs. Public health funding favors infectious disease, delaying large-scale allergy programs. These structural gaps hold back penetration despite rising prevalence and documented productivity losses.
Product-Specific Anaphylaxis Risk & Safety-Monitoring Costs
Registry data recorded 173 immunotherapy-induced anaphylaxis events in Europe during 2024, most within the first treatment week[2]European Anaphylaxis Registry, “Allergen Immunotherapy-Induced Anaphylaxis Data 2024,” anaphylaxisregistry.org . Mandatory post-injection observation and liability premiums weigh on clinic economics, prompting some physicians to drop SCIT services. Needle-free rescue devices such as neffy ease user anxiety but do not eliminate monitoring overhead.
*Our forecasts treat driver/restraint impacts as directional, not additive. The impact forecasts reflect baseline growth, mix effects, and variable interactions.
Segment Analysis
By Immunotherapy Type: SLIT Gains Ground on Convenience
In 2025 Subcutaneous Immunotherapy captured 44.55% Allergy Immunotherapy market share, yet Sublingual Immunotherapy is forecast to outpace with a 15.25% CAGR. The rise stems from home dosing that erases weekly clinic visits, a compelling benefit for working adults and parents. ALK-Abelló’s tablet revenues advanced 24% year over year in 2024, signaling strong uptake. SCIT retains an edge where multiple allergen sensitivities demand custom mixes, but compliance hurdles curb growth. Epicutaneous and oral modalities remain developmental, positioning SLIT as the near-term disruptor of choice.
Digital pharmacies integrate testing, formulation, shipping, and monitoring into single-fee subscriptions that resonate with digitally fluent consumers. Regulatory clearance for virtual initiation visits legitimizes these models. Clinics focused on SCIT grapple with lower revenue per hour and liability risk, pushing some to refer patients to hospital settings. While EPIT and OIT may disrupt long-term, SLIT dominates the growth story through 2031.


By Allergy Type: Food Allergy Surges on OIT Momentum
Allergic Rhinitis maintained 47.53% of the Allergy Immunotherapy market size in 2025, yet Food Allergy is set to climb at a 16.85% CAGR following PALFORZIA’s toddler label and supportive NIH data showing 100% tolerance in children completing at-home peanut OIT. Biologic approvals targeting food allergy amplify systemic attention and payer openness. Asthma and venom segments remain clinically important niches, while atopic dermatitis emerges as a pipeline frontier.
Peanut, egg, and milk allergies draw investment as early intervention may induce lifelong tolerance. The commercialization of low-cost, non-proprietary OIT regimens threatens branded incumbents, potentially reshaping competitive dynamics. Meanwhile rhinitis growth decelerates as biologics compete for moderate-to-severe cases.
By Formulation: Tablets Displace Drops and Injections
Injectable Suspensions held 45.63% revenue share in 2025, yet Sublingual Tablets will advance at a 15.87% CAGR as standardized dosing, shelf stability, and pediatric approvals widen adoption. Tablets reduce cold-chain and contamination concerns inherent to multi-dose droppers. Regulatory agencies prioritize tablet reviews, cementing their standing as the default SLIT vehicle.
Drops retain utility where compounded mixtures address polysensitized patients, but adherence declines when patients must count drops daily. Transdermal patches offer potential once adhesion and efficacy hurdles are cleared. For now tablet convenience, precision, and reimbursement alignment underpin their steep growth curve.
By Distribution Channel: E-Commerce Disrupts Traditional Pharmacies
Retail and Hospital Pharmacies controlled 51.23% of 2025 revenue; however, e-commerce and mail-order outlets will log a 17.7% CAGR through 2031 as telemedicine platforms bundle formulation, virtual oversight, and doorstep delivery. These models slash middle-mile costs while embedding digital reminders that uplift adherence. Physician-dispensed SCIT extracts persist, but shrinking clinic capacity and rising liability premiums propel a shift toward tablet-centric mail fulfillment.
Regulatory green lights for tele-initiation visits fuel adoption in rural settings. Pharmacy chains adapt by adding online portals, yet pure-play digital platforms retain a user-experience edge. Overall channel dynamics mirror broader healthcare’s tilt toward home-based care.
Geography Analysis
North America contributed 42.53% of 2025 revenue, buoyed by Medicare reimbursement updates and dense allergist networks. FDA pediatric label expansions unlocked new cohorts and consolidated the United States as the single largest Allergy Immunotherapy market. Canadian approvals pending as of 2025 and Mexican private-insurance uptake maintain regional momentum, though biologic competition tempers long-term growth.
Asia-Pacific is projected to record a 15.21% CAGR, the fastest among regions. Japan’s 2024 approval of ITULAZAX for cedar pollen meets a widespread seasonal burden, with Torii Pharmaceutical data showing year-over-year efficacy gains. Chinese authorities require bridging trials for tablets, pushing initial focus to SCIT, while India’s 2025 launch of a house dust mite tablet leverages local distribution heft. Rising disposable income and urban allergy prevalence drive demand across South Korea and Australia.
Europe remains a mature but vital market, accounting for 71% of ALK-Abelló revenue in 2024. Germany tops country sales, supported by Therapieallergene-Verordnung provisions that sustain named-patient supply during regulatory review[3]Allergy Therapeutics plc, “Transforming Lives: Annual Report and Accounts 2023,” Allergy Therapeutics, allergytherapeutics.com. EMA approval of neffy in 2024 adds anaphylaxis management to the regional portfolio. Pricing pressures and generic entrants limit pricing power, yet broad reimbursement keeps volumes stable. Middle East and Africa and South America trail due to sparse allergist networks and limited public funding. Pilot projects hint at future upside but near-term contributions remain modest.

Competitive Landscape
The sector shows moderate concentration. ALK-Abelló’s share reflects a strong tablet franchise and global reach. Stallergenes Greer, HAL Allergy, and Allergy Therapeutics collectively lift the combined top-four share, leaving a sizeable long-tail of regional extract compounding labs. Strategic focus splits across three fronts: expansion into Asia-Pacific growth corridors, broadening into adjacencies such as anaphylaxis rescue, and embedding digital tools to differentiate service value.
ALK-Abelló’s 2024 agreement to license neffy outside the United States and select territories underscores adjacency expansion. Allergy Therapeutics advances its Grass MATA MPL six-shot regimen that met a key Phase III endpoint, promising convenience superiority. Biosimilars like Omlyclo inject price competition into adjunct biologics. Telemedicine entrants press disruptive pressure by controlling the full consumer journey from testing to adherence analytics.
Patent filings cluster around novel adjuvants, micro-dosing algorithms, and connected delivery devices. M&A volume remains muted as firms weigh regulatory risk, yet targeted acquisitions of technology platforms and pipeline assets continue.
Allergy Immunotherapy Industry Leaders
ALK-Abello A/S
Stallergenes Greer
Allergy Therapeutics plc
HAL Allergy Group
Torii Pharmaceutical Co., Ltd.
- *Disclaimer: Major Players sorted in no particular order

Recent Industry Developments
- October 2025: Stallergenes Greer reported its Phase IIIb YOBI trial reached its primary endpoint in pediatric birch-allergic rhino-conjunctivitis patients.
- September 2025: Regeneron announced positive Phase 3 data for allergen-blocking antibodies in cat and birch allergy.


Research Methodology Framework and Report Scope
Market Definitions and Key Coverage
Our study defines the allergy immunotherapy market as the sale of prescription preparations that deliver controlled, escalating doses of specific allergens by injection, sublingual tablets or drops, skin patches, or oral mixtures to induce long-term immune tolerance and cut symptom burden. These products are counted at manufacturer selling price and cover treatments for respiratory, food, venom, and atopic allergies in all care settings worldwide.
Scope Exclusion: Diagnostic tests, general antihistamines, biologic monoclonals that are not dosed as desensitization courses, and compounding-only custom mixes are outside our lens.
Segmentation Overview
- By Immunotherapy Type
- Subcutaneous Immunotherapy (SCIT)
- Sublingual Immunotherapy (SLIT)
- Epicutaneous Immunotherapy (EPIT)
- Oral Immunotherapy (OIT)
- By Allergy Type
- Allergic Rhinitis
- Allergic Asthma
- Food Allergy
- Venom Allergy
- Atopic Dermatitis
- Others
- By Formulation
- Injectable Suspensions
- Sublingual Drops
- Sublingual Tablets
- Transdermal Patches
- By Distribution Channel
- Direct-to-Physician Sales
- Retail & Hospital Pharmacies
- E-commerce / Mail-Order
- Geography
- North America
- United States
- Canada
- Mexico
- Europe
- Germany
- United Kingdom
- France
- Italy
- Spain
- Rest of Europe
- Asia-Pacific
- China
- Japan
- India
- South Korea
- Australia
- Rest of Asia-Pacific
- Middle East and Africa
- GCC
- South Africa
- Rest of Middle East and Africa
- South America
- Brazil
- Argentina
- Rest of South America
- North America
Detailed Research Methodology and Data Validation
Primary Research
Mordor analysts interviewed allergists, hospital pharmacy buyers, and leading academic researchers across North America, Europe, and Asia-Pacific. Discussions clarified real-world regimen persistence, average selling prices for SLIT tablets, and the timing of payer coverage expansions, allowing us to refine desk estimates and stress-test underlying assumptions.
Desk Research
We gathered baseline volumes, pricing guardrails, and therapy adoption ratios from reputable public sources such as the World Allergy Organization, OECD health accounts, U.S. FDA approval databases, Eurostat trade codes, and peer-reviewed journals on immunotherapy outcomes. Company 10-Ks, selected investor decks, and national prescription audits enriched the volume-price matrix. Supplementary insight came from D&B Hoovers financial snapshots and Dow Jones Factiva news archives. This list is illustrative; many additional sources informed our fact base.
Market-Sizing & Forecasting
A top-down patient prevalence-to-treated-cohort build was first run for each country, which we then cross-checked with sampled supplier revenue roll-ups and pharmacy channel checks (our one bottom-up loop) to reconcile gaps. Key market fingerprints, SLIT tablet penetration, average three-year persistence rates, EPIT clinical-trial progression, allergen standard cost indices, and region-specific reimbursement milestones drive our model. Forecasts deploy multivariate regression blended with scenario analysis to reflect policy shifts and pipeline read-outs, while any blind spots in bottom-up inputs are bridged with conservative uptake factors vetted during interviews.
Data Validation & Update Cycle
Outputs pass variance screens against historical treatment-to-prevalence ratios and independent price trackers, followed by senior analyst review. We refresh every twelve months and issue mid-cycle revisions if major regulatory or safety events occur; a final sense-check is performed just before publication.
Why Mordor's Allergy Immunotherapy Baseline Commands Reliability
Published figures often diverge because firms choose distinct product scopes, prevalence bases, and refresh cadences. Our disciplined alignment of scope with actual prescription immunotherapy courses, plus annual model rewinds, narrows that spread for users.
Key gap drivers include wider inclusion of biologic anti-IgE drugs by some publishers, differing assumptions on SLIT tablet uptake velocity, currency conversion cut-offs, and less frequent data refreshes compared with the yearly cycle that Mordor maintains.
Benchmark comparison
| Market Size | Anonymized source | Primary gap driver |
|---|---|---|
| USD 2.50 B | Mordor Intelligence | - |
| USD 2.10 B | Global Consultancy A | excludes EPIT pipeline; relies on 2023 price deck |
| USD 1.84 B | Industry Association B | uses Europe-only ASP and projects globally |
| USD 2.74 B | Regional Consultancy C | folds anti-IgE biologics into core total |
The comparison shows that, by anchoring values to treated-patient counts and verified prices while separating adjacent drug classes, Mordor delivers a balanced, transparent baseline that decision-makers can trace and replicate with confidence.


Key Questions Answered in the Report
What is the projected value of the Allergy Immunotherapy market in 2031?
It is forecast to reach USD 3.72 billion on the back of a 6.85% CAGR.
Which therapy type is growing fastest within Allergy Immunotherapy?
Sublingual Immunotherapy is expected to expand at 15.25% CAGR between 2026 and 2031.
Why is Asia-Pacific considered the most promising region?
Rising disposable incomes, climbing allergy prevalence, and recent tablet approvals in Japan and China support a 15.21% CAGR.
How are e-commerce channels influencing product distribution?
Mail-order and telemedicine platforms enable home dosing and are projected to grow at 17.7% CAGR, eroding pharmacy share.
What safety concern limits rapid uptake of SCIT?
The risk of systemic anaphylaxis necessitates clinic observation, increasing cost and limiting patient convenience.
Page last updated on:


