
Fly Ash (Cenospheres) Microspheres Market Size and Share
Market Overview
| Study Period | 2020 - 2031 |
|---|---|
| Forecast Data Period | 2026 - 2031 |
| Historical Data Period | 2020 - 2024 |
| Growth Rate | 7.04 % |
| Fastest Growing Market | Asia Pacific |
| Largest Market | North America |
| Market Concentration | High |
Major Players *Disclaimer: Major Players sorted in no particular order Image © Mordor Intelligence. Reuse requires attribution under CC BY 4.0. | |
Fly Ash (Cenospheres) Microspheres Market Analysis by Mordor Intelligence
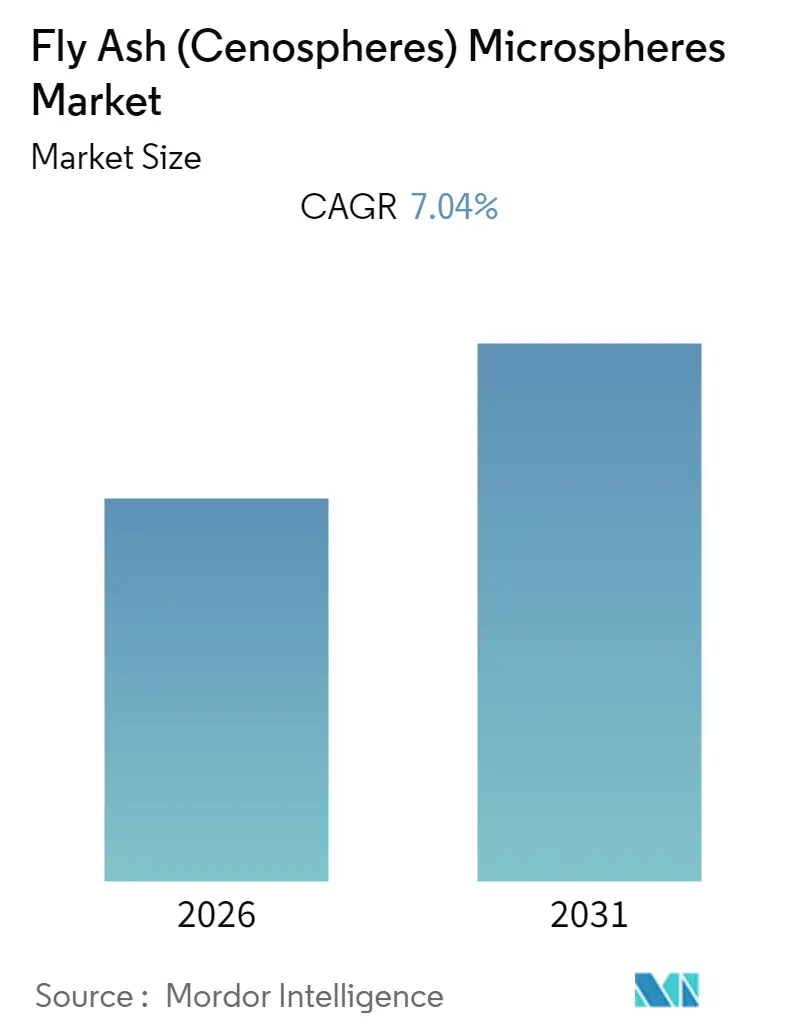
The Fly Ash (Cenospheres) Microspheres Market size is expected to register a CAGR of greater than 7.04% during the forecast period.
- Fly Ash (Cenospheres) Microspheres is extensively consumed in the construction business. The main benefits of cenospheres are reduction of weight, reduction of viscosity, increased lubricity, and increased refractoriness.
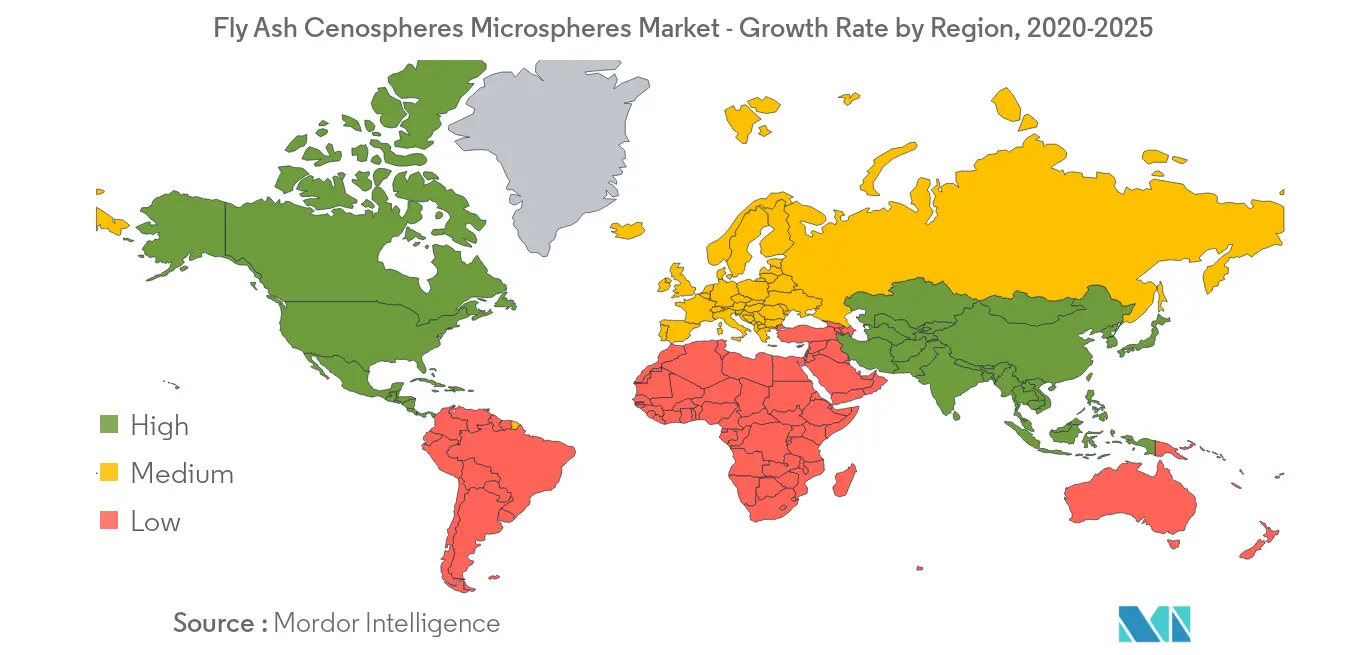
- North America is expected to be the largest market due to the large-scale consumption of the fly ash cenospheres microspheres in the region.
Note: Market size and forecast figures in this report are generated using Mordor Intelligence’s proprietary estimation framework, updated with the latest available data and insights as of 2026.
Global Fly Ash (Cenospheres) Microspheres Market Trends and Insights
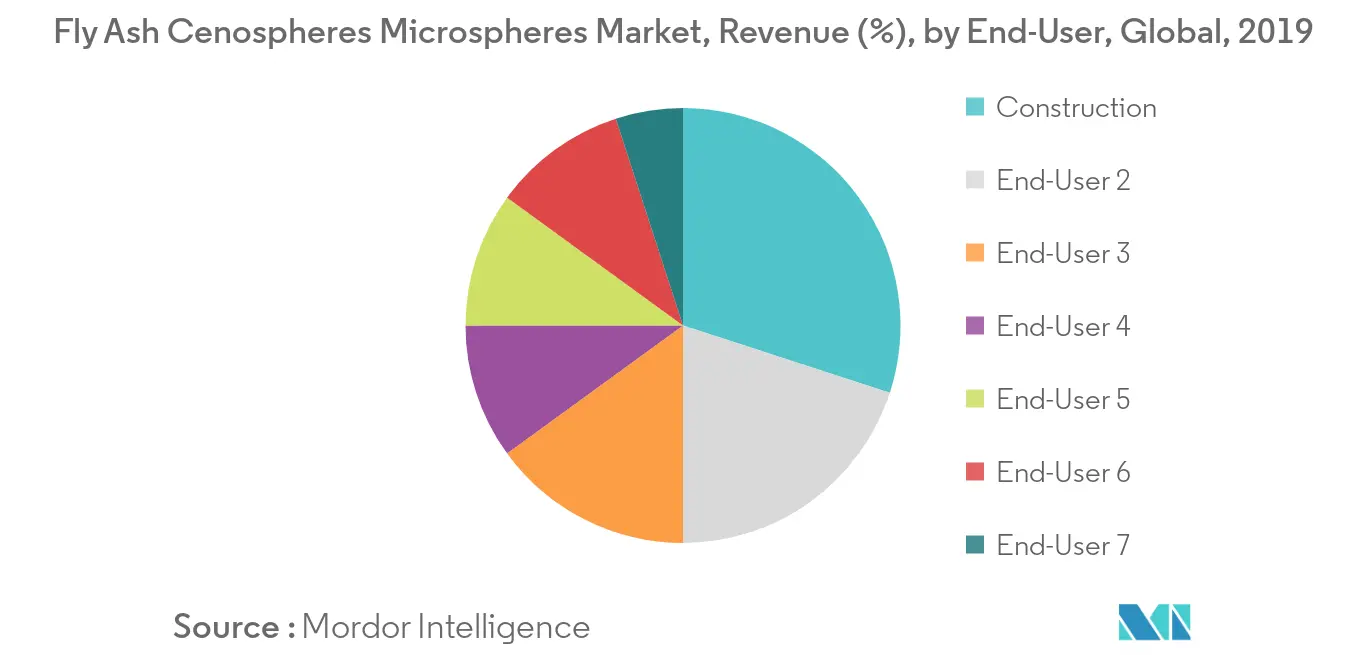
Construction Segment to Boost Fly Ash (Cenospheres) Microspheres Market
- Cenospheres are generally utilized in the construction business. From roofing materials to plasters and grouts, new applications and items keep on being created. The amount of cenospheres utilized inside the construction industry keeps on developing.
- The primary advantages of cenospheres are reduced weight, expanded filler stacking, reduced shrinkage, reduction of viscosity, increased fire insulation, expanded lubricity, and expanded refractoriness.
- In 2019, the worldwide spending of the construction industry added USD 11 trillion and it is anticipated to reach around USD 14 trillion by 2025, thus benefitting the market studied.
- The Indian government has made a recent announcement of its plan which includes the construction of 100 smart cities across the nation and expanding its infrastructure by infusing USD 28.18 billion for the upcoming project.
- A plan of investing over USD 450 billion in infrastructure has been introduced by the Saudi Arabian government under its Saudi Arabia Vision Plan 2030. The idea is to diversify the economy by reducing the dependency on its oil & gas sector, thereby enhancing the government's efficiency and society's stability.
- All the aforementioned factors are expected to drive the fly ash (cenospheres) microspheres market during the forecast period.


North America Region to Dominate Fly Ash (Cenospheres) Microspheres Market
- North America region holds a prominent share in the fly ash (cenospheres) microspheres market globally and is expected to dominate the market during the forecast timeline.
- According to statistics, the United States invested roughly USD 91.5 billion for new non-residential commercial construction in 2019. This spending is predicted to remain constant by 2023.
- The total number of vehicles manufactured in Canada was 1.916 million units in 2019.
- In 2019, PADD 3 (Gulf Coast), which includes the oil production in Alabama, Arkansas, New Mexico, Mississippi, Louisiana, and Texas, was the biggest oil-producing PADD, having delivered some 8.08 million barrels of crude oil every day.
- Thus, rising demand from various industries is expected to drive the market studied in the region during the forecast timeframe.

Value Chain Analysis
Fly ash cenospheres are recovered from coal-fired power plants as part of the fly ash stream, either from fly ash ponds or from particulate-capture systems. Upstream processing includes drying, carbon and impurity removal, sizing, classification, and density grading to produce solid and hollow cenosphere fractions aligned to end-use requirements. Durgesh Merchandise Pvt. Ltd. operates a fully automated processing facility on a 5-acre site in Giridih, Jharkhand, India, with capacity exceeding 3,000 MT per year.
Midstream participants certify and package material for industrial customers, where grading and QA/QC capability differentiates suppliers. Downstream channels supply construction materials producers (mortars, plasters, roofing), oil and gas service supply chains (lightweight cementing additives with defined density and crush-strength windows), and compounders or formulators in paints, coatings, and plastics. Distributors and integrated suppliers such as SphereFill (UAB SUEK Baltic) support cross-border logistics and customer qualification.
Competitive Landscape
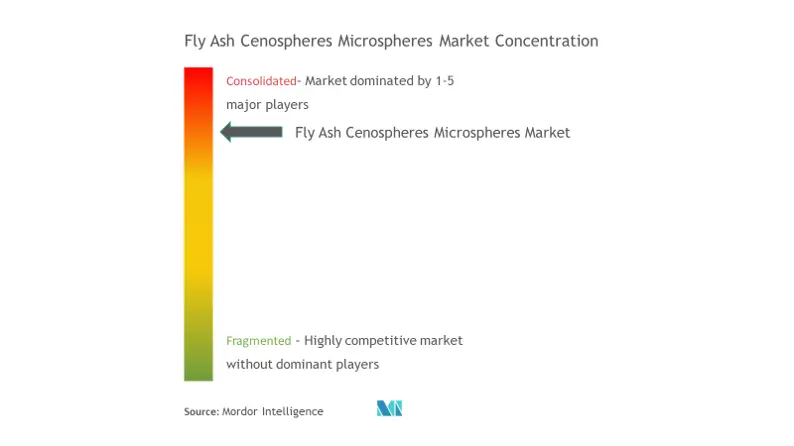
The market for fly ash (cenospheres) microspheres is consolidated. Some of the players in the market include UAB SUEK Baltic, Omya, Durgesh Merchandise Pvt. Ltd, Cenosphere India Pvt. Ltd, and Reslab Microfiller.
Fly Ash (Cenospheres) Microspheres Industry Leaders
UAB SUEK Baltic
Omya
Durgesh Merchandise Pvt. Ltd
Cenosphere India Pvt. Ltd
Reslab Microfiller
- *Disclaimer: Major Players sorted in no particular order

Market Opportunities and Future Outlook
Construction demand for lightweighting solutions supports the use of microspheres across building materials, including mortars and composites. For oil well cementing, precise density and crush strength requirements guide the development of targeted cenospheres grades. Omya updated its Omyasphere portfolio documentation in July 2025, indicating continued focus on product positioning for microspheres in construction-related material science applications.
As suppliers expand graded microsphere offerings, end users can adjust trade-offs between weight reduction, processing behavior, and fire and thermal performance across construction products, coatings, and polymer compounds. Durgesh Merchandise Pvt. Ltd. continues to operate in cenospheres production and export, supporting ongoing alignment between material science capability and application needs.
Recent Industry Developments
- July 2026: Yee Hop Holdings - Entered into a joint venture to produce eco-friendly building materials using fly ash and industrial waste, involving an RMB 71.7 million equipment procurement agreement. The joint venture will repurpose fly ash into eco-friendly building materials, leveraging the procurement to enable scalable production. This broadens Yee Hop Holdings' materials footprint and aligns with demand for waste-to-value solutions in construction markets.
- July 2026: Eco Material Technologies - Expanded its Material Testing and Research Facility in Taylorsville, Georgia, to enhance pilot production and research of harvested fly ash and supplementary cementitious materials. The expansion strengthens its capabilities for pilot-scale production and research in fly ash based materials. The increased capacity supports faster development cycles and expands Eco Material Technologies' role in eco-friendly construction additives.
- July 2026: Omya - Omya Performance Polymer Distribution expanded its collaboration with EMS-GRIVORY into the UK and Ireland to deliver high-performance polyamide solutions for automotive and industrial lightweighting applications. The geographic expansion broadens access to advanced polyamide solutions for lightweighting needs. The collaboration deepens Omya’s market reach and supports growth in high performance materials for mobility and industrial sectors.


Research Methodology Framework and Report Scope
Market Definition and Coverage
For this methodology, the market covers fly-ash derived cenospheres and related microspheres that are processed and sold as lightweight filler materials for industrial end uses across major consuming regions.
Scope exclusions: We exclude on-site ash handling, non-microsphere fly ash products, and downstream finished goods where cenospheres are only a minor ingredient.
Segmentation Overview
- Type
- Solid
- Hollow
- Raw Material
- Fly Ash
- Glass
- Ceramic
- Metallic
- Polymer
- End-User
- Aerospace
- Construction
- Oil & Gas
- Medical
- Automotive
- Paints & Coatings
- Others
- Geography
- Asia-Pacific
- China
- India
- Japan
- South Korea
- Rest of Asia-Pacific
- North America
- United States
- Canada
- Mexico
- Europe
- Germany
- United Kingdom
- France
- Italy
- Rest of Europe
- South America
- Brazil
- Argentina
- Rest of South America
- Middle-East and Africa
- Saudi Arabia
- South Africa
- Rest of Middle-East and Africa
- Asia-Pacific
Data Sources, Market Sizing, and Validation
Desk Research
Desk work starts by mapping supply reality to a measurable market, since cenospheres are produced from coal combustion residues and then move through beneficiation and distribution. We reviewed public and official source types such as US EPA coal combustion residuals resources, USGS minerals and materials publications, Eurostat and UN Comtrade trade series for relevant mineral and filler categories, and energy statistics from IEA for coal power generation trends. We also checked standards and technical context using sources such as ASTM documents and peer reviewed journals on lightweight fillers and composite formulation.
We then cross checked these signals with company annual reports, investor presentations, sustainability updates, and credible industry press to understand capacity additions, plant utilization direction, and typical product positioning by grade. Where needed, we used paid subscriptions that aggregate company financials and track shipment and tender activity to spot missing producers and to validate pricing bands seen in interviews. This list is illustrative, and many other sources were used to collect data, confirm assumptions, and clarify open points.
Primary Interviews and Surveys
Primary work focused on validating real selling prices, grade splits between solid and hollow material, and how frequently supply tightness shows up due to feedstock availability and processing constraints. We spoke with stakeholders across producers, processors, distributors, and procurement teams serving end users such as construction materials, oil and gas services, coatings, and automotive composites. Coverage was balanced across APAC, EMEA, and the Americas so regional price and quality differences were not averaged out too early.
Distribution of primary research fieldwork respondents
| Company type | Respondent position | Region |
|---|---|---|
| Top tier: 31% | CXOs: 17% | APAC: 46% |
| Mid tier: 51% | Functional/Unit leaders: 40% | EMEA: 34% |
| Smaller Players: 18% | Managers: 43% | Americas: 20% |
Market-Sizing & Forecasting
Sizing is built using a top down structure where coal power generation and fly ash availability are converted into an addressable recovery pool, which is then adjusted for beneficiation yield and the share directed into cenosphere grade output. Once the supply side ceiling is clear, demand is reconstructed by end use pull, using consumption indicators such as construction activity, drilling and completion intensity in oil and gas, coatings production trends, and lightweighting adoption in polymer composites. Pricing is handled through grade specific average selling prices that are refreshed from interviews, since hollow and solid material can move differently when quality specifications tighten.
To keep totals realistic, we corroborate results with selective bottom up checks such as producer capacity roll ups, sampled shipment volumes from channel discussions, and ASP times volume sanity checks at the application level. When smaller producers are not visible in public data, gaps are handled through region level production shares and distributor channel splits that were validated in calls, and then checked for reasonableness against trade flow direction and power plant retirement trends. Forecasting is primarily done using scenario analysis, where coal fleet outlook, fly ash recovery rates, end user activity cycles, and price normalization paths are varied, then narrowed based on expert consensus from primary interviews.
Data Validation & Update Cycle
Outputs are checked through several steps, starting with unit consistency tests, price to volume coherence checks, and region share comparisons against independent demand signals. If a data point creates an unusual jump, the inputs are revisited, and follow up calls are triggered to confirm whether the shift is structural, temporary, or a reporting artifact. Before sign off, another analyst reviews model logic and assumptions so calculation errors and double counting risks are reduced.
Reports are refreshed annually, and interim updates are made when material events occur, such as large capacity changes, policy shifts affecting coal ash management, or a sudden move in end market activity. Right before delivery, a final pass is completed to ensure the latest public releases and interview learnings are reflected in the numbers.
Mordor Intelligence's Fly Ash Cenospheres Microspheres Market Estimate Compared With Other Published Estimates
Published market sizes for fly ash cenospheres microspheres can appear far apart, even when the material is broadly similar, because boundaries and counting rules are not always the same. Differences usually come from what is included as a microsphere, which end uses are counted, and whether the sizing relies more on supply limits or on aspirational demand.
By tracking grade level pricing and yield assumptions and refreshing them through validation calls, Mordor Intelligence keeps the total tied to recoverable cenosphere output from fly ash streams and then reconciles it with end use consumption signals. In contrast, some estimates appear to widen scope to broader microsphere families, apply a single blended ASP across grades, or use longer refresh cycles that miss recent shifts in coal generation and ash recovery behavior.
Benchmark comparison
| Source | Market Size | Gaps in Research Methodology |
|---|---|---|
| Mordor Intelligence | USD 0.45 B (2025) | |
| Trade Journal A | USD 0.38 B (2025) | Uses a narrower supply view that can undercount higher grade hollow material, and it appears to apply conservative recovery and processing yield assumptions without region checks. |
| Industry Publisher B | USD 0.45 B (2025) | Matches the year but typically reports a rounded value with limited visibility into how grade mix and regional ASP differences were handled, which can hide variance within the total. |
The table shows that the spread is mostly explained by how recoverable supply, grade mix, and pricing are treated, rather than by a single demand story. When the boundary is kept close to fly ash derived cenospheres and the inputs are tied back to measurable recovery and end use activity, the resulting market size stays easier to audit and repeat year to year.


Key Questions Answered in the Report
What is the current Fly Ash (Cenospheres) Microspheres Market size?
The Fly Ash (Cenospheres) Microspheres Market is projected to register a CAGR of 7.04% during the forecast period (2026-2031)
Who are the key players in Fly Ash (Cenospheres) Microspheres Market?
UAB SUEK Baltic, Omya, Durgesh Merchandise Pvt. Ltd, Cenosphere India Pvt. Ltd and Reslab Microfiller are the major companies operating in the Fly Ash (Cenospheres) Microspheres Market.
Which is the fastest growing region in Fly Ash (Cenospheres) Microspheres Market?
Asia Pacific is estimated to grow at the highest CAGR over the forecast period (2026-2031).
Which region has the biggest share in Fly Ash (Cenospheres) Microspheres Market?
In 2025, the North America accounts for the largest market share in Fly Ash (Cenospheres) Microspheres Market.
What years does this Fly Ash (Cenospheres) Microspheres Market cover?
The report covers the Fly Ash (Cenospheres) Microspheres Market historical market size for years: 2019, 2020, 2021, 2022, 2023, 2024 and 2025. The report also forecasts the Fly Ash (Cenospheres) Microspheres Market size for years: 2026, 2027, 2028, 2029, 2030 and 2031.
Page last updated on:


 Your data is secure and never sold or shared.


