Fluorescein Angiography Market Size and Share
Market Overview
| Study Period | 2019 - 2030 |
|---|---|
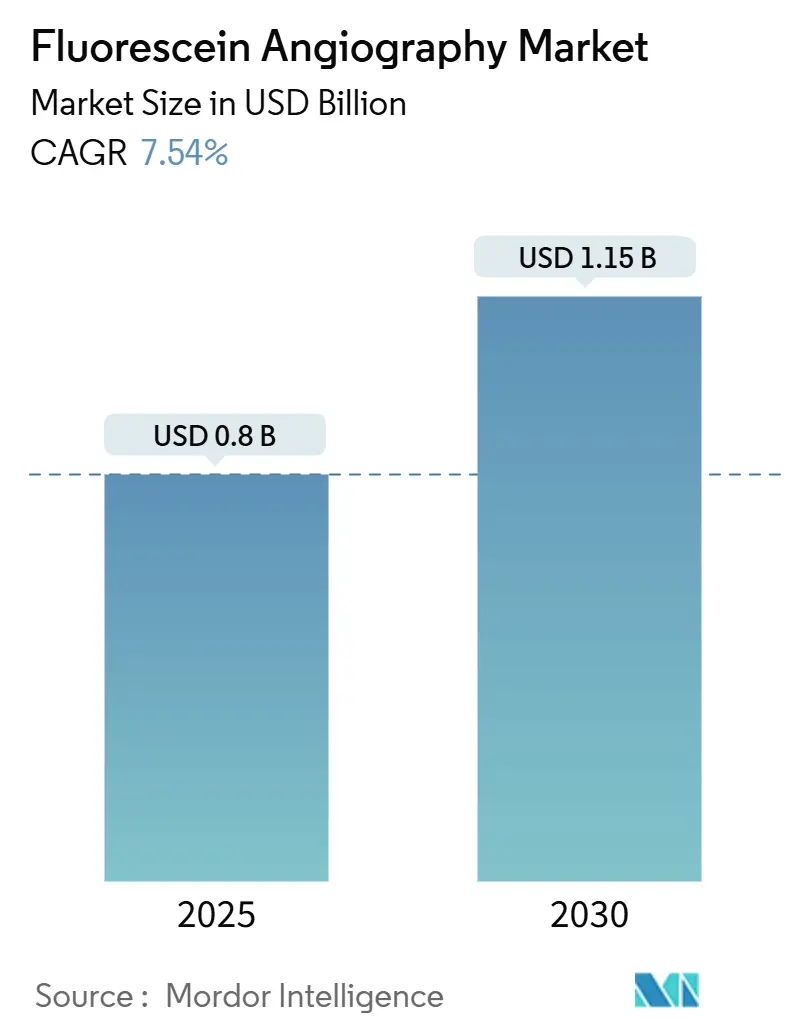
| Market Size (2025) | USD 0.8 Billion |
| Market Size (2030) | USD 1.15 Billion |
| Growth Rate (2025 - 2030) | 7.54% CAGR |
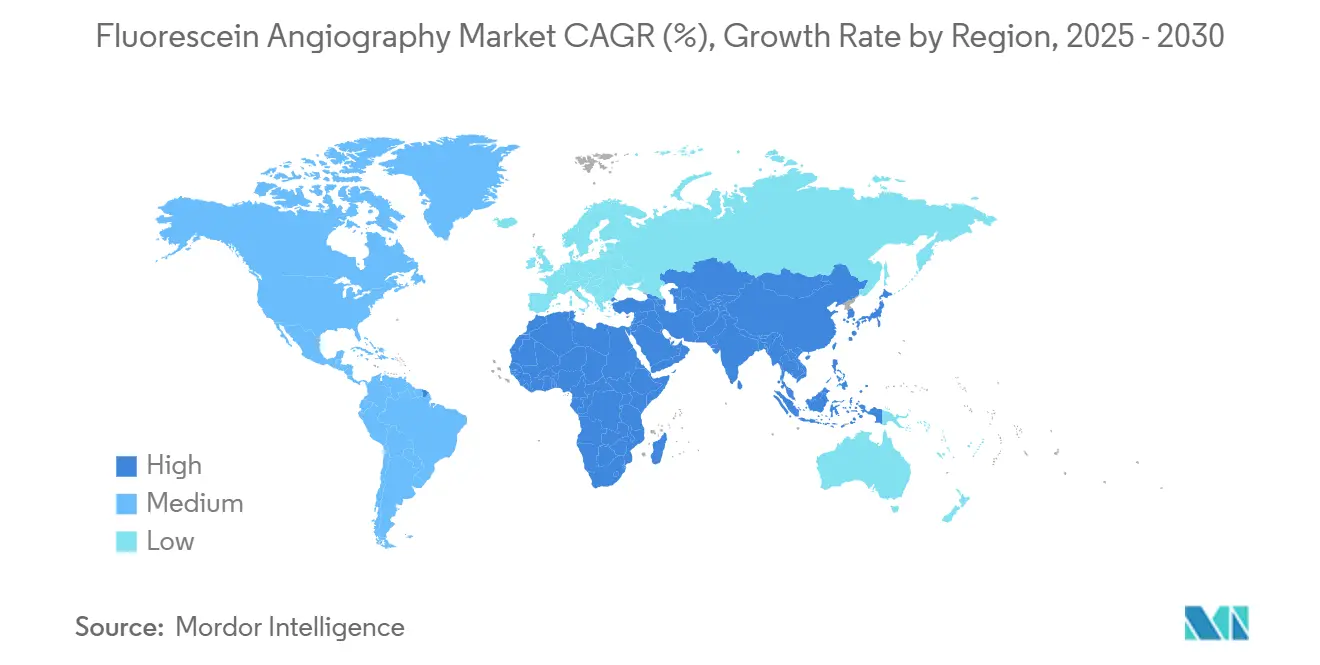
| Fastest Growing Market | Asia Pacific |
| Largest Market | North America |
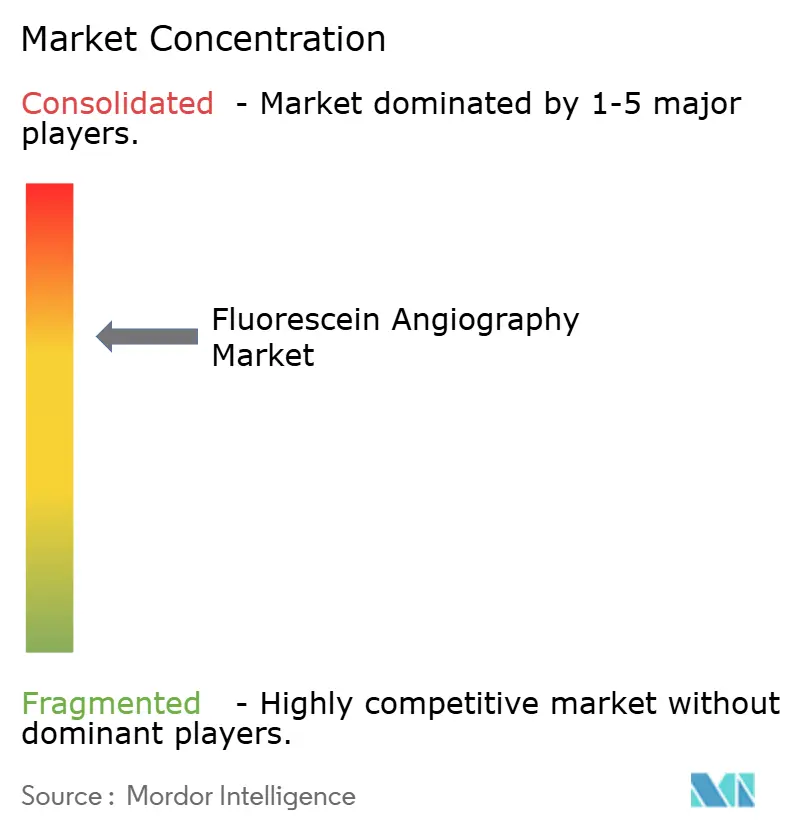
| Market Concentration | Medium |
Major Players *Disclaimer: Major Players sorted in no particular order Image © Mordor Intelligence. Reuse requires attribution under CC BY 4.0. | |
Fluorescein Angiography Market Analysis by Mordor Intelligence
The fluorescein angiography market size stands at USD 804 million in 2025 and is forecast to reach USD 1.15 billion in 2030, reflecting a 7.54% CAGR. This sustained expansion confirms the critical role of fluorescein angiography in retinal diagnostics despite faster adoption of non-invasive alternatives. Growing diabetic retinopathy prevalence, the surge in ultra-widefield imaging installations, and broader tele-ophthalmology coverage together reinforce procedure volumes. Rapid hardware miniaturization is lowering entry barriers for primary-care settings, while artificial-intelligence-enabled image analysis shortens interpretation time. Intensifying supply-chain risks for fluorescein dye and stiff competition from optical coherence tomography angiography remain the leading headwinds.
Key Report Takeaways
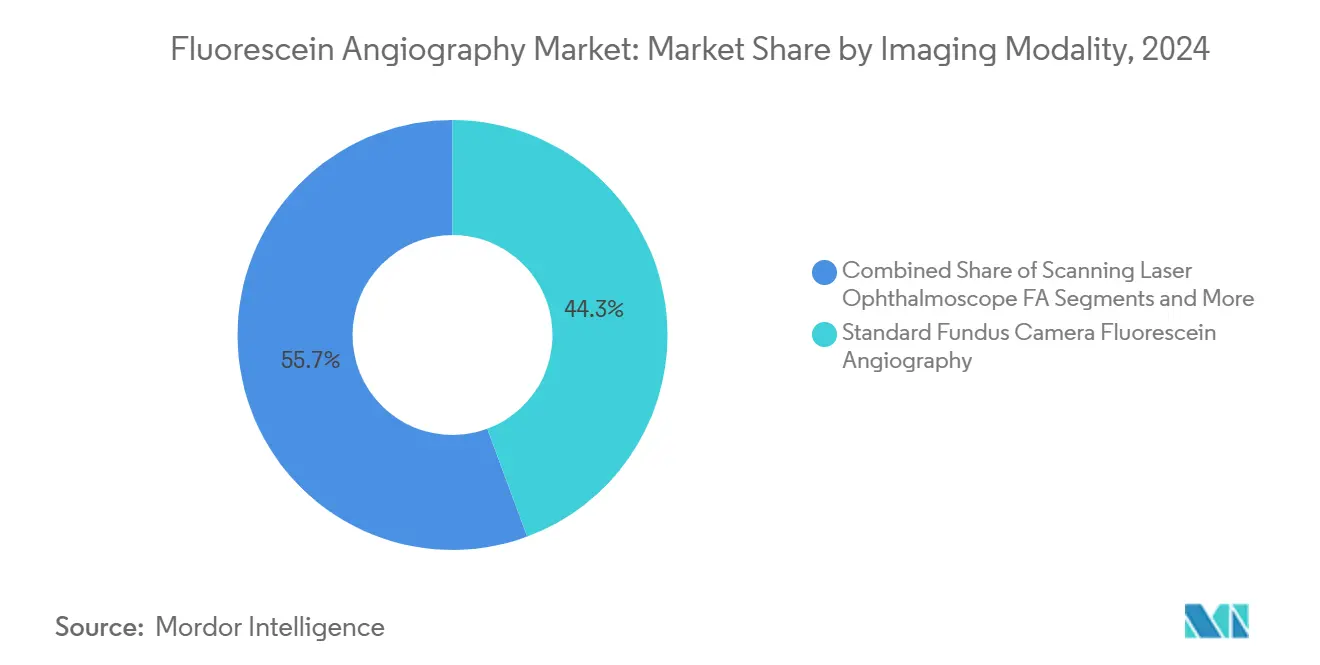
- By imaging modality, standard fundus camera systems led with 44.34% revenue share in 2024; handheld / smartphone systems are projected to expand at a 12.01% CAGR through 2030.
- By indication, diabetic retinopathy accounted for 47.52% of the fluorescein angiography market share in 2024 and is advancing at a 10.38% CAGR to 2030.
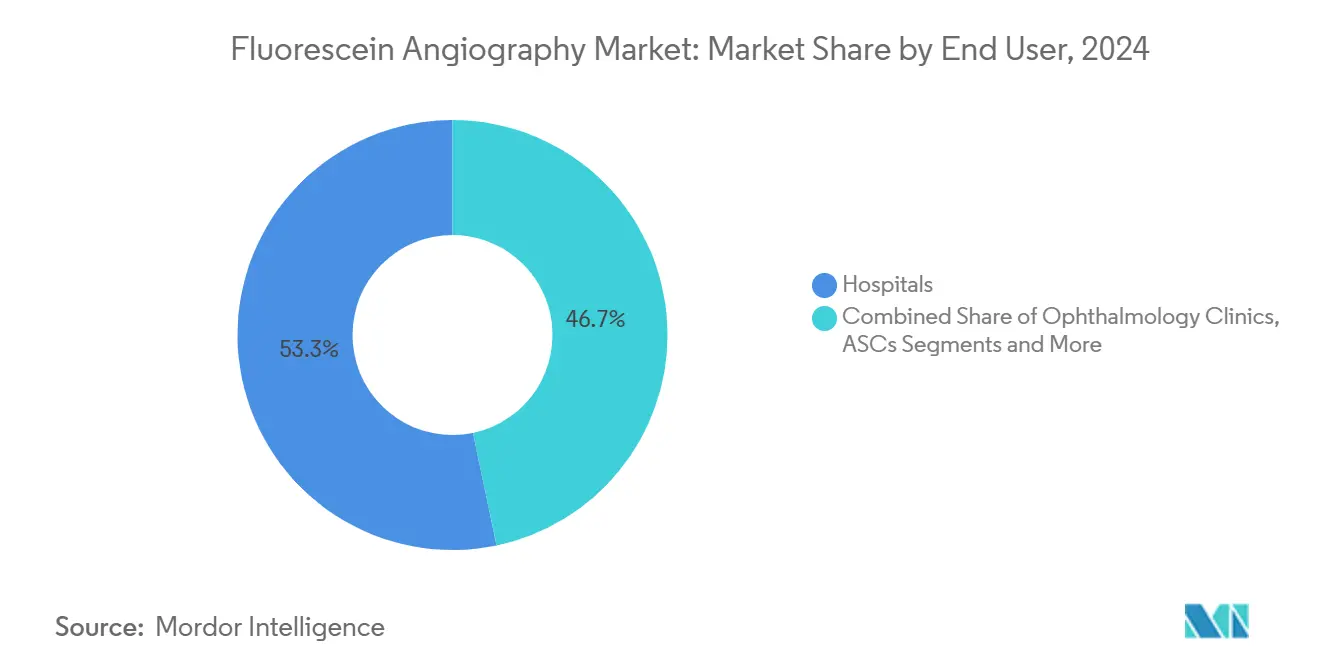
- By end user, hospitals held 53.28% share of the fluorescein angiography market size in 2024, while tele-ophthalmology providers are forecast to grow at 11.56% CAGR through 2030.
- By dye-delivery method, intravenous sodium fluorescein commanded 88.76% revenue share in 2024; oral fluorescein is on track for a 9.37% CAGR between 2025-2030.
- By geography, North America led with 37.27% share in 2024, whereas Asia-Pacific is set for a 9.89% CAGR through 2030.
Global Fluorescein Angiography Market Trends and Insights
Drivers Impact Analysis*
| Driver | (~) % Impact on CAGR Forecast | Geographic Relevance | Impact Timeline |
|---|---|---|---|
| Escalating Global Prevalence Of Diabetic Retinopathy & AMD | +2.1% | Global, with highest impact in Asia-Pacific and Latin America | Long term (≥ 4 years) |
| Rapid Adoption Of Ultra-Widefield And High-Resolution FA Systems | +1.8% | North America & EU, expanding to APAC | Medium term (2-4 years) |
| Expansion Of Tele-Ophthalmology Screening Programs | +1.5% | Global, with accelerated adoption in rural and underserved regions | Short term (≤ 2 years) |
| AI-Driven Quantitative Leakage Analytics Integration | +1.2% | North America & EU core, spill-over to APAC | Medium term (2-4 years) |
| Commercialization Of Low-Toxicity Plant-Based Fluorescein Dyes | +0.7% | Global, with regulatory advantages in EU | Long term (≥ 4 years) |
| Demand For Low-Cost Handheld / Smartphone-Based FA Devices In EMs | +1.1% | Asia-Pacific, Latin America, and MEA | Short term (≤ 2 years) |
| Source: Mordor Intelligence | |||
Escalating Global Prevalence of Diabetic Retinopathy & AMD
More than 14.7 million U.S. residents are projected to live with diabetic retinopathy by 2050, ensuring a steady procedure pipeline.[1]Centers for Disease Control and Prevention, “Diabetic Retinopathy by 2050,” cdc.gov Parallel rises in age-related macular degeneration, forecast to affect 288 million people worldwide by 2040, add to case volumes. The correlation between retinopathy severity and diabetic nephropathy motivates joint screening programs that keep fluorescein testing integral to chronic care pathways.[2]Shanshan Tang, “Parallelism and Non-Parallelism in Diabetic Nephropathy and Diabetic Retinopathy,” Frontiers in Endocrinology, frontiersin.orgLatin America currently shows the world’s highest vision-threatening retinopathy prevalence, reinforcing global growth. Retinal specialists continue to rely on dye-based angiography for leakage quantification during treatment planning.
Rapid Adoption of Ultra-Widefield and High-Resolution Systems
Ultra-widefield platforms now capture up to 200-degree views, revealing peripheral ischemia invisible to conventional fundus cameras. Color-true RGB laser capture shortens examination time without harming throughput. Integration of AI modules such as CIRRUS PathFinder speeds image review and report creation. These capabilities improve clinical decision-making for proliferative diabetic retinopathy and diabetic macular edema. Premium pricing is justified by improved diagnostic yield, particularly in advanced referral centers across North America and Europe.
Expansion of Tele-Ophthalmology Screening Programs
CMS reimbursement expansion following COVID-19 reduced economic barriers for tele-ophthalmology, triggering widespread program rollouts. Hybrid models that pair technician-acquired imaging with virtual consultations have proven cost-effective for federally qualified health centers. Smartphone-based widefield imaging delivers 92.7% sensitivity and 96.6% specificity in detecting sight-threatening diabetic retinopathy.[3]Ashley Welch, “Diabetic Retinopathy: Screening, Treatment, and Trends,” aao.org These metrics satisfy payer requirements, supporting scale-up in underserved regions. The approach also addresses shortages of ophthalmologists in rural Asia-Pacific, where ratios range from 114 per million in Japan to nil in some settings.
AI-Driven Quantitative Leakage Analytics Integration
Convolutional-neural-network models such as VGG16 and ResNet50 outperform manual grading for nonperfusion detection. FDA-cleared algorithms like iPredict AMD show high accuracy in flagging referrable disease. AI tools reduce interobserver variability and assist in earlier disease interception. Personalized treatment planning fosters greater patient adherence owing to clear visualizations of progression risk. Vendors now bundle analytics subscriptions with hardware placements, establishing recurring revenue streams.
Restraints Impact Analysis*
| Restraint | (~) % Impact on CAGR Forecast | Geographic Relevance | Impact Timeline |
|---|---|---|---|
| Procedure Invasiveness & Dye-Related Adverse Reactions | -1.3% | Global, with higher impact in regions with strict safety protocols | Medium term (2-4 years) |
| Migration To Non-Invasive OCT-Angiography Alternatives | -1.8% | North America & EU, expanding globally | Short term (≤ 2 years) |
| Environmental Regulations Disrupting Fluorescein Dye Supply Chain | -0.9% | EU and North America, with spillover to APAC | Long term (≥ 4 years) |
| Reimbursement Uncertainty For Outpatient FA In EU & US | -1.1% | North America & EU | Medium term (2-4 years) |
| Source: Mordor Intelligence | |||
Procedure Invasiveness and Dye-Related Adverse Reactions
Intravenous dye use produces mild reactions in 1.4% of procedures but still deters risk-averse patients. Clinicians must manage informed-consent overhead, extending appointment length. Regulatory bodies consider updating practice guidelines, potentially mandating emergency equipment during injections. Such measures add cost and workflow complexity. The appeal of alternative modalities grows as providers seek shorter, less invasive encounters.
Migration to Non-Invasive OCT-Angiography Alternatives
OCT-angiography matches 94.9% of treatment-decision correspondence with dye-based imaging in exudative AMD. Layer-by-layer segmentation delivers richer anatomical context within one scan, improving clinic productivity. Lack of dye eliminates allergic risk and simplifies scheduling logistics. Reimbursement parity, however, has not yet arrived in several jurisdictions, tempering near-term substitution rates. Standardized nomenclature released in 2025 aims to enhance cross-study comparability and accelerate payer acceptance.
*Our forecasts treat driver/restraint impacts as directional, not additive. The impact forecasts reflect baseline growth, mix effects, and variable interactions.
Segment Analysis
By Imaging Modality: Standard Systems Hold Lead, Smartphone Units Accelerate
Standard fundus‐camera systems contributed USD 357 million to the fluorescein angiography market size in 2024, equal to 44.34% share, and continue to benefit from entrenched installed bases. The segment retains procedural dominance in tertiary centers that require rapid integration with existing image-management software. Handheld / smartphone devices, though smaller in absolute value, post a 12.01% CAGR by leveraging portability and AI-augmented capture that clinicians can deploy in primary-care settings. Their emergence redistributes incremental unit growth, especially across Asia-Pacific and Latin America where hospital access remains limited. Ultra-widefield platforms gain traction among retinal specialists seeking peripheral visualization, while scanning-laser ophthalmoscopes sustain niche adoption for high-resolution research protocols.
Forward deployment of smartphone units in national screening campaigns reduces bottlenecks in referral pathways. Governments in India have incorporated mobile systems in diabetic retinopathy programs, citing 92.7% sensitivity for sight-threatening disease. Manufacturers further differentiate with cloud-connected analytics that drive asynchronous consults. Although average selling prices remain one-third of full-format cameras, volume elasticity supports revenue ascent. The combined imaging-modality spectrum underscores how diversified hardware ecosystems help providers align capital budgets with care-delivery settings, protecting growth momentum for the fluorescein angiography market.


By Indication: Diabetic Retinopathy Dominates, AMD Sustains Demand
Diabetic retinopathy generated 47.52% revenue in 2024, representing the largest contribution to the fluorescein angiography market share. The segment demonstrates a 10.38% CAGR through 2030 on the back of global diabetes escalation, compelling payers to reimburse annual screenings. Age-related macular degeneration follows as the second-largest indication owing to population aging and better survival rates. Clinicians favor ultra-widefield imaging for AMD to detect peripheral neovascularization that standard cameras may overlook. Retinal vein occlusion, macular edema variants, and central serous chorioretinopathy occupy smaller shares yet sustain steady volumes because leakage visualization remains critical for therapeutic monitoring.
Emergent gene therapies for inherited retinal disorders elevate diagnostic precision requirements to track microvascular changes. AI-enhanced leakage maps facilitate earlier intervention, minimizing irreversible photoreceptor damage. Simultaneous capture of multiple modalities in combined OCT / FA systems lowers per-patient imaging time, adding operational appeal. Overall, indication diversification shields the fluorescein angiography market from singular disease-specific demand swings and supports a resilient revenue trajectory.
By End User: Hospital Leadership Faces Tele-Provider Momentum
Hospitals accounted for USD 428 million in 2024, translating into 53.28% of the fluorescein angiography market size. Institutional workflow integration, specialist availability, and co-located surgical suites underpin this dominance. Ophthalmology clinics maintain the next-largest contribution by offering quicker appointments and specialized staff. Tele-ophthalmology providers, however, post an 11.56% CAGR by capitalizing on reimbursement parity and patient preference for remote care. Ambulatory surgical centers and academic institutes round out the landscape, anchoring research and procedure innovation.
Federally qualified health centers participating in the MI-SIGHT program report that technicians spend 21.4% of their time on eye-disease screening, demonstrating operational feasibility. Primary-care integration allows earlier detection and timely referrals, relieving tertiary-care backlogs. Cloud-based image transfer coupled with AI triage workflows ensures efficient specialist review. These dynamics reshape patient-flow patterns and cement tele-providers as an influential growth catalyst for the fluorescein angiography industry.
By Dye Delivery Method: Intravenous Remains Standard, Oral Gains Traction
Intravenous sodium fluorescein produced 88.76% of 2024 revenue, a testament to its image-quality superiority and clinician familiarity. Imaging protocols built around intravenous injection maximize contrast, particularly in choroidal assessments. Oral fluorescein, though accounting for a modest share, records a 9.37% CAGR through 2030 as patients favor needle-free experiences. Topical applications stay confined to emergency or off-label research contexts owing to limited penetration depth.
The 2024 fluorescein strip shortage exposed the vulnerability of single-source supply chains. Rationing measures intensified interest in plant-based dyes that promise more sustainable production. Early clinical trials disclose equivalent fluorescence intensity, and regulatory pathways are being streamlined. Successful commercialization would diversify supply while addressing environmental objections, ultimately reinforcing long-term stability for the fluorescein angiography market.
Geography Analysis
North America contributed 37.27% of 2024 revenue thanks to entrenched reimbursement mechanisms and high specialist density. Continued investment in ultra-widefield systems and AI software upgrades keep replacement demand stable. However, market maturity limits unit growth, pushing vendors toward value-added service models. Recent supply-chain fragility in fluorescein dye heightened calls for domestic manufacturing to safeguard procedural continuity.
Europe represents the second-largest regional contributor, buoyed by standardized care pathways and early adoption of non-invasive technologies. Governments promote multimodal imaging integration within national screening programs, driving replacement of legacy fundus cameras with combined OCT / FA workstations. Ongoing reimbursement debates surrounding outpatient FA procedures create near-term volume uncertainty, yet equipment installations persist due to bundled purchasing frameworks in hospital networks.
Asia-Pacific records the fastest 9.89% CAGR and underpins incremental volume growth for the fluorescein angiography market. Diabetes prevalence, uneven ophthalmologist distribution, and rapid healthcare-infrastructure expansion create structural demand for cost-effective imaging. Smartphone-based units combined with cloud analytics bridge urban–rural service gaps. Latin America and MEA remain smaller in value yet exhibit rising adoption as public-health agencies roll out tele-screening campaigns and subsidize hardware for community clinics.

Competitive Landscape
The fluorescein angiography market shows moderate concentration.. Zeiss enhanced its retinal-surgery platform through the 2024 acquisition of DORC, integrating the EVA NEXUS vitrectomy system to reinforce cross-selling potential. Topcon scales device-as-a-service contracts that bundle hardware, AI analytics, and cloud storage under multiyear renewals. Heidelberg Engineering focuses on combined OCT / FA scanners with real-time angiography overlays.
Disruptors emphasize affordability and portability. Avant Technologies partners with Ainnova Tech on smartphone-driven cameras targeting primary care, while AEYE Health collaborates with Optomed to embed AI triage in handheld imagers. Start-ups developing plant-based dyes and chip-level OCT modules extend competitive pressure into consumables. Supply-chain fragility exposed by Hub Pharmaceuticals’ withdrawal has prompted incumbents to explore vertical integration or dual-sourcing arrangements.
Strategic alliances continue to reshape the field. Alcon’s pending purchase of LENSAR in 2025 underscores broader consolidation across ophthalmic surgery, expected to enhance inter-segment synergies. FDA clearance of OcuSciences’ retinal metabolic scanner introduces a complementary technology that may influence imaging workflows, creating potential partnership opportunities for established dye-based system vendors.
Fluorescein Angiography Industry Leaders
Topcon Corporation
Carl Zeiss Meditec AG
Nikon Corp. (Optos PLC)
Canon Inc.
Nidek Co., Ltd.
- *Disclaimer: Major Players sorted in no particular order

Recent Industry Developments
- May 2025: OcuSciences received FDA clearance for a retinal health scanner introducing metabolic imaging to clinical practice.
- March 2025: Alcon agreed to acquire LENSAR for USD 356 million, expanding its cataract surgical portfolio with the ALLY robotic laser system.
- April 2024: Carl Zeiss Meditec completed its DORC acquisition, strengthening its retina-surgery device lineup.


Global Fluorescein Angiography Market Report Scope
| Standard Fundus Camera FA |
| Ultra-Widefield FA |
| Scanning Laser Ophthalmoscope FA |
| OCT / FA Combined Systems |
| Handheld / Smartphone FA Systems |
| Diabetic Retinopathy |
| Age-Related Macular Degeneration |
| Retinal Vein Occlusion |
| Macular & Cystoid Macular Edema |
| Central Serous Chorioretinopathy |
| Inherited Retinal Disorders |
| Hospitals |
| Ophthalmology Clinics |
| Ambulatory Surgical Centres |
| Academic & Research Institutes |
| Tele-ophthalmology Providers |
| Intravenous Sodium Fluorescein |
| Oral Fluorescein |
| Topical Fluorescein (Off-label) |
| North America | United States |
| Canada | |
| Mexico | |
| Europe | Germany |
| United Kingdom | |
| France | |
| Italy | |
| Spain | |
| Rest of Europe | |
| Asia-Pacific | China |
| Japan | |
| India | |
| Australia | |
| South Korea | |
| Rest of Asia-Pacific | |
| Middle East and Africa | GCC |
| South Africa | |
| Rest of Middle East and Africa | |
| South America | Brazil |
| Argentina | |
| Rest of South America |
| By Imaging Modality | Standard Fundus Camera FA | |
| Ultra-Widefield FA | ||
| Scanning Laser Ophthalmoscope FA | ||
| OCT / FA Combined Systems | ||
| Handheld / Smartphone FA Systems | ||
| By Indication | Diabetic Retinopathy | |
| Age-Related Macular Degeneration | ||
| Retinal Vein Occlusion | ||
| Macular & Cystoid Macular Edema | ||
| Central Serous Chorioretinopathy | ||
| Inherited Retinal Disorders | ||
| By End User | Hospitals | |
| Ophthalmology Clinics | ||
| Ambulatory Surgical Centres | ||
| Academic & Research Institutes | ||
| Tele-ophthalmology Providers | ||
| By Dye Delivery Method | Intravenous Sodium Fluorescein | |
| Oral Fluorescein | ||
| Topical Fluorescein (Off-label) | ||
| By Geography | North America | United States |
| Canada | ||
| Mexico | ||
| Europe | Germany | |
| United Kingdom | ||
| France | ||
| Italy | ||
| Spain | ||
| Rest of Europe | ||
| Asia-Pacific | China | |
| Japan | ||
| India | ||
| Australia | ||
| South Korea | ||
| Rest of Asia-Pacific | ||
| Middle East and Africa | GCC | |
| South Africa | ||
| Rest of Middle East and Africa | ||
| South America | Brazil | |
| Argentina | ||
| Rest of South America | ||


Key Questions Answered in the Report
How large is the fluorescein angiography market in 2025?
The fluorescein angiography market size is USD 804 million in 2025 with a CAGR of 7.54% toward 2030.
Which imaging modality leads revenue?
Standard fundus-camera fluorescein angiography holds 44.34% share in 2024, topping all modalities.
What region is growing fastest?
Asia-Pacific records the highest 9.89% CAGR due to expanding diabetes prevalence and infrastructure investment.
Why are handheld / smartphone systems important?
They post a 12.01% CAGR because low pricing and AI integration enable deployment in primary-care and rural settings.
What is the main restraint on growth?
Rapid uptake of non-invasive OCT-angiography alternatives subtracts 1.8% from forecast CAGR by reducing dye-based procedure demand.
Page last updated on:


