
Europe Sensors Market Size and Share
Market Overview
| Study Period | 2020 - 2031 |
|---|---|
| Forecast Data Period | 2026 - 2031 |
| Historical Data Period | 2020 - 2024 |
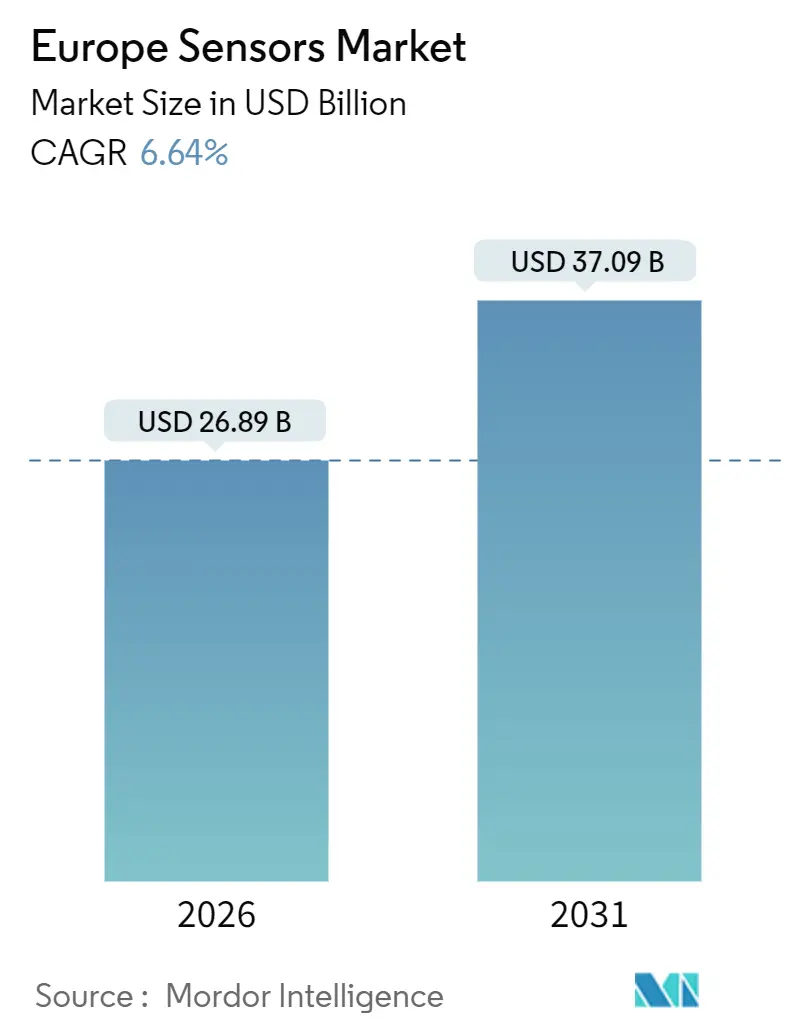
| Market Size (2026) | USD 26.89 Billion |
| Market Size (2031) | USD 37.09 Billion |
| Growth Rate (2026 - 2031) | 6.64 % |
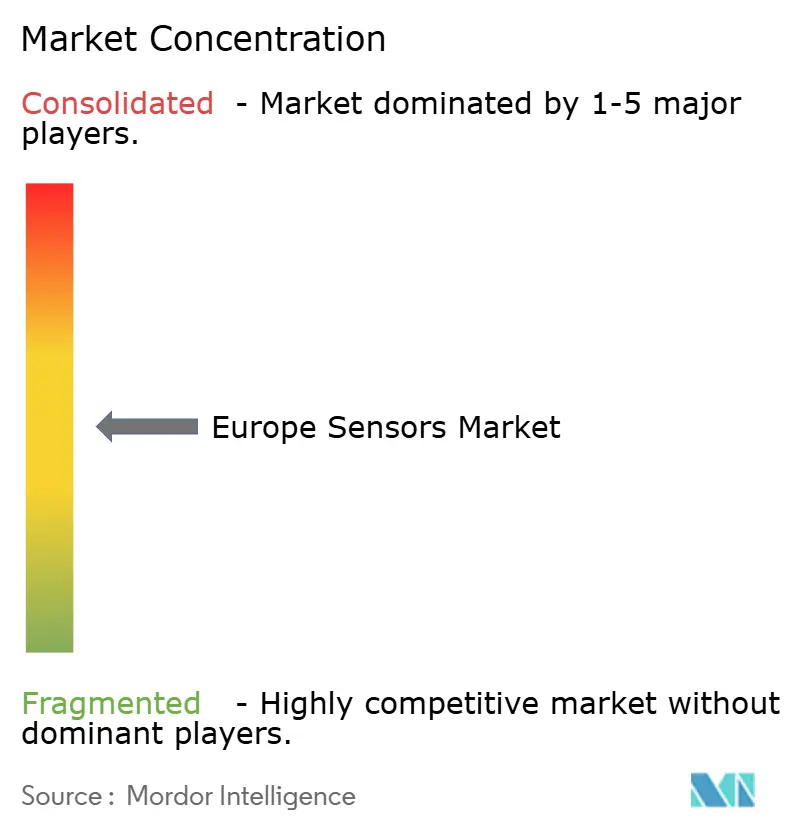
| Market Concentration | Medium |
Major Players *Disclaimer: Major Players sorted in no particular order Image © Mordor Intelligence. Reuse requires attribution under CC BY 4.0. | |
Europe Sensors Market Analysis by Mordor Intelligence
The Europe sensors market size stood at USD 26.89 billion in 2026 and is projected to reach USD 37.09 billion by 2031, advancing at a 6.64% CAGR during 2026-2031. A sustained policy push to digitize infrastructure, stricter emissions-reporting rules, and the automotive sector’s rapid electrification are moving sensors from discretionary add-ons to mandatory design wins. Edge-AI processing is gaining favor because it addresses GDPR-related data-sovereignty concerns, trimming cloud costs and latency. Reshoring incentives in the European Chips Act are encouraging domestic fabs, yet near-term supply remains tight, prompting design teams to dual-source analog front ends. LiDAR modules priced below USD 1,000 are expanding beyond passenger vehicles into warehouse robots, while MEMS investment cycles are shortening as Bosch and STMicroelectronics ramp 300-millimeter capacity. These shifts collectively underpin mid-single-digit growth even as legacy process-control and consumer-electronics avenues mature.
Key Report Takeaways
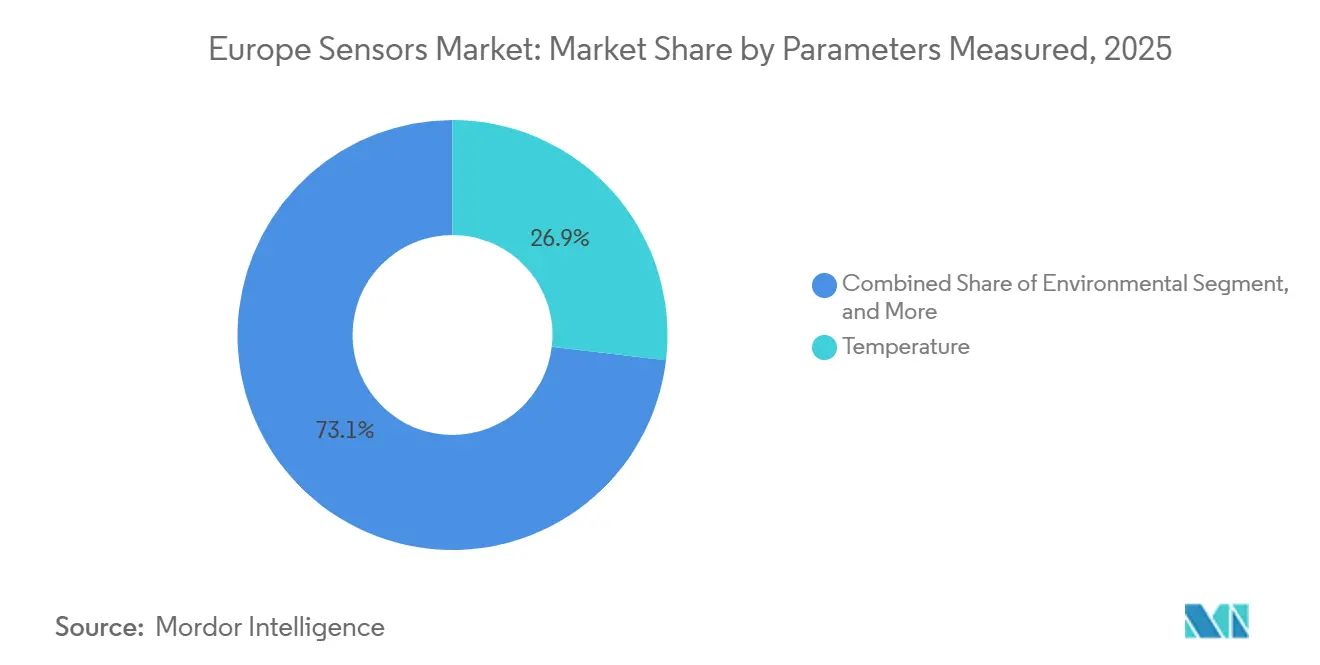
- By parameters measured, temperature sensors commanded 26.87% of Europe sensors market share in 2025, while environmental sensors are poised to grow at an 8.61% CAGR through 2031.
- By mode of operation, optical sensors led with 19.16% revenue share in 2025; LiDAR modules are projected to expand at an 8.43% CAGR to 2031.
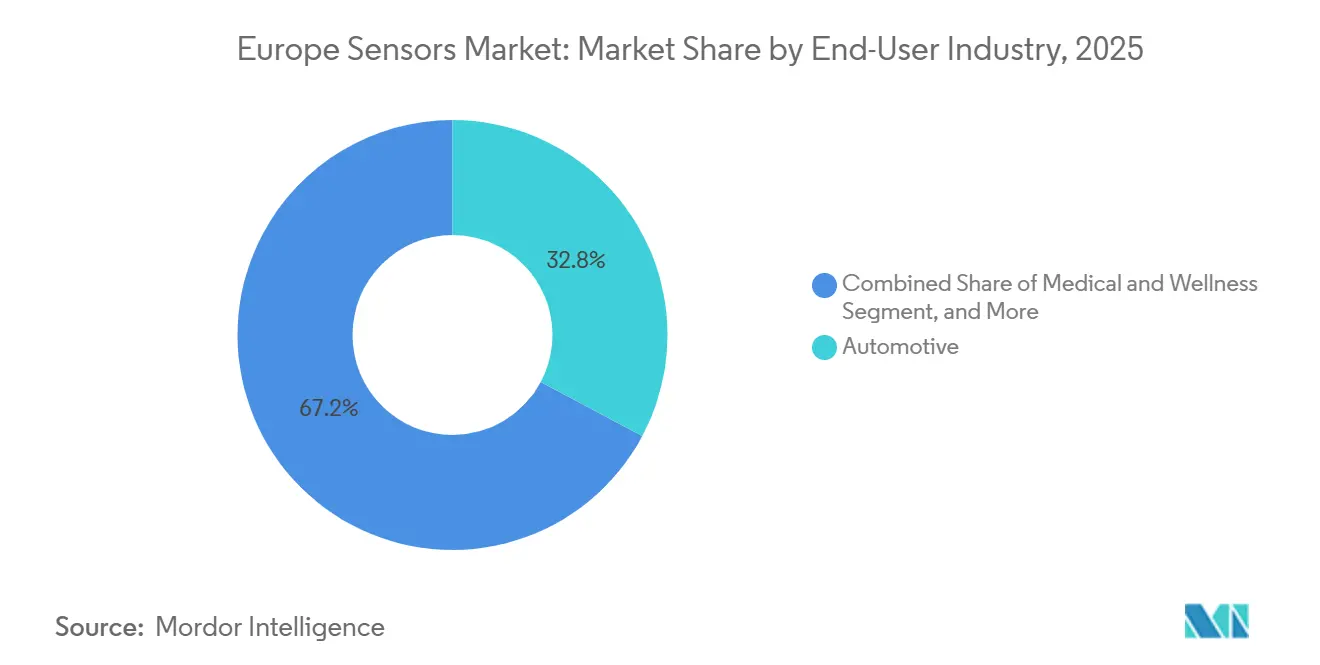
- By end-user industry, automotive applications accounted for 32.78% of demand in 2025, whereas medical and wellness deployments are advancing at an 8.26% CAGR through 2031.
- By sensor technology, MEMS devices captured 53.44% of the Europe sensors market in 2025 and are forecast to grow at a 6.83% CAGR through 2031.
- By geography, Germany accounted for 27.89% of the Europe sensors market in 2025, while Poland is projected to register an 8.29% CAGR during 2026-2031.
Note: Market size and forecast figures in this report are generated using Mordor Intelligence’s proprietary estimation framework, updated with the latest available data and insights as of January 2026.
Global valuation is built by aggregating outputs from multiple regions, with Europe forming one of the important contributors. Mordor Intelligence's global sensors market size report represents that cumulative total.
Europe Sensors Market Trends and Insights
Drivers Impact Analysis*
| Driver | (~) % Impact on CAGR Forecast | Geographic Relevance | Impact Timeline |
|---|---|---|---|
| Surging Demand in Automotive Sector | +1.8% | Germany, France, Italy, Spain | Medium term (2-4 years) |
| Proliferation of Industry 4.0 Smart Factories | +1.5% | Germany, Netherlands, Poland | Long term (≥ 4 years) |
| Acceleration of Electric-Vehicle Adoption | +1.2% | Germany, United Kingdom, France, Netherlands | Medium term (2-4 years) |
| Rapid Uptake of Industrial IoT Edge-AI Sensors | +1.1% | Germany, United Kingdom, France | Long term (≥ 4 years) |
| Mandatory EU Climate-Monitoring Regulations | +0.7% | Pan-European | Short term (≤ 2 years) |
| Growth of Smart Infrastructure (Rail, Energy) | +0.6% | Germany, France, United Kingdom, Spain | Long term (≥ 4 years) |
| Source: Mordor Intelligence | |||
Surging Demand in the Automotive Sector
European automakers integrated 150-200 sensors per 2026 model, up from roughly 100 in 2020, a jump driven by Euro NCAP protocols that make advanced driver-assistance systems standard fitment.[1]Euro NCAP, “2025 Protocols Elevate ADAS to Standard Fitment,” euroncap.com Radar, ultrasonic, and camera arrays dominate the bill of materials, yet cost-reduced solid-state LiDAR, such as Valeo’s SCALA 3 at sub-USD 1,000, has begun enabling Level 3 highway autonomy. Additional content stems from battery-management sensors monitoring thermal runaway in 800-volt packs. Continental’s 2025 acquisition of silicon carbide signals vertical integration in high-temperature current sensing. Together, these trends lift unit volumes and average selling prices, reinforcing the growth trajectory of the Europe sensors market.
Proliferation of Industry 4.0 Smart Factories
More than 2 million industrial IoT nodes were deployed in 2025, each bundling 3-5 sensors for vibration, temperature, and energy data.[2]European Commission, “Digital Europe Program IoT Node Statistics,” digital-strategy.ec.europa.eu Predictive maintenance reduces unplanned downtime by up to 30%, justifying retrofit costs within 2 years. Siemens’ Xcelerator platform posted 40% annual growth in connected assets as tier-one suppliers demanded real-time quality traceability. The pivot to edge inference boosts demand for smart sensors with 16-bit ADCs and on-board DSPs, typified by Bosch Sensortec’s BHI360 launch in October 2025. These deployments underpin long-run demand visibility for the Europe sensors market.
Acceleration of Electric-Vehicle Adoption
Registrations of battery-electric vehicles climbed to 2.8 million units in 2025, up 35% year on year, following tightening fleet-average CO₂ penalties.[3]ACEA, “Battery-Electric Vehicle Registrations 2025,” acea.auto Each EV uses 30-50 incremental sensors, spanning high-voltage current shunts to coolant-flow meters. STMicroelectronics reported a 28% spike in automotive-sensor revenue in 2025, driven by supplying VN9D30Q8F drivers for inductive position sensing. Hall-effect devices with 1,500-volt isolation are becoming standard as premium brands shift to 800-volt powertrains. These dynamics raise the sensor-content ceiling and help sustain a robust outlook for the Europe sensors market.
Rapid Uptake of Industrial IoT Edge-AI Sensors
Roughly 1.2 million edge-AI nodes capable of local neural network inference were installed in 2025, especially in pharma and aerospace plants that restrict cloud uploads for sovereignty and latency reasons. Texas Instruments’ MSPM0 MCU enables 10-year coin-cell operation, illustrating the power-budget breakthroughs fueling adoption. NXP’s i.MX RT1180 crossover processor brings 0.5 TOPS NPU performance into defect-inspection cameras. Demand for co-packaged sensors with retrainable AI cores positions MEMS suppliers to capture recurring software value, bolstering the revenue base of the Europe sensors market.
Restraints Impact Analysis*
| Restraint | (~) % Impact on CAGR Forecast | Geographic Relevance | Impact Timeline |
|---|---|---|---|
| High Initial Integration Costs | -0.9% | Southern and Eastern Europe | Short term (≤ 2 years) |
| Semiconductor Supply-Chain Disruptions | -0.7% | Pan-European | Medium term (2-4 years) |
| Skills Gap in Sensor Fusion Engineering | -0.5% | Germany, France, United Kingdom | Long term (≥ 4 years) |
| GDPR-Driven Data-Governance Complexity | -0.3% | Pan-European | Medium term (2-4 years) |
| Source: Mordor Intelligence | |||
High Initial Integration Costs
Retrofitting legacy equipment costs EUR 5,000-15,000 per asset, a hurdle for SMEs operating on sub-10% margins. Integration fees for ERP mapping range from EUR 50,000 to EUR 100,000, stretching payback timelines. Pressure and temperature loops often remain analog, forcing either rip-and-replace or edge-digitization middleware. Endress+Hauser’s Heartbeat Technology is gaining traction as a cost-effective compromise that defers capital replacement. Until hardware prices drop further, cost sensitivities will curb uptake and slightly temper the Europe sensors market CAGR.
Semiconductor Supply-Chain Disruptions
Lead times for automotive-grade MCUs were still 26-40 weeks in early 2026, versus 12-16 weeks pre-2020. Mature-node fabs run at full allocation, delaying sensor-module builds and inflating prices by 15-25%. GlobalFoundries’ EUR 2 billion Dresden expansion will not be completed until 2027, and the ESMC joint venture will only begin pilot production in late 2027. The resulting volatility forces manufacturers to build buffer inventory, tying up working capital and marginally dragging on the growth of the Europe sensors market.
*Our forecasts treat driver/restraint impacts as directional, not additive. The impact forecasts reflect baseline growth, mix effects, and variable interactions.
Segment Analysis
By Parameters Measured: Environmental Sensors Capitalize on Emissions Mandates
Environmental devices are forecast to grow at 8.61% during 2026-2031 as the Corporate Sustainability Reporting Directive phases in third-party-verified Scope 1-3 disclosures. The Europe sensors market for this sub-segment is expanding rapidly because particulate-matter, NOx, and VOC analyzers now feed continuous-emissions-monitoring systems across chemical and metallurgical sites. Satellite feedback from ESA’s Sentinel-5, launched in August 2025, improves ground-station calibration and extends sensor life. Temperature sensors, at 26.87% share in 2025, remain indispensable in custody-transfer flows across energy and food processing. Flow instruments are rising as utilities deploy smart meters to spot leaks, while proximity sensors meet IEC 61496 redundancy rules in collaborative robots.
Combination modules that measure temperature, humidity, and pressure in a single package reflect a trend toward convergence that rewards suppliers skilled in multi-chip packaging. Chemical sensors are moving from niche to mainstream as pharmaceutical bioreactors demand real-time glucose and pH monitoring. Magnetic sensors embedded in brushless DC motors continue to proliferate as industrial electrification advances. Overall, diversified use cases ensure the parameters-measured category remains a steady volume driver within the Europe sensors market.



By Mode of Operation: LiDAR Modules Disrupt Optical Dominance
Optical devices retained a 19.16% share in 2025, driven by safety curtains, fiber-optic strain sensors, and spectrometry modules. However, solid-state LiDAR is tracking an 8.43% CAGR as sub-USD 500 pricing opens warehouse automation and agricultural machinery opportunities. Electrical-resistance sensors like thermistors continue to serve legacy HVAC and force applications but face a margin squeeze. Biosensors for glucose and lactate now achieve clinical accuracy in handhelds, setting the stage for multi-analyte wearables. Capacitive and piezoelectric sensors serve touch and ultrasonic applications, though growth is modest given the technology's maturity.
Radar, both 24 GHz short-range and 77 GHz long-range, remains standard in blind-spot and adaptive-cruise systems, with NXP and Infineon leading chipset supply. As autonomous platforms demand redundancy, perception stacks increasingly fuse camera, radar, and LiDAR data, thereby increasing the need for synchronized, time-stamped outputs. Suppliers offering turnkey sensor suites enjoy a competitive edge in the Europe sensors market.
By End-User Industry: Medical and Wellness Outpaces Automotive
Medical and wellness deployments are pacing at an 8.26% CAGR because national health systems now reimburse remote patient monitoring solutions. Movesense’s MD-grade ECG module showcases how Bluetooth-enabled wearables stream 3-lead data for arrhythmia detection without clinical supervision. Consumer trust rose after a 2025 peer review validated sub-3% error rates with hospital-grade devices. Automotive, despite holding a 32.78% share in 2025, is entering an optimization phase as OEMs consolidate sensors into zonal architectures to manage their bill of materials.
Energy utilities deploy voltage and current sensors to stabilize grids as they move toward 40% renewables by 2030. Industrial actors embrace vibration and temperature probes for predictive maintenance, while construction and agriculture see sporadic adoption tied to regional connectivity gaps. Defense and aerospace remain high-value niches immune to consumer-cycle volatility. Together, these verticals diversify demand and reinforce resilience in the Europe sensors market.
By Sensor Technology: MEMS Consolidates Leadership
MEMS claimed 53.44% of the Europe sensor market share in 2025 and is projected to grow at a 6.83% CAGR as 300-millimeter fabs, such as Bosch’s Dresden plant, add 30% capacity. Silicon micromachining now spans microphones, gas sensors, and micro-mirror arrays, lowering unit costs under USD 1 for high-volume lines. STMicroelectronics is co-developing MEMS ultrasonic sensors for Euro NCAP’s 2026 child-presence mandate, underscoring automotive pull-through. Hybrid MEMS-quartz modules target navigation-grade inertial guidance in GPS-denied zones, widening application scope.
As integration tightens among mechanical structures, analog conditioning, and edge ML, MEMS vendors are poised to extract greater value from software ecosystems tied to the Europe sensors market.
Geography Analysis
Germany captured 27.89% of the Europe sensors market in 2025, buoyed by the automotive triad, which ordered more than 500 million sensors for vehicle production and aftermarket service. Bosch’s new wafer fab and Siemens’ Xcelerator rollouts strengthen local ecosystems, while universities provide a steady stream of engineering talent. The United Kingdom and France leverage aerospace clusters where Rolls-Royce embeds 10,000 sensors per Trent XWB engine, and Thales integrates millimeter-wave radar into air-traffic networks. Italy and Spain focus on smart-grid and renewable energy deployments, but lag behind Germany in automation penetration.
Poland is expected to log an 8.29% CAGR through 2031, the fastest in the bloc, after Intel’s USD 2.1 billion packaging plant and L3Harris’s sensor assembly site both opened in 2025. The Netherlands’ Eindhoven corridor hosts over 50 photonics startups commercializing coherent LiDAR and integrated spectrometers, reinforcing regional specialization. While EU Chips Act subsidies total EUR 43 billion, new fabs will not meaningfully ease supply until 2027, leaving short-run allocations tight.
Eastern European nations attract greenfield plants through labor arbitrage and proximity to Western OEMs, yet Germany’s incumbency in automotive engineering remains difficult to replicate. Reshoring favors suppliers co-locating packaging near fabs for traceability, an increasingly stringent requirement in safety-critical sectors. Collectively, geographic dynamics diversify revenue streams and lower systemic risk in the Europe sensors market.
Coverage of the sensors market by Mordor Intelligence spans a wide geographic footprint, with regional analysis available for Asia, alongside detailed country-level intelligence for China, Japan, South Korea, Taiwan, and United States, each shaped by local operating conditions.
Regulatory Landscape
Sensor demand and product requirements in Europe are increasingly shaped by cross-cutting EU rules covering cybersecurity, data handling, and industrial sustainability reporting, alongside industrial-safety standards adopted at the OEM level. The EU Cyber Resilience Act is raising baseline expectations for secure-by-design hardware and long-term updateability for products with digital elements, which then affects connected sensor modules, gateways, and embedded firmware used in industrial automation and smart infrastructure.
On 03 June 2026, the European Commission adopted a proposal for a Chips Act 2.0 package to reinforce the Union semiconductor ecosystem and address strategic dependencies, strengthening policy support for local sensor-relevant semiconductor capacity and supply-chain coordination. In parallel, the Commission proposed a Revised Cybersecurity Act on 20 January 2026 that targets a Union-wide ICT supply chain security framework, increasing compliance pressure on sourcing, traceability, and assurance for sensor electronics deployed in safety- and mission-critical environments.
Value Chain Analysis
The Europe sensors value chain runs from semiconductor materials and wafer fabrication (often mature-node for mixed-signal and MEMS) to sensor design and IP, front-end manufacturing (MEMS/CMOS and specialty processes), assembly and test, and module integration that combines sensing elements with analog front ends, MCUs, connectivity, and firmware. Distribution flows through direct OEM and tier-1 supply in automotive, industrial automation, and energy, with broadline channels also serving industrial and building applications; system integrators and automation vendors then embed sensors into control stacks and digitalization programs.
Policy-driven coordination is also widening around resilience and visibility across the semiconductor and sensor supply base, including the European Semiconductor Board role in mapping and monitoring the value chain and highlighting device-level data gaps that slow crisis response. Downstream, interoperability and engineering productivity increasingly depend on cross-vendor automation software ecosystems, such as Siemens environments that connect sensors, drives, robots, and production management. Digital-twin workflows, including collaborations using NVIDIA Omniverse libraries, pull more sensor telemetry into simulation and lifecycle services, which raises the importance of software, calibration, and cybersecurity across the chain.
Competitive Landscape
The top five suppliers, Bosch, Siemens, STMicroelectronics, Infineon, and TE Connectivity, command roughly a 35-40% share, indicating moderate concentration within the Europe sensors market. Bosch is injecting EUR 3 billion into Dresden to build 300-millimeter MEMS capacity, while Siemens has folded edge-gateway software into its Xcelerator stack to provide sensor-to-cloud continuity. Specialists such as Sick AG and Pepperl+Fuchs thrive in safety-rated proximity and explosion-proof niches that larger players overlook.
Technology leadership is trending toward embedded intelligence; ABB’s Ability platform registered 25% growth in connected industrial assets during 2025 by pairing sensors with digital twins. Patent filings for MEMS microphones, capacitive fingerprint readers, and time-of-flight imaging rose 12% in 2025, underlining the importance of IP portfolios. Compliance with the forthcoming EU AI Act nudges vendors to adopt explainable-AI firmware, increasing software R&D overhead but offering a differentiation path.
White-space opportunities include sub-USD 500 solid-state LiDAR, continuous metabolic biosensors, and emissions-grade environmental modules. Startups bundle pre-calibrated sensors with firmware, lowering integration barriers for customers lacking in-house sensor-fusion talent. As software differentiation eclipses hardware alone, partnerships between chipmakers and algorithm vendors will shape future competitive positioning in the Europe sensors market.
Europe Sensors Industry Leaders
Texas Instruments Incorporated
TE Connectivity Ltd
Honeywell International Inc.
Rockwell Automation Inc.
Siemens AG
- *Disclaimer: Major Players sorted in no particular order

Market Opportunities and Future Outlook
A primary opportunity area is cybersecurity- and compliance-ready sensing hardware for industrial and infrastructure deployments, since buyers are standardizing on secure, updatable products with digital elements and pressing for clearer ICT supply-chain assurance. This is reflected in vendor actions to align industrial control portfolios with the EU Cyber Resilience Act, which increases requirements for embedded security, patchability, and documentation across connected sensor systems and the automation layers they feed.
Another whitespace centers on sensor-rich industrial AI and digital-twin adoption in factories and utilities, where data quality, time synchronization, and edge processing shape how much value teams capture from simulation and optimization. Siemens’ Digital Twin Composer capabilities in July 2026, along with modular automation concepts within TIA Portal environments, points to near-term pull for higher-fidelity sensing (vibration, energy, temperature, machine condition) that fits into standardized engineering toolchains. On the supply side, the European Commission’s Chips Act 2.0 proposal (03 June 2026) adds momentum for localized semiconductor and sensor ecosystems, supporting programs targeting strategic dependencies in sectors such as healthcare and defense and strengthening the business case for Europe-based production, test, and packaging tied to sensor electronics.
Recent Industry Developments
- June 2026: TE Connectivity and Mouser began stocking the 8XH high-accuracy media-isolated pressure sensor family, targeting semiconductor equipment, medical devices, and process automation. The availability expands sensor module options for high-end applications. The arrangement strengthens the European sensor supply chain and accelerates adoption of high-accuracy pressure sensors in critical markets.
- March 2026: Texas Instruments partners with NVIDIA to integrate TI mmWave radar technology with NVIDIA Jetson Thor for 3D perception in humanoid robotics. The collaboration advances automotive and robotics sensing with edge AI fusion. Maps TI's radar tech to AI-enabled edge systems, expanding sensor-processor stack for autonomous and industrial applications in Europe.
- January 2026: Texas Instruments accelerates shift toward autonomous vehicles with expanded automotive portfolio. The expansion broadens TI's automotive sensor and radar portfolio. The move strengthens TI’s position in European automotive sensing via broader radar and edge AI offerings.


Research Methodology Framework and Report Scope
Market Definition and Coverage
This market covers the revenues generated from sensors sold and used across Europe, where sensing elements and related modules convert physical, chemical, or biological signals into measurable electrical outputs for end users.
Scope exclusions: We exclude unrelated downstream services such as installation-only labor, long-term maintenance contracts, and general analytics software that can be used without a sensor hardware sale.
Segmentation Overview
- By Parameters Measured
- Temperature
- Pressure
- Level
- Flow
- Proximity
- Environmental
- Chemical
- Inertial
- Magnetic
- Vibration
- By Mode of Operation
- Optical
- Electrical Resistance
- Biosensor
- Piezoresistive
- Image
- Capacitive
- Piezoelectric
- LiDAR
- Radar
- By End-User Industry
- Automotive
- Consumer Electronics
- Energy
- Industrial
- Medical and Wellness
- Construction, Agriculture and Mining
- Aerospace
- Defense
- By Sensor Technology
- MEMS
- Non-MEMS
- By Country
- Germany
- United Kingdom
- France
- Italy
- Spain
- Netherlands
- Poland
- Rest of Europe
Data Sources, Market Sizing, and Validation
Desk Research
Desk work starts by mapping the Europe demand and supply picture for sensors across major end-use industries, and then aligning it with observable indicators that can be checked year over year. We mainly lean on public and official sources such as Eurostat industry and trade statistics, European Commission publications on electronics and industrial policy, UNECE and national vehicle registration statistics, and patent offices such as the EPO for sensing-related filing trends.
Next, we use company annual reports, investor presentations, and product documentation to understand how sensor revenues are reported and what is bundled versus sold separately. For cross-checks, we also use paid subscriptions for company financial intelligence, news and financials, and patent databases, and in some cases shipment-level import and export data for signal checks on selected sensor categories. The desk research sources listed here are illustrative, and many other public and paid sources were also used for data collection, validation, and clarification.
Primary Interviews and Surveys
Primary work is used to confirm what sits inside the pricing unit (die, packaged sensor, module, or sensor plus interface) and how buying happens across automotive, industrial automation, medical devices, and consumer electronics. We cover demand-side roles (procurement, engineering, and plant teams) and supply-side roles (product, sales, and operations), then align responses across key European manufacturing hubs and import-reliant markets to reduce single-country bias.
Distribution of primary research fieldwork respondents
| Company type | Respondent position |
|---|---|
| Top tier: 32% | CXOs: 13% |
| Mid tier: 48% | Functional/Unit leaders: 36% |
| Smaller Players: 20% | Managers: 51% |
Market-Sizing & Forecasting
Sizing is built using a top-down approach where manufacturing output, electronics production exposure, and trade flows are used to reconstruct the Europe demand pool by end-use, then converted into value using realistic pricing bands. Once that spine is built, we corroborate it with selective bottom-up approximations, such as sampled shipments by category, channel checks on typical ASP ranges, and supplier revenue splits where disclosures allow.
Inputs that shaped the model include automotive production and electrification direction, industrial automation investment cadence, medical device output trends, and the mix shift toward higher-value sensing types (for example, tighter safety and emissions needs usually push higher content per system). Pricing progression is treated carefully by separating technology cost-down effects from temporary supply tightness, and then checking that the implied ASP curve stays consistent with what buyers and suppliers described. Forecasting uses scenario analysis supported by expert views on cycle timing, and the final path is adjusted where indicators conflict. That is also where gaps in category-level data are handled with conservative share-of-system assumptions.
Data Validation & Update Cycle
Validation happens through several passes where the total is checked against independent signals, such as trade values, reported sensor-related revenue exposures, and end-market output movement, before the numbers are signed off. If a country or end-use result looks out of line, it is reworked, and when needed, respondents are re-contacted to confirm whether the shift is real or caused by definition issues.
A second analyst reviews key assumptions, including pricing, unit boundaries, and conversion rates, then a final review is done before publication. Reports are refreshed annually, and interim updates are made when material events occur that can change demand, supply, or pricing direction. Before delivery, an analyst performs a fresh pass so clients receive the latest updated view.
Mordor Intelligence's Europe Sensors Market Size Measured Against Other Published Estimates
Published market values for Europe sensors can differ because each publisher draws the market boundary in its own way, and then uses different price, currency timing, and category roll-ups to turn volumes into dollars. The benchmark table shows a visible spread, and in Mordor Intelligence's model the total counts sensor hardware and sensor modules sold into Europe while keeping adjacent software-only revenue and installation-only services outside the market value.
A second driver is the base case used for forecasting, where some estimates lean more aggressive on smart infrastructure and industrial IoT adoption, while others use a slower replacement cycle for legacy industrial sensors. Differences also come from how ASP trends are handled (steady cost-down versus step changes tied to shortages), and from refresh cadence, since older pages may still reflect pre-update trade and production assumptions.
Benchmark comparison
| Source | Market Size | Gaps in Research Methodology |
|---|---|---|
| Mordor Intelligence | USD 26.89 B (2026) | |
| Regional Consultancy A | USD 62.80 B (2026) | This figure appears to include a wider electronics scope that can fold in broader sensing systems and value-added layers, and it may also use a longer horizon where mid-period growth assumptions compound into a larger base year value. |
| Trade Journal B | USD 23.65 B (2025) | The estimate is anchored to an earlier year and likely applies narrower category coverage or a more conservative pricing progression, which can pull down the value when modules and higher-content sensing in automotive and factory automation are not fully reflected. |
Overall, the comparison points to scope and pricing treatment as the main reasons the numbers do not line up. By keeping the market tied to clear sensor hardware and module revenues and then checking the totals against repeatable external indicators, the final value stays traceable and easier to reconcile across countries and end uses.


Key Questions Answered in the Report
What is the current value of the Europe sensors market?
The market was valued at USD 26.89 billion in 2026 and is forecast to reach USD 37.09 billion by 2031.
Which segment is growing fastest within the market?
Environmental sensors lead growth at an 8.61% CAGR because EU emissions-reporting rules spur demand for particulate-matter and gas analyzers.
How large is automotive’s share in regional demand?
Automotive applications accounted for 32.78% of demand in 2025, reflecting continued electrification and ADAS uptake.
Why are MEMS sensors so dominant?
MEMS captured 53.44% share in 2025 due to scalable 300-millimeter wafer production that lowers costs and integrates on-board processing.
Which country will grow fastest through 2031?
Poland is projected to advance at an 8.29% CAGR, driven by new semiconductor packaging and sensor-assembly investments.
What supply-chain risk should buyers monitor?
Lead times for automotive-grade microcontrollers remain 26-40 weeks, keeping component availability the primary operational risk through 2027.
Page last updated on:





