
Market Overview
| Study Period | 2020 - 2031 |
|---|---|
| Forecast Data Period | 2026 - 2031 |
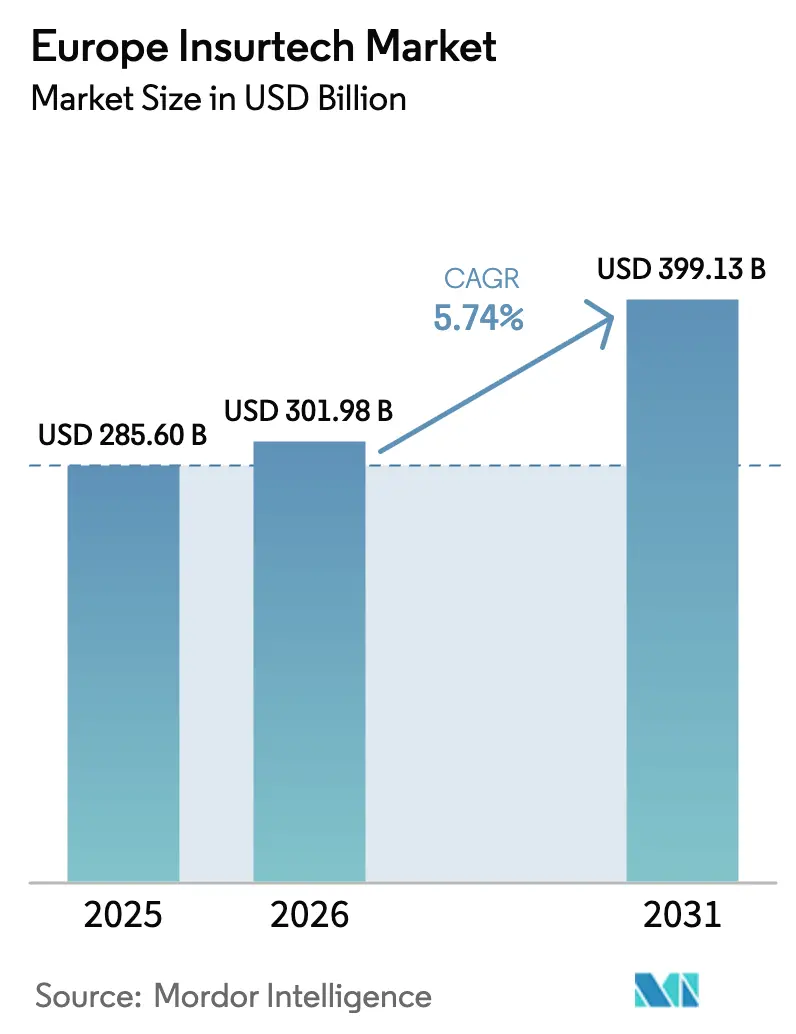
| Base Year Market Size (2025) | USD 285.60 Billion |
| Market Size (2026) | USD 301.98 Billion |
| Market Size (2031) | USD 399.13 Billion |
| Growth Rate (2026 - 2031) | 5.74 % |
| Market Concentration | Medium |
Major Players *Disclaimer: Major Players sorted in no particular order Image © Mordor Intelligence. Reuse requires attribution under CC BY 4.0. | |
Europe Insurtech Market Analysis by Mordor Intelligence
The European insurtech market size was valued at USD 285.60 billion in 2025 and estimated to grow from USD 301.98 billion in 2026 to reach USD 399.13 billion by 2031, at a CAGR of 5.74% during the forecast period (2026-2031). Migration to API-enabled open-insurance, expansion of generative-AI underwriting, and fast-growing embedded distribution models reinforce the upward trajectory. Climate-related loss events, mounting cyber exposures, and rapid aging of the population unlock fresh premium pools through parametric and longevity covers. Funding flows have become more selective, so capital now gravitates toward carriers that can show disciplined loss ratios and strong regulatory compliance. Competitive intensity is moderate because data governance obligations under the EU AI Act raise entry barriers, favoring firms with sophisticated model-validation toolkits.
Key Report Takeaways
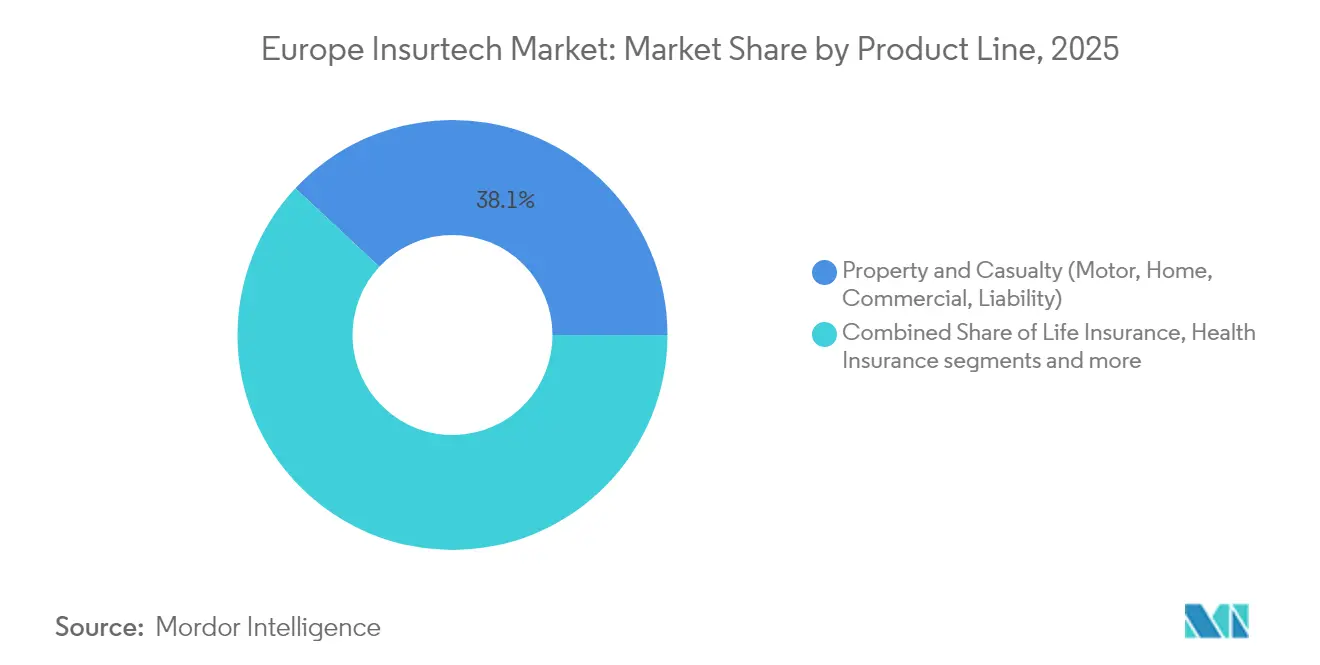
- By product line, specialty policies advanced at a 7.34% CAGR while property & casualty retained 38.05% of the European insurtech market share in 2025.
- By distribution channel, agents and brokers controlled 42.60% of the European insurtech market size in 2025, and embedded insurance platforms are projected to expand at a 6.28% CAGR.
- By end user, retail buyers generated 64.05% of premium in 2025, while SME commercial demand rises at a 6.65% CAGR.
- By geography, the United Kingdom held 17.12% of premium in 2025, and Spain leads growth with a 6.74% CAGR.
Note: Market size and forecast figures in this report are generated using Mordor Intelligence’s proprietary estimation framework, updated with the latest available data and insights as of 2026.
Europe Insurtech Market Trends and Insights
Drivers Impact Analysis*
| Driver | (~) % Impact on CAGR Forecast | Geographic Relevance | Impact Timeline |
|---|---|---|---|
| Digital-first adoption and open-insurance APIs | +1.2% | UK, Netherlands, Germany, EU-wide | Medium term (2-4 years) |
| Embedded insurance with e-commerce and mobility | +1.4% | DACH, UK, France | Short term (≤ 2 years) |
| Generative-AI underwriting and claims automation | +1.1% | London, Munich, Zurich | Medium term (2-4 years) |
| Climate-driven parametric coverage expansion | +1.3% | Mediterranean, Alpine, Northern Europe | Short term (≤ 2 years) |
| Usage-based insurance via telematics and IoT | +0.7% | Italy, Spain, Nordic region | Medium term (2-4 years) |
| API-led bancassurance partnerships | +0.6% | France, BENELUX, Central Europe | Long term (≥ 4 years) |
| Source: Mordor Intelligence | |||
Digital-first adoption and open-insurance APIs
European consumers now expect end-to-end digital journeys for quoting, binding, servicing, and claims after pandemic lockdowns accelerated channel migration. The EU Financial Data Access law that comes into force in 2027 mandates standardized APIs, which will slash switching friction and open multi-carrier comparison on any device. Incumbents, therefore, divert larger IT budgets to customer-facing micro-services in order to preserve share. Fintech sandboxes in the United Kingdom and Netherlands shorten product-testing cycles and encourage start-ups to plug directly into core-banking ecosystems. As open insurance matures, pricing transparency will reward firms that can pipe in alternative data sets for more granular risk scoring.
Embedded insurance with e-commerce and mobility
Premium written at checkout on ride-hailing, car-subscription, and online retail platforms more than doubled from 2023 to 2024, outpacing all other distribution formats. Qover and Allianz each extended white-label programs that package motor coverage in under 60 seconds for customers buying electric vehicles. Contextual offers lift conversion and keep acquisition cost below EUR 10 per policy, far lower than comparison-site averages. Regulatory sandboxes allow rapid proof-of-concept deployment while preserving product-suitability checks mandated by the Insurance Distribution Directive. E-commerce partners now request bundled cyber and warranty policies, broadening embedded use cases beyond travel and gadget lines.
Generative-AI underwriting and claims automation
Large language models analyze photos, sensor feeds, and policy wording so underwriters can issue quotes in minutes and trigger low-touch claims payouts. Munich Re reports a 4% drop in loss-adjustment expense after integrating satellite and weather data into generative-AI severity prediction modules. The EU AI Act classifies underwriting engines as high-risk, which demands robust audit trails and model explainability[1]. Firms with dedicated validation teams gain a compliance moat. Smaller MGAs increasingly license pre-validated AI stacks to avoid long approval cycles and capital, letting them stay competitive despite scale disadvantages.
Climate-driven parametric coverage expansion
Weather-related losses in Europe reached new highs during the 2024 summer, pushing demand for parametric products that rely on independent triggers rather than lengthy adjustment[2]. AXA launched heat-index covers that pay within 72 hours when temperature thresholds are breached. Descartes Underwriting added multi-peril contracts for vineyard owners, capitalizing on agritech sensors that supply real-time weather data. Regulated capital requirements for property carriers rise when catastrophe frequency climbs, so risk transfer to parametric specialists becomes attractive. Satellite and IoT proliferation strengthens trigger integrity and paves the way for broader corporate adoption.
Restraints Impact Analysis*
| Restraint | (~) % Impact on CAGR Forecast | Geographic Relevance | Impact Timeline |
|---|---|---|---|
| Fragmented regulation across EU member states | -0.8% | EU-wide, especially DACH | Long term (≥ 4 years) |
| Venture-capital pullback and valuation compression | -0.6% | London, Berlin, Paris | Medium term (2-4 years) |
| Data scarcity, quality gaps, and AI bias risks | -0.5% | Global, strictest scrutiny in Europe | Short term (≤ 2 years) |
| Heightened cybersecurity threats to insurtech platforms | -0.4% | Global, high incidence in UK and France | Short term (≤ 2 years) |
| Source: Mordor Intelligence | |||
Fragmented regulations across EU member states
Insurtechs must juggle 28 licensing regimes across the EU, the United Kingdom, and EFTA, each with unique capital buffers and consumer-protection nuances[3]. Solvency II transposition varies, so a passported license rarely removes local reporting duties. Brexit doubled compliance workload for United Kingdom-based firms that sell into Europe, forcing many to establish dual entities. EIOPA’s harmonization roadmap runs to 2030, which delays relief for start-ups seeking continental reach. Larger incumbents can amortize additional governance costs, widening the resource gap and cooling competitive heat.
Venture-capital pullback and valuation compression
European insurtech investment plummeted by more than 40% between 2021 and 2023, echoing broader tech repricing trends. Late-stage rounds saw sharper markdowns, with Wefox raising capital in 2025 at a lower per-share price than in 2022. Investors now demand near-term profitability, lengthening due diligence time, and inserting liquidation preferences. Seed funding remains available, though founders must show regulatory roadmaps and robust reinsurance capacity from day one. The tightened funnel risks starving promising analytics vendors that serve incumbents but lack immediate premium revenue.
*Our forecasts treat driver/restraint impacts as directional, not additive. The impact forecasts reflect baseline growth, mix effects, and variable interactions.
Segment Analysis
By Product Line: Specialty Lines Outpace Core P&C
Property & casualty generated 38.05% of premium in 2025, yet specialty categories enjoy the fastest 7.34% CAGR, adding meaningful dollars to the Europe insurtech market size through 2031. Early movers leverage external telemetry, supply-chain data, and pet-health APIs to shape granular risk pools and deliver combined ratios below 90%. Life and health policy growth holds steady as e-health records speed up underwriting in Germany and France. P&C automation funnels straightforward motor and home quotes into digital funnels, while marine and cyber underwriters handle complex exposures at higher margins. The NIS2 cybersecurity mandate and pet-ownership upticks both fuel premium expansion, enhancing diversification.
Past years show similar trends. From 2020 to 2024, specialty premiums more than doubled in absolute terms, aided by cloud-native pricing engines. Insurtech fleet products, for example, price kilometer usage in real time and rebate safe-driving behaviors monthly. Specialty underwriters also tap reinsurance sidecars to manage tail risk, enabling further appetite without straining capital. Collectively, these factors keep specialty lines the core growth engine of the Europe insurtech market.

By Distribution Channel: Embedded Platforms Capture Incremental Share
Agents and brokers still controlled 42.60% of premium in 2025, illustrating strong personal relationship value in motor fleets and mid-market corporate lines. Yet embedded models, projected at 6.28% CAGR, will gradually chip away at this dominance, directing more flows into the Europe insurtech market. Checkout integration inside retailer and mobility apps drives sub-10-euro acquisition cost and double-digit conversion lifts. Direct-to-consumer portals also gain share as price-comparison sites add robo-advice layers to aid policy selection. Digital MGAs distribute white-label capacity through API endpoints and manage compliance programmatically.
Hybrid advisory structures are rising. Brokers feed quote data from comparison engines to provide scenario guidance while still earning commissions. Bancassurance grows more slowly due to tighter cross-sell rules but modernizes by surfacing personalized offers in bank apps rather than branch desks. Regulatory parity across channels means embedded providers must maintain suitability and disclosure, a hurdle addressed via automated rule engines. Over time, cost leadership and frictionless UX help consolidate share, magnifying the overall European insurtech market value.
By End User: SME Digital Uptake Narrows Protection Gaps
Retail buyers remained dominant at 64.05% in 2025, but SMEs lifted their proportion fastest with a 6.65% CAGR through 2031. Digital portals let entrepreneurs bind liability cover in hours, transforming historically low penetration. Platforms like Allianz Commercial Digital price professional-indemnity and cyber in one checkout journey and credit premiums to cashback wallets. Large corporate procurement stays bespoke and broker-driven, reflecting complex exposures across multiple jurisdictions. Public-sector entities bolster climate-resilience spending, procuring parametric flood covers for municipal infrastructure.
SME momentum reflects two structural forces. First, pandemic interruptions raised awareness of business-continuity insurance, while embedded offers inside accounting packages removed discovery friction. Second, late-payment regulation heightens demand for trade-credit insurance, a product historically geared to large exporters. Digital onboarding drives cost efficiency, making smaller policies profitable on a larger scale. Altogether, these ingredients expand the Europe insurtech market while diversifying risk away from crowded personal lines.

Geography Analysis
The United Kingdom retained 17.12% of Europe insurtech market share in 2025, buoyed by long-standing regulatory sandboxes and deep venture-capital pools that accelerate piloting of AI-enabled underwriting tools. Spain is forecast to post a 6.74% CAGR through 2031 as Mediterranean climate risk elevates demand for parametric weather covers and as digital-banking giants such as BBVA embed micro-policies at checkout. In absolute terms, the United Kingdom still contributes the largest slice of Europe's insurtech market size, yet the gap narrows each year as Iberian, Italian, and French players capture freshly monetized climate and cyber exposures. London’s post-Brexit duplication of reporting duties slows some cross-border deals, but insurers offset friction by setting up EU-domiciled subsidiaries in Dublin and Luxembourg. As a result, premium outflows from the United Kingdom core increasingly re-enter the bloc via reinsurance sidecars booked in continental hubs.
Germany and France together command a sizeable premium pool that rivals the United Kingdom, although Germany’s BaFin requires extra solvency buffers that temper aggressive product experimentation. France gained momentum after PACTE reforms simplified licensing for digital brokers and allowed API-based life-insurance distribution inside neobank apps. Italy follows Spain’s trajectory as pension-gap awareness and state digitalization grants push mobile health and longevity covers into mainstream channels. BENELUX markets outperform on a per-capita basis because Dutch and Belgian carriers adopted open-insurance APIs early, enabling banks to cross-sell policies in under two minutes. Nordic countries show steadier single-digit growth; penetration is already high, yet usage-based motor and smartwatch-driven health products still carve profitable niches.
Central and Eastern Europe offer the largest white space, given low historic insurance density and rapid smartphone adoption that lowers distribution cost. Insurtech MGAs passport policies into Poland, Czechia, and the Baltics while partnering with local third-party administrators to handle claims in native languages. EIOPA’s planned harmonization of consumer-consent templates—expected by 2027—could shave months off new-market launches once implemented, though national sovereignty debates keep timelines fluid. Climate-adaptation funds earmarked for Eastern European transport corridors are already triggering tenders for flood and business-interruption parametric covers, attracting specialist MGAs with satellite analytics. Taken together, these dynamics broaden geographic premium diversity and reduce reliance on legacy Western European strongholds.
Regulatory Landscape
European insurtech operations sit under a layered rule set spanning Solvency II supervision by national competent authorities (for example, BaFin in Germany), conduct requirements under the Insurance Distribution Directive (IDD), and horizontal digital rules. A key near-term anchor is Regulation (EU) 2024/1689 (EU AI Act), which brings high-risk obligations to certain insurance AI uses, including pricing in life and health. This raises the bar for audit trails, explainability, and model-risk governance across underwriting and claims automation.
Supervisory focus on digital resilience and conduct is also tightening. EIOPA set union-wide strategic supervisory priorities for 2026 that emphasize DORA implementation and sustainability risks, alongside themes such as fair claims management. EIOPA continues to scrutinize how IDD applies to digital and platform-based distribution. Groups such as Insurance Europe have called for simplification via a Digital Omnibus approach to reduce overlap across the AI Act, DORA, and GDPR, and to clarify compliance expectations for embedded insurance models.
Value Chain Analysis
Europe insurtech value creation increasingly splits into specialized roles: customer acquisition and distribution (digital brokers, comparison and embedded platforms), product manufacturing (carriers and MGAs using fronting and reinsurance), and enabling technology (pricing, fraud, claims automation, KYC/IDV, and reg-tech). The study scope includes both full-stack digital carriers and firms focused on distribution and software, reflecting a shift toward asset-light models where MGAs and intermediaries lean on incumbent balance sheets while owning the digital customer journey and data pipelines.
Regulation and capital intensity are also shaping how risk is carried and where margin accrues. In Germany, insurtechs returning BaFin carrier licenses to pivot toward platform or intermediary models illustrate this direction, with portfolios and underwriting capacity moving further toward traditional insurers while insurtechs provide digital distribution, policy administration, and analytics. At the same time, regulatory uncertainty around platform and embedded distribution under IDD increases the importance of compliance tooling and standardized disclosures, pushing reg-tech, governance, and auditability to become upstream inputs rather than back-office add-ons.
Competitive Landscape
Europe’s insurtech arena remains moderately fragmented; the five largest underwriters capture roughly 35% of written premium, leaving ample room for niche specialists and new MGAs to scale. Competitive differentiation now centers on data-engineering sophistication and AI governance, because the forthcoming EU AI Act demands audit trails that smaller firms often struggle to fund. Consequently, technology-forward incumbents are purchasing explainability toolkits or partnering with reg-tech vendors to preserve speed without tripping compliance alarms. Embedded-insurance orchestrators leverage single-API integrations to secure merchant partnerships at sub-EUR-10 acquisition costs, tightening pressure on traditional brokers. Meanwhile, reinsurers deepen venture arms to secure early access to climate-risk and longevity datasets that improve facultative pricing.
wefox continues to scale broker-enablement software across DACH markets, while Alan focuses on pan-European digital health plans that bundle telemedicine and AI symptom checks. Lemonade entered Germany with renters and contents covers running on behavioural-economics-driven claims flows that approve many payouts in under a minute. Allianz, Munich Re, and Swiss Re invest heavily in computer-vision partners such as Tractable to automate motor and property damage appraisal, shaving claim-cycle times by up to 40%. Several incumbents also back parametric start-ups like Descartes Underwriting to hedge catastrophe exposure and meet rising corporate demand for rapid-payout triggers. These collaborations illustrate a growing symbiosis in which legacy carriers provide balance-sheet strength while tech players supply data pipelines and rapid-iteration culture.
Funding discipline tightened after the 2021 boom; late-stage rounds close only when pathway to underwriting profitability is clear, and investors insist on AI-audit readiness as a due-diligence checkbox. Midsize insurers now hunt for tuck-in acquisitions that deliver proven embedded pipelines rather than pure software IP, reflecting a pivot toward revenue accretion over speculative tech bets. Simultaneously, MGAs with multi-country regulatory passports assume more balance-sheet risk through fronting-carrier partnerships, aiming to capture extra economics and raise enterprise value ahead of an IPO window projected for 2027–2028. Cybersecurity readiness has become another competitive wedge, with firms advertising zero-trust architectures to reassure corporate buyers wary of vendor breaches. Overall, the race is shifting from pure customer-acquisition velocity to holistic mastery of data governance, capital efficiency, and cross-border compliance—factors likely to decide long-term winners in the Europe insurtech market.
Europe Insurtech Industry Leaders
-
Wefox
-
Alan
-
Zego
-
Lemonade
-
Getsafe
- *Disclaimer: Major Players sorted in no particular order

Market Opportunities and Future Outlook
Open-insurance and standardized data access create whitespace for cross-border scaling and new distribution bundles, particularly where embedded models already show lower acquisition costs. The EU Financial Data Access framework coming into force in 2027 provides a clear policy anchor for standardized APIs, supporting multi-carrier comparison, orchestrated underwriting, and partner-led distribution inside retail, mobility, and banking apps. Industry bodies such as Insurance Europe are also pushing for a Digital Omnibus to rationalize overlapping digital requirements (AI Act, DORA, and GDPR), and simplification would directly benefit firms operating multi-country platforms with consistent control frameworks.
Compliance-ready AI and claims automation remain a monetizable capability gap under the EU AI Act high-risk obligations, favoring vendors and carriers with strong model governance and documentation. Operational impact is already visible in digital health and service models that shorten turnaround times, for example Alan reporting AI-driven triage reducing claim processing from multiple days to hours, alongside market shifts toward asset-light scaling, for example wefox emphasizing an MGA and smart distribution strategy. Product and channel opportunities also broaden as climate and cyber exposures increase demand for faster-payout or low-touch covers, strengthening the case for parametric triggers, automated claims workflows, and embedded add-ons sold contextually across SMEs and retail buyers.
Recent Industry Developments
- July 2026: Genki acquires Wave Claims and Claim OS to bring AI claims technology in-house. Genki's move reflects ongoing consolidation among European insurtech firms and extends AI-based claims capabilities. Integrating Wave Claims and Claim OS strengthens Genki's tech stack and in-house claims handling, with potential cross-sell opportunities with partner carriers.
- July 2026: Roadzen signs definitive agreement to acquire a leading European MGA focused on short-term car rental insurance. The acquisition expands embedded and short-term car rental insurance distribution. It adds scale in short-term auto policies and deepens MGA capabilities and distribution reach.
- June 2026: Belfius Insurance signs agreement to acquire Leocare (French insurtech) to advance European digital insurance ambitions. The deal is positioned to support cross-border digital insurance expansion in Europe. It strengthens Belfius's digital platform and distribution and accelerates European market-entry plans.
Research Methodology Framework and Report Scope
Market Definition and Coverage
For this methodology, the Europe insurtech market is treated as the value generated from insurance products and related enabling services sold or executed through digital-first models across European countries, including distribution, underwriting, and claims workflows.
Scope exclusions: We exclude non-insurance fintech revenue, pure IT outsourcing that is not insurance-specific, and reinsurance-only activity that is not tied to the insurtech operating model.
Segmentation Overview
- By Product Line (Insurance Type)
- Life Insurance
- Health Insurance
- Property & Casualty (Motor, Home, Commercial, Liability)
- Specialty Lines (Cyber, Pet, Marine, Travel)
- By Distribution Channel
- Direct-to-Consumer (Digital)
- Aggregators / Marketplaces
- Digital Brokers / MGAs
- Embedded Insurance Platforms
- Traditional Agents / Brokers (digitally enabled)
- Bancassurance (digitally enabled)
- Other Channels
- By End User
- Retail / Individual
- SME / Commercial
- Large Enterprise / Corporate
- Government / Public Sector
- By Region
- United Kingdom
- Germany
- France
- Spain
- Italy
- BENELUX (Belgium, Netherlands, and Luxembourg)
- NORDICS (Denmark, Finland, Iceland, Norway, and Sweden)
- Rest of Europe
Data Sources, Market Sizing, and Validation
Desk Research
Desk research set the starting boundaries for what should be counted as insurtech activity in Europe, and it also helped us map how premiums and policy volumes move by line of business. We relied on official statistics and supervisory publications to understand reported premium pools, claim patterns, and adoption of digital distribution across key countries.
Public sources used were typically from bodies such as EIOPA, Eurostat, national regulators, and central banks, along with industry sources such as Insurance Europe and published filings from listed insurers and brokers. To cross-check company footprints and activity levels, we also used annual reports, investor presentations, and reputable business press. In addition, we referenced paid subscriptions for company financials and intelligence, patent databases, and news and financials to confirm timelines, product focus, and partnerships. These are illustrative examples, and many other public and paid sources were also used for data collection, validation, and clarification.
Primary Interviews and Surveys
Primary work was used to sanity check what part of insurance value is truly being driven through insurtech models in Europe, and where digital distribution is still mainly functioning as lead generation. We spoke with a mix of carriers, digital brokers and aggregators, enabling software providers, and investors, then validated adoption assumptions using country-level viewpoints across major European markets so gaps from desk research could be addressed in a practical way.
Distribution of primary research fieldwork respondents
| Company type | Respondent position |
|---|---|
| Top tier: 28% | CXOs: 16% |
| Mid tier: 54% | Functional/Unit leaders: 26% |
| Smaller Players: 18% | Managers: 58% |
Market-Sizing & Forecasting
The core sizing logic uses a top-down build where reported European insurance premium pools are reconstructed by major lines and countries, then adjusted by digital distribution penetration and insurtech operating intensity to reach the addressable value counted in this market. Those results are then corroborated with selective bottom-up approximations, such as sampled premium and fee run-rates from digital brokers, channel checks on aggregator volumes, and implied revenue capacity from enabling platforms, which helps us correct over-counting where the same premium can be touched by multiple intermediaries.
Inputs that mattered in the model included gross written premium trends by line, online and mobile share of new business, policy and customer growth at digital-first distributors, claims frequency shifts tied to climate and cyber exposure, and observable funding and partnership activity that signals scaling readiness. For the forecast, scenario analysis was applied around adoption speed, pricing cycle impacts on premium growth, and regulatory friction, then the final path was aligned with what interviewees viewed as realistic for the next five years. Where bottom-up observations were missing in smaller countries, we used proxy adoption rates from similar markets and then reduced them through expert feedback before finalizing totals.
Data Validation & Update Cycle
Validation was done through cross-checks between model outputs and independent signals, such as published premium pools, distribution mix shifts, and company-reported growth indicators, so the totals stay anchored to measurable demand. Outliers were reviewed country by country, and when a variance could not be explained through mix change, an assumption was revisited and, when needed, respondents were re-contacted for a quick re-check.
Before sign-off, a second analyst reviews the calculation steps, key inputs, and year-over-year movements so mechanical errors and double counting risks are caught early. Reports are refreshed annually, and interim updates are made when material events occur, such as major regulation changes or unusually large funding and consolidation activity. Right before delivery, we perform a fresh pass on key inputs so clients receive the most current view available at that time.
Mordor Intelligence's Europe Insurtech Market Sizing Compared With Other Published Estimates
Published market sizes for Europe insurtech often vary because different authors count different value pools, and they also apply different timing, currency, and adoption assumptions. The table makes that spread easy to see, and it is usually driven by how much of the underlying insurance premium base is treated as digitally enabled rather than purely technology spend.
The table shows a higher baseline than some narrower figures because, in Mordor Intelligence's model, the value aligns to insurance market value influenced by insurtech operating models across key product lines, rather than limiting the count to software vendor revenue or venture funding proxies. Other estimates also diverge when they use aggressive adoption curves, mix euros and dollars using different conversion years, or do not run checks for double counting across aggregators, brokers, and carrier direct channels.
Benchmark comparison
| Source | Market Size | Gaps in Research Methodology |
|---|---|---|
| Mordor Intelligence | USD 285.60 B (2025) | |
| Industry Association A | USD 26.50 B (2025) | Often treats the market as insurance technology supplier revenue and service fees, which excludes most premium value even when sales and servicing are digitally executed. |
| Trade Journal B | USD 120.00 B (2024) | Typically uses a narrower definition based on online new business premiums in selected countries only, which can understate multi-country platforms and non-life specialty lines that scale digitally. |
Overall, the differences come down to what is being counted, whether it is premium value, distributor revenue, or only tech spend, and how adoption is projected forward. Our approach stays repeatable because it starts from visible insurance value pools, applies clearly stated digital and operating intensity assumptions, and then pressure-tests results with channel checks and expert feedback before the final number is published.
Key Questions Answered in the Report
How large will the European insurtech market be in 2031?
It is projected to reach USD 399.13 billion.
Which product segment is expanding fastest?
Specialty lines such as cyber, pet, and marine policies grow at a 7.34% CAGR.
What makes embedded insurance appealing to merchants?
It embeds cover at checkout, cuts acquisition cost to under EUR 10, and lifts conversion rates.
Which country currently holds the biggest share of premium?
The United Kingdom leads with 17.12% of the total written premium.
What regulation will standardize insurance data APIs?
The EU Financial Data Access framework, effective 2027, mandates open-insurance interfaces.
How does generative AI benefit underwriting?
It produces quote-ready risk scores in minutes and reduces loss-adjustment expenses by several percentage points.