Europe Indoor LED Lighting Market Size and Share
Market Overview
| Study Period | 2020 - 2031 |
|---|---|
| Forecast Data Period | 2026 - 2031 |
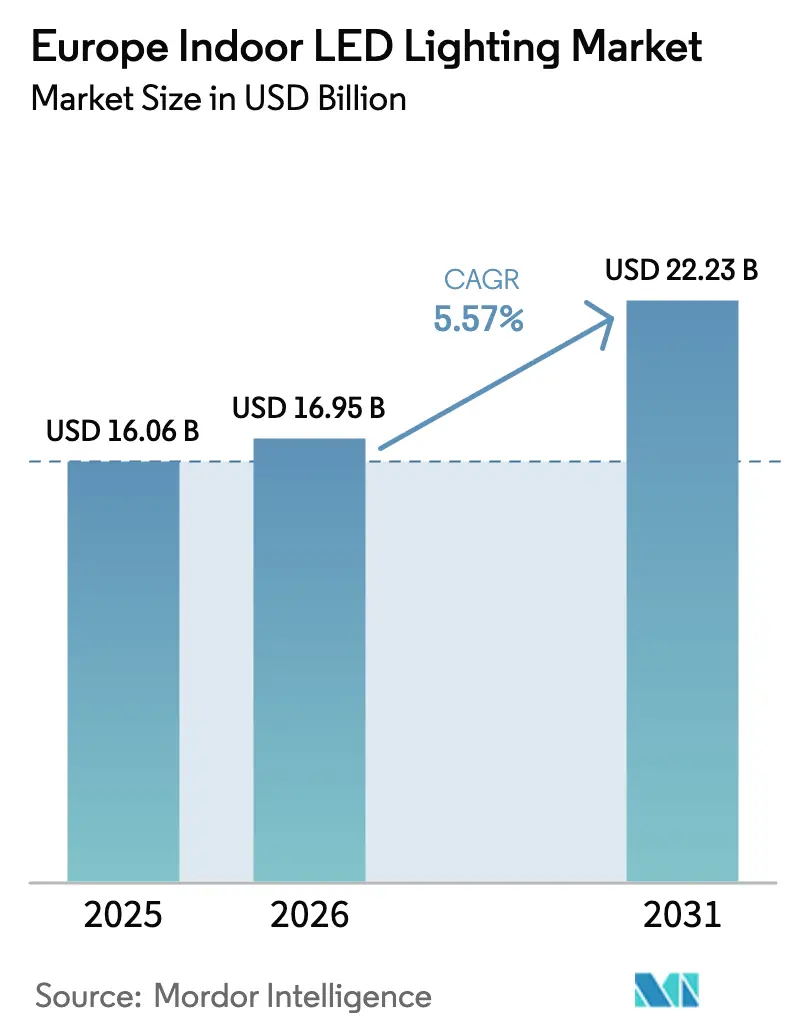
| Base Year Market Size (2025) | USD 16.06 Billion |
| Market Size (2026) | USD 16.95 Billion |
| Market Size (2031) | USD 22.23 Billion |
| Growth Rate (2026 - 2031) | 5.57% CAGR |
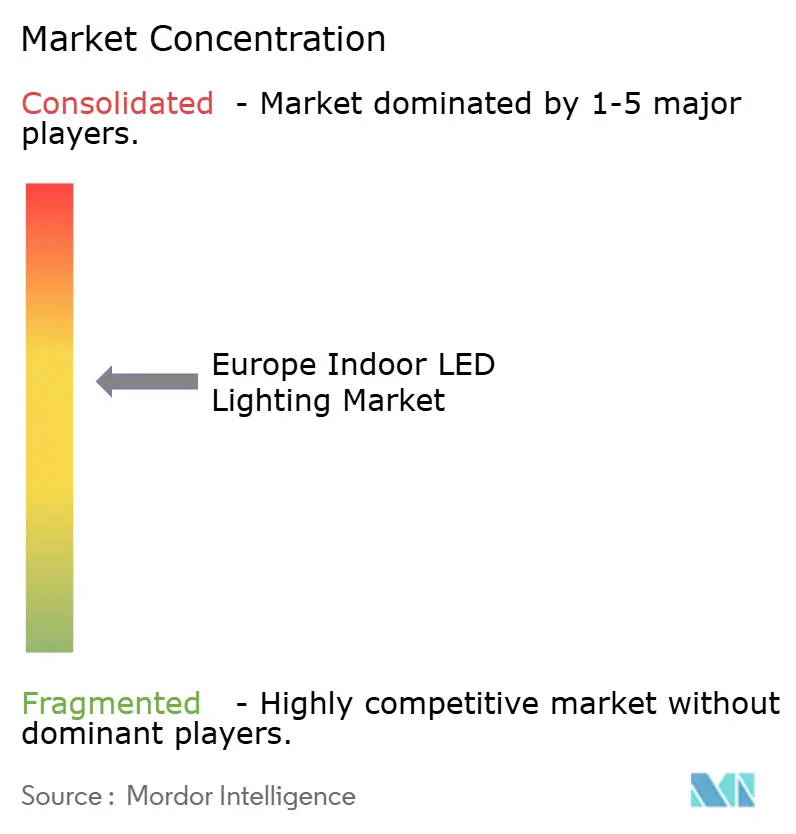
| Market Concentration | Medium |
Major Players *Disclaimer: Major Players sorted in no particular order Image © Mordor Intelligence. Reuse requires attribution under CC BY 4.0. | |
Europe Indoor LED Lighting Market Analysis by Mordor Intelligence
Europe indoor LED lighting market size in 2026 is estimated at USD 16.95 billion, growing from 2025 value of USD 16.06 billion with 2031 projections showing USD 22.23 billion, growing at 5.57% CAGR over 2026-2031. Market gains stem from a decisive shift toward low-energy technologies, mandatory phase-outs of fluorescent lamps, and rapid cost declines in solid-state components. Tightening EU eco-design rules accelerate volume growth, while corporate net-zero targets and green-building certificates turn high-efficiency lighting into a compliance-driven purchase. Vendor differentiation now pivots on controls, data integration, and ease of retrofit rather than pure lumen output, and distribution channels are adapting as e-commerce scales. Supply-chain resilience and installer skill development remain gating factors; however, demand remains supported by Renovation-Wave funding, the widening residential adoption of smart-home ecosystems, and the rising appeal of human-centric lighting.
Key Report Takeaways
- By product type, luminaires and fixtures represented 59.48% of the Europe indoor LED lighting market share in 2025, while Lamps record a 7.10% CAGR to 2031.
- By application, the residential segment captured 40.88% of the Europe indoor LED lighting market size in 2025 and is growing at an 7.85% CAGR through 2031.
- By installation, retrofit projects accounted for 74.12% of the Europe indoor LED lighting market size in 2025, while new installations record a 6.72% CAGR to 2031.
- By distribution channel, wholesale retail held 52.90% of the Europe indoor LED lighting market share in 2025; e-commerce is advancing at a 6.65% CAGR.
- By country, Germany commanded 32.35% of the Europe indoor LED lighting market size in 2025, whereas the United Kingdom registers the quickest 6.95% CAGR through 2031.
Note: Market size and forecast figures in this report are generated using Mordor Intelligence’s proprietary estimation framework, updated with the latest available data and insights as of 2026.
Europe Indoor LED Lighting Market Trends and Insights
Drivers Impact Analysis*
| Driver | (~) % Impact on CAGR Forecast | Geographic Relevance | Impact Timeline |
|---|---|---|---|
| Accelerated phase-out of fluorescent lamps (EU RoHS) | +1.2% | EU-wide, strongest in Germany, France, Netherlands | Short term (≤ 2 years) |
| Renovation-Wave funding for net-zero buildings | +0.8% | Core EU, concentrated in Northern Europe | Medium term (2-4 years) |
| Corporate ESG mandates driving connected-lighting retrofits | +0.7% | EU leadership, strong in UK, Germany | Medium term (2-4 years) |
| CAPEX shift to human-centric and circadian-tuned lighting | +0.5% | Northern Europe, expanding to Central Europe | Long term (≥ 4 years) |
| Cost-down of LED drivers and optics via SiC/GaN power ICs | +0.4% | Global impact, manufacturing anchored in Germany | Medium term (2-4 years) |
| Demand for data-rich lighting (indoor positioning, asset tracking) | +0.3% | Commercial hubs—London, Frankfurt, Amsterdam | Long term (≥ 4 years) |
| Source: Mordor Intelligence | |||


Accelerated Phase-Out of Fluorescent Lamps (EU RoHS)
The EU-wide withdrawal of T8, T5, and compact fluorescent lamps forces building owners to convert an estimated 500 million fixtures, creating a captive replacement cycle that drives up volumes of luminaires, lamps, and control gear in tandem.[1]BMW Group, “BMW Munich Plant Completes Comprehensive LED Lighting Retrofit,” bmwgroup.com Installation projects frequently bundle sensor upgrades and emergency-lighting compliance checks, raising average retrofit values and rewarding suppliers with turnkey solutions and robust contractor support networks.
Renovation-Wave Funding for Net-Zero Buildings
The European Commission’s EUR 150 billion Renovation Wave steers subsidies toward deep-energy refurbishments, and lighting can claim 15-20% of eligible spend. Low-interest loans and direct grants reduce the payback periods for advanced LED systems, thereby spurring demand for connected fixtures that interface with building energy dashboards. Northern Europe benefits most as national programs align with EU capital flows, yielding LED penetration rates approaching 80% in Sweden and Denmark.
Corporate ESG Mandates Driving Connected-Lighting Retrofits
Listed companies now quantify Scope 2 emissions under the EU Taxonomy, elevating lighting from an operational choice to a disclosure requirement. Large retailers, such as Marks & Spencer, have committed to a full LED conversion across 1,400 stores, integrating occupancy and daylight sensors to reduce their lighting energy use by half. Suppliers offering single-vendor IoT ecosystems gain an advantage as facility teams seek simplified data capture for annual sustainability reporting.
CAPEX Shift to Human-Centric and Circadian-Tuned Lighting
Hospitals and offices increasingly value biologically attuned light that tracks natural rhythms. University Hospital Cologne’s 2024 deployment across 200 rooms improved sleep quality and patient recovery metrics, validating clinical value. Component cost declines of 35% since 2022 now permit mid-tier adoption, while premium pricing protects manufacturer margins and favors dealers with specialist installation expertise.
Restraints Impact Analysis*
| Restraint | (~) % Impact on CAGR Forecast | Geographic Relevance | Impact Timeline |
|---|---|---|---|
| Supply-Chain Price Shocks for Rare-Earth Phosphors | -0.6% | Global impact, EU manufacturing concentrated in Germany | Short term (≤ 2 years) |
| Installers' Skills Gap for PoE / Wireless Controls | -0.4% | EU-wide, acute in Eastern European markets | Medium term (2-4 years) |
| Up-Front CAPEX Hurdle in SME Retrofits Despite Incentives | -0.3% | EU-wide, strongest in Southern and Eastern Europe | Medium term (2-4 years) |
| IoT-Security and Data-Privacy Compliance Burdens (GDPR) | -0.2% | EU-wide, complex compliance in multi-tenant buildings | Long term (≥ 4 years) |
| Source: Mordor Intelligence | |||
Supply-Chain Price Shocks for Rare-Earth Phosphors
A 40% price spike for europium in 2024 tightened LED phosphor margins, as Chinese export curbs exposed Europe’s raw-material dependency.[2]European Commission, “Critical Raw Materials Act Implementation,” ec.europa.eu Phosphors account for up to 12% of chip costs, and color-critical applications are the first to feel the pinch. Quantum-dot and perovskite substitutes remain three to five years from scale, sustaining near-term vulnerability for premium fixture lines.
Installers’ Skills Gap for PoE / Wireless Controls
Networked systems demand electricians who are versed in IT protocols, yet 60% of European contractors lack Power-over-Ethernet competency, according to a 2024 European Parliament study. Certification programs trail market growth, particularly in Eastern Europe, which constrains connected-lighting rollouts and prompts vendors to develop plug-and-play kits or proprietary training academies.
*Our forecasts treat driver/restraint impacts as directional, not additive. The impact forecasts reflect baseline growth, mix effects, and variable interactions.
Segment Analysis
By Product Type: Luminaires Maintain Value Leadership
Luminaires captured 59.48% of 2025 revenue thanks to higher unit pricing and mandatory fixture swaps in many retrofit scenarios. Europe indoor LED lighting market size for luminaires is set to expand from USD 9.55 billion in 2025 to USD 13.05 billion by 2031. Architectural models with embedded sensors raise average selling prices and support differentiation. LEDVANCE’s frameless ceiling panels exemplify this premium trend, retailing 40% above basic troffers while cutting installation time.
The lamps segment, although smaller, is projected to grow at a 7.10% CAGR through 2031, driven by bans on fluorescent bulbs, which are prompting bulk replacements. Plug-and-play smart tubes now integrate dimming and occupancy sensing, blurring the lines between categories. Upfront cost advantages appeal to facility managers, who are delaying deeper renovations, but the revenue share is forecast to plateau once replacement peaks in 2026. Vendors with broad lamp portfolios and logistics agility are best positioned to harvest this time-sensitive demand.


By Application: Residential Leads Adoption Velocity
Residential use already accounts for 40.88% of 2025 sales. The Europe indoor LED lighting market share in homes is expected to increase as smart-speaker ecosystems become more prevalent, enabling voice-based lighting control, and as younger homeowners prioritize energy rating upgrades. Falling entry prices and DIY-friendly kits shorten adoption cycles. Connected bulbs and flexible strip lights dominate early purchases, later segueing into whole-room fixture upgrades that bolster ticket size.
Commercial offices and retail maintain significant volumes, but growth splits by specialization. Offices prioritize wellness and space-utilization data, while retail focuses on color-tunable spotlights that influence shopper dwell time. Healthcare facilities, spurred by the demonstrated benefits of circadian rhythms, are trialing tunable systems at the ward level. Industrial buyers tend to favor high-bay luminaires equipped with predictive-maintenance sensors that alert to temperature anomalies before costly downtime occurs.
By Installation Type: Retrofit Dominates but New Construction Gains Pace
Retrofit projects generated 74.12% of the 2025 demand, as three-quarters of Europe’s building stock predates the commercialization of LED. Complex rewiring and control-system additions inflate project values, supporting contractor margins despite falling component costs. Retrofit-optimized kits featuring quick-connect wiring and universal mounting brackets reduce labor hours and attract smaller installers.
New construction, though only a quarter of current revenue, advances at 6.72% CAGR as post-pandemic commercial builds resume and green codes tighten. Specifiers now embed sensors, wireless gateways, and emergency-lighting diagnostics upfront, marginally raising capex but future-proofing assets. Manufacturers that align design tools with BIM workflows and offer cradle-to-grave digital twins gain specification preference.

By Distribution Channel: E-Commerce Challenges Wholesale Dominance
Wholesale retail still accounts for 52.90% of 2025 turnover, leveraging credit terms, local stock, and technical advice. Yet Europe indoor LED lighting market share flowing through e-commerce platforms is rising quickly, aided by transparent pricing and convenient configurators. The channel appeals to small contractors and tech-savvy facility managers, especially for repeat purchases of lamps, drivers, and sensors.
Manufacturers hedge by launching direct stores while continuing to reward distributors with project rebates and value-added services. Signify’s 2024 online portal enables tailored quotations and remote commissioning support, illustrating hybrid strategies that protect partner loyalty while capturing digital margin.
Geography Analysis
Germany’s leadership rests on large-scale industrial retrofits and stringent energy policies that reward high-efficiency fixtures. Automotive hubs in Bavaria and Baden-Württemberg adopted connected high-bay luminaires early, and state-bank incentives under KfW multiplied project pipelines. Domestic brands enjoy proximity advantages and align product certifications with local standards, capturing premium price points while exporting to neighboring markets.
The United Kingdom is the clear growth engine. After initial Brexit logistics hurdles, suppliers diversified sourcing and leveraged free-port facilities to streamline imports. Mandatory energy-performance certificates and the path to net-zero public estates by 2030 push public-sector tenders toward smart LED projects with verifiable savings. Office landlords are retrofitting aggressively to meet incoming MEES thresholds that restrict leases for subpar buildings, unlocking steady retrofit spending.
France, Italy, and Spain present mixed but improving prospects. France’s tertiary-sector decree compels larger buildings to reduce energy consumption by 40% before 2030, positioning lighting upgrades as a low-hanging compliance measure. Italy’s Superbonus 110 scheme, although reduced in 2025, continues to subsidize residential energy efficiency projects, keeping home-improvement demand buoyant. Spain’s hospitality rebound fuels decorative and tunable lighting orders as hotels refresh interiors for post-pandemic tourism.
Nordic countries, already near saturation for basic LED, allocate budgets to advanced analytics, daylight-responsive dimming, and circular-design fixtures that simplify end-of-life recycling. Eastern European uptake remains price-sensitive, yet EU cohesion funds and multinational retail expansion are creating footholds for mid-tier connected solutions.
Competitive Landscape
The Europe indoor LED lighting market exhibits moderate concentration. The top five players-Signify, ams-OSRAM, Zumtobel, Trilux, and LEDVANCE-collectively hold roughly 55% of the revenue, leveraging their breadth of R&D, patent portfolios, and pan-European distribution. Their strategies emphasize software platforms, acquisition of niche specialists, and service contracts that transform one-off sales into recurring revenue.
Emerging challengers pursue niche applications, such as horticulture, UV-C disinfection, or LiFi communications, where incumbents possess less entrenched brand equity. Partnerships with IoT providers and cloud analytics firms are becoming commonplace as vendors bundle dashboards, APIs, and cybersecurity modules to comply with the GDPR.
Consolidation continues: Trilux acquired Ansorg in 2024 to combine industrial and architectural expertise, while Zumtobel secured EIB funding to scale circular-economy production and reach new customer segments.[4]European Investment Bank, “EIB Provides EUR 50 Million to Zumtobel for Sustainable Lighting Solutions,” eib.org Channel power is also shifting; wholesalers still dominate project supply, yet manufacturers are increasingly selling directly for retrofit kits and spare parts, which is pressuring distributor margins.
Brand loyalty now hinges on installer support, commissioning tools, and warranty responsiveness rather than lumens per watt. Vendors invest in online training and augmented-reality guidance to narrow the skills gap among installers, particularly for PoE and wireless mesh setups. Sustainability credentials, including the use of recycled aluminum and take-back schemes, further differentiate leading brands as procurement teams incorporate life-cycle assessments into their tenders.
Europe Indoor LED Lighting Industry Leaders
Signify N.V.
ams-OSRAM AG
Zumtobel Group AG
Acuity Brands, Inc.
Eaton Corporation plc
- *Disclaimer: Major Players sorted in no particular order

Recent Industry Developments
- September 2025: Glamox AS has secured a major contract to provide smart lighting systems for offshore grid connection platforms, expanding its presence in renewable energy infrastructure projects across Europe. The Norwegian manufacturer’s smart LED lighting solutions include advanced control systems and marine-rated luminaires designed for harsh offshore environments, positioning the company in the growing offshore-wind sector.
- September 2025: Panasonic Corporation has announced the launch of its Paluck LED Bulb Clear Series, featuring six SKUs that utilize proprietary light-guide lens technology and a single-point emission design. The products target decorative indoor applications and offer approximately 40,000-hour rated lifetime, expanding Panasonic’s presence in premium residential LED segments.
- July 2025: Hubbell Incorporated reported second-quarter 2025 results with diluted EPS of USD 4.56 and net-sales growth of 2% year over year, reflecting steady performance in its lighting and electrical-solutions portfolio. The company’s transition to FIFO inventory accounting, combined with a 22.7% operating margin, demonstrates operational efficiency improvements across its European operations.
- June 2025: Philips Hue expanded its smart lighting portfolio with the launch of the Play Wall Washer and enhanced AI lighting assistant capabilities, targeting residential and commercial applications with advanced automation features. The product launch strengthens Signify’s position in the connected-lighting segment, the fastest-growing category in indoor LED applications.


Europe Indoor LED Lighting Market Report Scope
Agricultural Lighting, Commercial, Industrial and Warehouse, Residential are covered as segments by Indoor Lighting. France, Germany, United Kingdom are covered as segments by Country.| Lamps |
| Luminaires/Fixtures |
| Residential |
| Commercial Offices |
| Retail Stores |
| Hospitality |
| Industrial Facilities |
| Healthcare and Education |
| Other Applications |
| New Installation |
| Retrofit Installation |
| Direct Sales |
| Wholesale Retail |
| E-commerce |
| Germany |
| United Kingdom |
| France |
| Italy |
| Spain |
| Netherlands |
| Sweden |
| Norway |
| Denmark |
| Finland |
| Belgium |
| Austria |
| Switzerland |
| Poland |
| Czech Republic |
| Rest of Europe |
| By Product Type | Lamps |
| Luminaires/Fixtures | |
| By Application | Residential |
| Commercial Offices | |
| Retail Stores | |
| Hospitality | |
| Industrial Facilities | |
| Healthcare and Education | |
| Other Applications | |
| By Installation Type | New Installation |
| Retrofit Installation | |
| By Distribution Channel | Direct Sales |
| Wholesale Retail | |
| E-commerce | |
| By Country | Germany |
| United Kingdom | |
| France | |
| Italy | |
| Spain | |
| Netherlands | |
| Sweden | |
| Norway | |
| Denmark | |
| Finland | |
| Belgium | |
| Austria | |
| Switzerland | |
| Poland | |
| Czech Republic | |
| Rest of Europe |


Market Definition
- INDOOR LIGHTING - It incorporates all LED based lamps and fixtures/luminaire that are used to illuminate indoor section of residential, commercial, industrial buildings and agricultural lighting. LED offers efficient brightness with higher durability in comparison to other lighting technology.
- OUTDOOR LIGHTING - It incorporates the LED lighting fixtures that is used for illumination for exterior/outdoor illumination. For instance, LED lighting fixtures used to illuminate streets and highways, transport hubs, stadiums and other public places such as parking spaces.
- AUTOMOTIVE LIGHTING - It refers to the lighting fixtures installed for illumination and signaling purposes. It is used in both exterior and interior lighting of the vehicle. Headlamps, fog lamp, daytime running light (DRLs) are examples of exterior light whereas cabin light are interior lights.
- END USER - It refers to the end use application area where the LED fixture will be installed. For instance, in terms of indoor lighting, we have residential, commercial and industrial as end user category. For automotive lighting, primary end user considered are automotive manufacturers and aftermarket sale
| Keyword | Definition |
|---|---|
| Lumen | Lumen is a unit of luminous flux in the International System of Units that is equal to the amount of light given out through a solid angle by a source of one-candela intensity radiating equally in all directions. |
| Footcandle | A foot-candle (or foot-candle, fc, lm/ft2, or ft-c) is a measurement of light intensity. One foot-candle is defined as enough light to saturate a one-foot square with one lumen of light. |
| Colour Rendering Index (CRI) | Color Rendering Index (CRI) is a measurement of how natural colors render under an artificial white light source when compared with sunlight. The index is measured from 0-100, with a perfect 100 indicating that colors of objects under the light source appear the same as they would under natural sunlight. |
| Luminous flux | Luminous flux is a measure of the power of visible light produced by a light source or light fitting. It is measured in lumens (lm). |
| Annual Energy Cost | Annual Energy Cost means the average daily energy consumption multiplied by 365 (days per year), expressed in kilowatt hour per year (kWh/a). |
| Constant voltage drivers | Constant voltage drivers are designed for a single direct current (DC) output voltage. Most common constant voltage drivers (or Power Supplies) are 12VDC or 24VDC. An LED light that is rated for constant voltage usually specifies the amount of input voltage it needs to operate correctly. |
| Constant Current Driver | Constant current LED drivers are designed for a designated range of output voltages and a fixed output current (mA). LEDs that are rated to operate on a constant current driver require a designated supply of current usually specified in milliamps (mA) or amps (A). These drivers vary the voltage along an electronic circuit which allows current to remain constant throughout the LED system. |
| Minimum Energy Performance Standards (MEPS) | Minimum Energy Performance Standards specify the minimum level of energy performance that appliances and equipment must meet or exceed before they can supply or used for commercial purposes. |
| Luminous Efficacy | Luminous efficacy is a measurement commonly used in the lighting industry that indicates the ability of a light source to emit visible light using a given amount of power. |
| Solid State Lighting | Solid-state lighting (SSL) is a type of lighting that uses semiconductor light-emitting diodes (LEDs), organic light-emitting diodes (OLED), or polymer light-emitting diodes (PLED) as sources of illumination rather than electrical filaments, plasma (used in arc lamps such as fluorescent lamps), or gas. |
| Rated Lamp Life | Lamp life, also referred to as rated life, is the time in hours a lamp will last before a percentage of lamps will burn out. |
| Color Temperature | Colour temperature is a scale that measures how ‘warm’ (yellow) or ‘cool’ (blue) the light from a particular source is. It is measured in degrees of the Kelvin scale (abbreviated to K), and the higher the number, the ‘cooler’ the light. The lower the ‘K’ number, the ‘warmer’ the light. |
| Ingress Protection rating (IP rating) | The IP (Ingress Protection) rating of a bulb or light fixture declares the level of protection it has against dirt and water. |
| Fidelity Index | The general colour fidelity index, Rf, represents how closely the colour appearances of the entire sample set are reproduced (rendered) on average by a test light as compared to those under a reference illuminant. |
| Gamut Index | The gamut area is defined as “the area enclosed by a set of test color samples illuminated by a light source, in a two-dimensional chromaticity diagram or a plane of color space.”1 Within a defined color space, a “gamut” describes the subset of colors that can be perceived under specific lighting conditions. |
| Binning | In the lighting industry, the act of "binning" of LEDs is the process of sorting LEDs by certain characteristics, such as color, voltage, and brightness. |
| Accent lighting | Accent lighting, also called highlighting, emphasizes objects by focusing light directly on them. Accent lighting is used inside and outside the home to feature locations such as an entrance or to create dramatic effects. |
| Dimmable driver | A dimming driver has two functions: As a driver, it converts the 230V AC mains input to a low voltage DC output. As a dimmer, it reduces the amount of electrical energy flowing to the LEDs, thereby causing them to dim. |
| Flicker | Flicker is the repeated and frequent variation in the output of a light source over time. |
| Fluorescent | A property of materials defined as the ability to emit light after absorbing electromagnetic radiation such as visible or UV light. |
| Candela | The candela is the unit of luminous intensity in the International System of Units. It measures the light output per unit solid angle emitted from a light source in a specific direction. |
| LUX | Lux is used to measure the amount of light output in a given area - one lux is equal to one lumen per square meter. It enables us to measure the total "amount" of visible light present and the intensity of the illumination on a surface. |
| Uniformity (U0) | The uniformity of lighting has significant effects on visual performance in both indoor and outdoor areas. Uniformity (represented as U0) value can be found by dividing the minimum brightness (Emin) resulting from calculations according to the current lighting order, to the average brightness value (Eavg). |
| Visible Light Spectrum | The visible light spectrum is the segment of the electromagnetic spectrum that the human eye can view. More simply, this range of wavelengths is called visible light. Typically, the human eye can detect wavelengths from 380 to 700 nanometers. |
| Ambient Temperature | Ambient Temperature is the temperature of the air surrounding an electrical enclosure. |
| Current-controlled dimming control | Current-controlled dimming controls LED brightness by varying the applied current using a 0-10V dimmer. Current-controlled dimming is smooth and HD-video friendly. It can only dim to a minimum of 5% of light output. |
| Design Light Consortium | It is a partnership of energy efficiency stakeholders in the United States and Canada to “promote quality, performance and energy efficient lighting solutions for the commercial sector”. |
| Pulse Width Modulation | Pulse-width modulation, or pulse-duration modulation, is a method of controlling the average power delivered by an electrical signal. |
| Surface Mounted Device | A surface mount device (SMD) is an electronic device whose components are mounted or placed directly on the surface of a printed circuit board. |
| Alternating Current | Alternating current is an electric current which periodically reverses direction and changes its magnitude continuously with time, in contrast to direct current, which flows only in one direction. |
| Direct Current | Direct current (DC) is an electric current that is uni-directional, so the flow of charge is always in the same direction. |
| Beam Angle | Beam angle (also called beam spread) is a measure of how light is distributed. On any plane perpendicular to the centerline of the light, the beam angle is the angle between two rays where the light intensity is 50% of the maximum light intensity. |
| LED Based Solar High Mast Lighting Systems | A Solar LED High Mast Light is a raised source of High illumination lights (6~8 lights) and with high intensity on the middle of major junctions (Ring roads, Outer Ring roads), turned on or lit automatically in the absence of light (at specified timings or at periodic times, every night). |
| Surface Mounted Diode (SMD) LEDs | A surface mount diode is a type that emits light and is flat mounted and soldered onto a circuit board. |
| Chip on Board (COB) LEDs | A COB LED is basically multiple LED chips (usually 9 or more) glued directly onto a substrate by the manufacturer to form a single module. |
| Dual In-Line Package (DIP) LEDs | A dual in-line package (DIP or DIL) is an electronic component package with a rectangular case and two parallel rows of electrical connector pins. |
| Graphene LED Lights | A graphene LED light bulb is simply an LED light bulb where the filament has been coated in graphene. A graphene LED bulb is reported to be 10% more efficient than regular LED light bulbs and they are cheaper to manufacture and buy. |
| LED Corn Bulbs | LED Corn lights are designed as an energy efficient alternative to high intensity discharge (HID) and SON lamps. It uses a large number of LEDs on a metal structure to provide sufficient light. This arrangement of LEDs looks a lot like a corn cob, hence the name "corn light". |
| Per Capita Income | Per capita income or total income measures the average income earned per person in a given area in a specified year. It is calculated by dividing the area's total income by its total population. Per capita income is national income divided by population size. |
| Charging Stations | A charging station, also known as a charging station or electric vehicle utility, is a power supply that provides electrical energy for charging plug-in electric vehicles. |
| Headlight | A headlight is a light that is mounted on the front of a car and illuminates the road in front of it. Low beam and high beam LED headlights are additional categories for these LED headlights. |
| Day Time Running Light (DRLs) | A daytime running lamp is a white, yellow, or amber lighting device mounted on the front of a road-going motor vehicle or bicycle. |
| Directional Signal Light | Directional signal lights are the front and rear lights on an automobile that flash to show the direction of a turn. |
| Stop Light | A red light that is mounted to the back of a car and turns on when the brakes are used to show that the car is stopped. |
| Reverse Light | The reverse light is at the back of the vehicle to indicate its backward motion. |
| Tail Light | A red light that can be seen in the dark is mounted on the rear of a road vehicle. Stop, reverse, and directional signal lights are all part of it. |
| Fog Light | Bright lights in automobiles used to increase visibility on the road in foggy conditions or to warn other drivers of the presence of the vehicle. |
| Passenger Vehicle | A passenger vehicle is a road vehicle, other than a moped or a motorcycle, intended for the transportation of people and designed for up to 8 to 9 seats. |
| Commercial Vehicle | A commercial vehicle (Bus, Truck, Van) is any type of motor vehicle used to transport goods or pay passengers. |
| Two Wheelers (2W) | A two-wheeler is a vehicle that runs on two wheels. |
| Streets & Roadways | Both roads and streets refer to hard, flat surfaces on the ground on which vehicles, people, and animals can travel. Since streetways are usually in cities and towns, they often have houses and buildings on both sides. The roadway is in the countryside and sometimes passes through forests and fields |
| Horticulture Lighting | Horticulture is the science and art of sustainably growing, producing, marketing and using high quality, intensively cultivated food and ornamental plants. |


Research Methodology
Mordor Intelligence has followed the following methodology in all our data center reports.
- Step 1: Raw Data Collection: To understand the market, initially, all crtical data points were identified. Critical information about countries and regions of interest including Per-capita Income, Population, Automotive Production, Interest rate on Auto-Loans, Number of Automobiles on Road, Total LED Import, Lighting Electricity Consumption among others were recorded or estimated based on internal calculations.
- Step 2: Identify Key Variables: To build a robust forecasting model, key variables such as Number of Households, Automotive Production, Road Networks among others were identified. Through an iterative process, the variables required for the market forecast were set, and the model was built using these variables.
- Step 3: Build a Market Model: Based on data and critical industry trend data (variables), including LED pricing, LED penetration rate, and project macro and micor economic factors were utilized for building the market forecasting.
- Step 4: Validate and Finalize: In this crucial step, all market numbers and variables derived through an internal mathematical model were validated through an extensive network of primary research experts from all the markets studied. The respondents are selected across levels and functions to generate a holistic picture of the market studied.
- Step 5: Research Outputs: Syndicated Reports, Custom Consulting Assignments, Databases & Subscription Platforms


