North America Indoor LED Lighting Market Size and Share
Market Overview
| Study Period | 2020 - 2031 |
|---|---|
| Forecast Data Period | 2026 - 2031 |
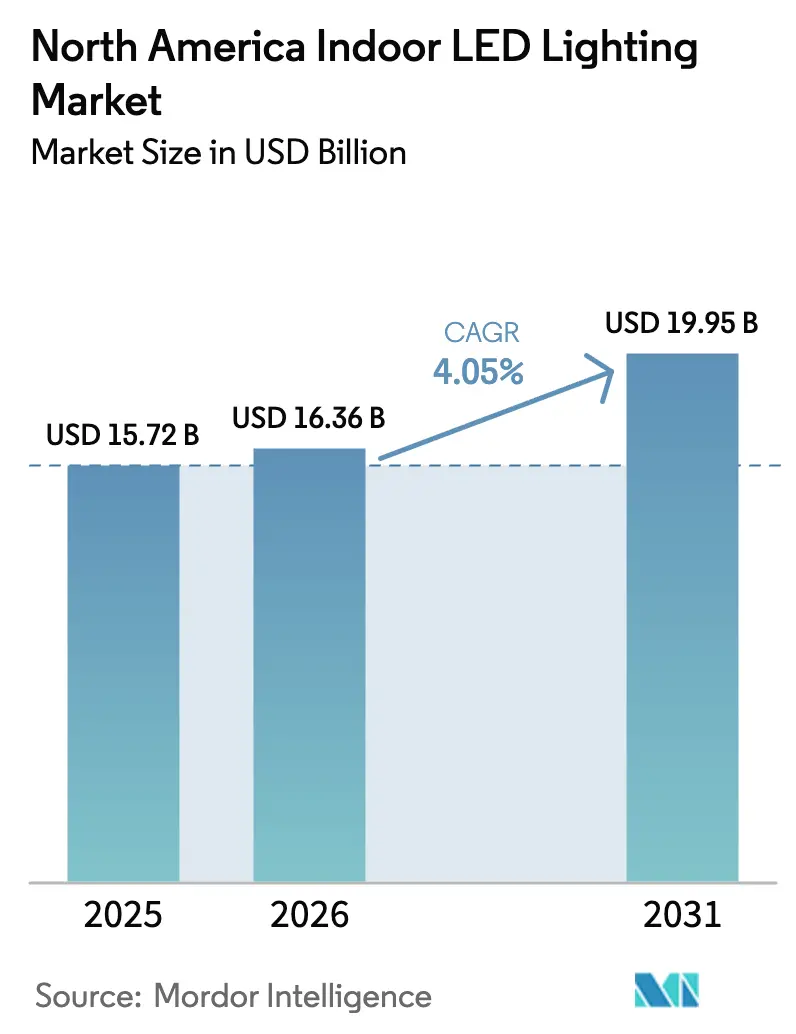
| Base Year Market Size (2025) | USD 15.72 Billion |
| Market Size (2026) | USD 16.36 Billion |
| Market Size (2031) | USD 19.95 Billion |
| Growth Rate (2026 - 2031) | 4.05% CAGR |
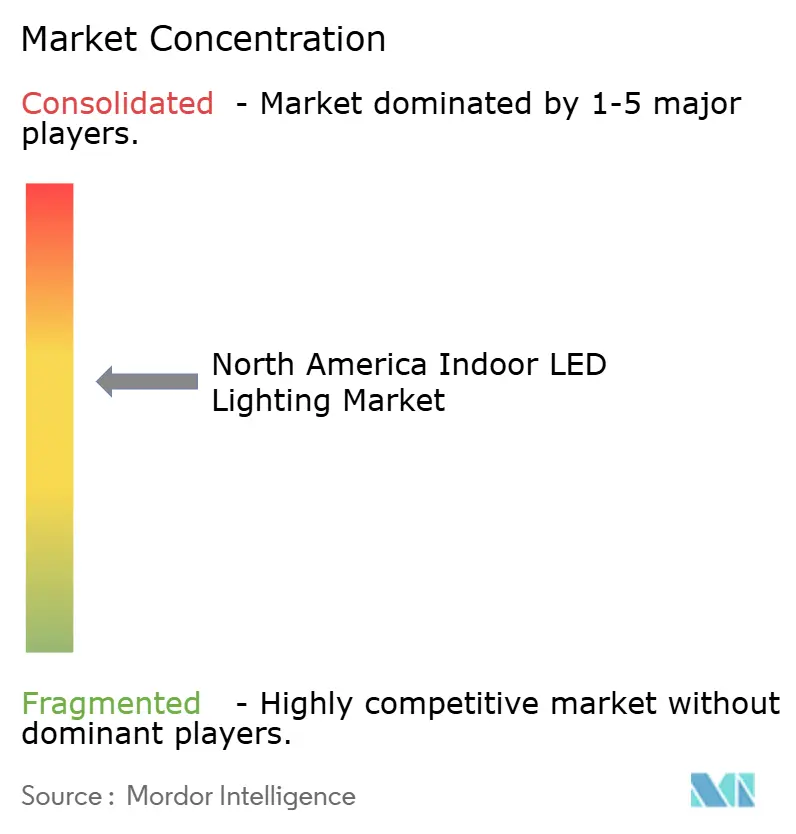
| Market Concentration | Medium |
Major Players *Disclaimer: Major Players sorted in no particular order Image © Mordor Intelligence. Reuse requires attribution under CC BY 4.0. | |
North America Indoor LED Lighting Market Analysis by Mordor Intelligence
The North America indoor LED lighting market size was valued at USD 15.72 billion in 2025 and estimated to grow from USD 16.36 billion in 2026 to reach USD 19.95 billion by 2031, at a CAGR of 4.05% during the forecast period (2026-2031). Regulatory bans on inefficient lamps, corporate net-zero targets, and utility-funded rebates are the primary forces driving the North America indoor LED lighting market on an upward yet moderating growth path. Manufacturers are sharpening their focus on total cost of ownership because building owners are increasingly viewing lighting upgrades through a sustainability lens, rather than purely as a capital expenditure. Supply-side scale economies have driven down LED component prices, reinforcing the competitiveness of the North America indoor LED lighting market even without rebates. Meanwhile, construction recovery signals fresh demand for code-compliant luminaires, while e-commerce unlocks additional residential uptake of connected lighting kits, collectively sustaining momentum despite early-mover gains plateauing.
Key Report Takeaways
- By product type, luminaires led with 61.62% of the North America indoor LED lighting market share in 2025, while lamps recorded the fastest 9.12% CAGR through 2031.
- By application, residential commanded 40.32% share of the North America indoor LED lighting market size in 2025 and is expanding at a 10.43% CAGR through 2031.
- By installation type, retrofit projects accounted for 74.58% share of the North America indoor LED lighting market size in 2025, whereas new installations are posting an 7.86% CAGR to 2031.
- By distribution channel, wholesale retail controlled 55.12% revenue share in 2025, but e-commerce is growing at 7.63% CAGR to 2031.
Note: Market size and forecast figures in this report are generated using Mordor Intelligence’s proprietary estimation framework, updated with the latest available data and insights as of 2026.
North America Indoor LED Lighting Market Trends and Insights
Drivers Impact Analysis*
| Driver | (~) % Impact on CAGR Forecast | Geographic Relevance | Impact Timeline |
|---|---|---|---|
| Energy-efficiency regulations and incandescent/halogen bans | +1.2% | California, Canada, wider North America | Short term (≤ 2 years) |
| Declining LED component prices and higher efficacy | +0.8% | Global cost benefits applied regionally | Medium term (2-4 years) |
| Utility rebate programs for commercial retrofits | +0.6% | Utility territories with DSM programs | Short term (≤ 2 years) |
| Corporate net-zero carbon commitments | +0.9% | Fortune 500 hubs across North America | Medium term (2-4 years) |
| Smart-building and IoT-ready luminaires | +0.7% | U.S. and Canadian urban cores, Mexico emerging | Medium term (2-4 years) |
| Human-centric lighting in workplaces and schools | +0.5% | Commercial and institutional settings | Long term (≥ 4 years) |
| Source: Mordor Intelligence | |||


Energy-Efficiency Regulations and Bans on Incandescent/Halogen Lamps
Federal and state policies now require nearly all new luminaires and lamps to meet an efficacy of≥ 45 lm/W, effectively removing traditional incandescent and halogen options from the market.[1]U.S. Department of Energy, “Solid-State Lighting R&D Plan,” energy.gov California’s Title 24 and Canada’s federal harmonization have turned “LED-first” into a building-code default, ensuring that the North America indoor LED lighting market grows on the back of compliance rather than discretionary upgrades. Codes referencing ASHRAE 90.1 reinforce demand, even in economic downturns, because non-compliant lighting triggers renovation penalties. Manufacturers that pre-certify products for multiple jurisdictions can shorten project timelines, making regulatory complexity a competitive advantage rather than a barrier. As each phase-out milestone arrives, distributors observe run-up buying of remaining legacy stock, followed by a durable step-change toward LED.
Declining LED Component Prices and Improving Luminous Efficacy
Continued semiconductor yield gains enable manufacturers to extract more lumens per wafer, reducing chip counts per fixture and lowering average selling prices. Research on InGaN crystal orientation reveals lower efficiency droop at high current densities, enabling smaller die sizes without compromising output. These technical wins fuel a virtuous cycle: cheaper chips enable broader adoption, which in turn delivers volume leverage to further reduce costs. The North America indoor LED lighting market, therefore, sees the payback period on retrofits fall below two years in many commercial scenarios. In comparison, gallium tightness in 2024 produced spot price spikes, diversified sourcing strategies, and phosphor-free color-conversion films are mitigating similar shocks.
Utility Rebate Programs for Commercial Retrofits
Demand-side management (DSM) budgets enable utilities, such as Duke Energy, to offer up to USD 75 per qualifying fixture, instantly reducing project paybacks for warehouse and office landlords. Con Edison’s schemes reimburse 30–50% of material costs, creating brief but intense retrofit waves that stress contractor labor availability. Rebate tiers increasingly reward controls-ready luminaires, nudging the North America indoor LED lighting market toward networked systems rather than simple one-for-one swaps. Because DSM dollars cost utilities less than new generation capacity, program renewals remain politically palatable even when wholesale power prices soften, anchoring a reliable pipeline of retrofit demand.
Corporate-Level Net-Zero Carbon Commitments
Sustainability pledges from Fortune 500 tenants require facility managers to demonstrate absolute emissions cuts, not merely intensity ratios. LED retrofits coupled with advanced controls deliver immediate Scope 2 savings and therefore feature prominently in decarbonization roadmaps. Signify’s own pledge to be carbon-neutral by 2030 enhances its credibility when advising clients on lifecycle footprint. Procurement teams now request Environmental Product Declarations and recycling take-back guarantees during RFPs, shifting the competition away from the lowest price to the lowest total carbon cost. The North America indoor LED lighting market thus benefits from a strategic, board-level imperative that transcends short-term budget cycles.
Restraints Impact Analysis*
| Restraint | (~) % Impact on CAGR Forecast | Geographic Relevance | Impact Timeline |
|---|---|---|---|
| High upfront capex in large-scale projects | -0.7% | Commercial and industrial facilities | Short term (≤ 2 years) |
| Supply-chain volatility for LEDs and drivers | -0.5% | Global semiconductor flows | Medium term (2-4 years) |
| Complex end-of-life recycling and e-waste rules | -0.3% | Provinces with EPR laws | Long term (≥ 4 years) |
| Dependence on rare-earth phosphors and substrates | -0.4% | Global material markets | Medium term (2-4 years) |
| Source: Mordor Intelligence | |||
High Upfront Capex in Large-Scale Projects
Comprehensive warehouse or campus-wide upgrades can top USD 5 million, pushing approval cycles out 12–18 months even with attractive paybacks. Energy-as-a-Service contracts address this hurdle by shifting costs off balance sheets and tying repayment to verified savings, but CFOs still weigh interest spreads and covenant impacts. Multisite enterprises must harmonize fixture SKUs, controls protocols, and installer training, adding coordination costs that dilute headline payback rates. Consequently, some retrofit programs roll out in phases, elongating revenue realization for vendors in the North America indoor LED lighting market.
Supply-Chain Volatility for LEDs and Electronic Drivers
Samsung’s 2024 exit from commodity LED production shrank the supplier pool, raising concentration risk for chip buyers. Gallium price spikes highlighted exposure to a single critical input, while automotive demand soaked up driver IC capacity, delaying lighting OEM deliveries by up to 16 weeks. Manufacturers with vertically integrated driver lines met schedules more consistently, earning premium positioning. Project planners now carry higher buffer inventory, but that capital tie-up offsets a portion of LED cost-decline benefits within the North America indoor LED lighting industry.
*Our forecasts treat driver/restraint impacts as directional, not additive. The impact forecasts reflect baseline growth, mix effects, and variable interactions.
Segment Analysis
By Product Type: Luminaires Lead Despite Lamp Growth Surge
Luminaires retained a 61.62% share of the North America indoor LED lighting market in 2025, confirming contractors' preference for integrated fixtures that combine optical, thermal, and control elements in one package. Nevertheless, retrofit lamps are expanding at a 9.12% CAGR to 2031, as homeowners replace bulbs one by one without rewiring. The luminaires sub-segment draws strength from smart-building demand, as factory-embedded sensors reduce field labor and simplify commissioning, traits that specifiers reward in bid evaluations. Innovations such as micro-LED grids, highlighted by recent Meta patent filings, promise thinner housings and higher efficacy, providing luminaires with further technical advantages.
Lamp momentum owes much to the sheer installed base of screw-in Edison and pin sockets across North America. Retail promotions and title-24 compliant labeling drive bulk multipack purchases. As lamp efficacy converges with that of fixtures, buyers perceive minimal penalty for staying within familiar form factors. The North America indoor LED lighting market, therefore, balances an innovation-driven luminaire tier with a cost-driven lamp tier, each catering to distinct budget and performance needs.


By Application: Residential Dominance Across Size and Growth
Residential applications delivered 40.32% revenue share for the North America indoor LED lighting market in 2025, while also topping the growth leaderboard at 10.43% CAGR. Voice-assistant integration propels adoption, as consumers now link bulbs to broader smart-home routines covering thermostats and security cameras. Commercial offices follow, as corporate wellness programs adopt tunable white schemes that mimic circadian cycles. Retailers use accent lighting to increase dwell times and basket sizes, whereas hospitals focus on spectral tuning to support patient recovery.
The education and hospitality sectors are pursuing dynamic dimming to enhance concentration and ambiance, respectively, although budget constraints temper the rollout velocity. Industrial facilities remain pragmatic, favoring high-bay retrofits that slash kWh charges rather than advanced RGB or sensor features. In every vertical, the North America indoor LED lighting market gains diversification: no single application now commands an overwhelming share, safeguarding manufacturers against cyclical swings.
By Installation Type: Retrofit Majority Faces New Installation Challenge
Retrofits accounted for 74.58% of spending in 2025, a testament to the enormous base of fluorescent troffers and high-pressure sodium bays still in need of replacement. Energy-as-a-Service contracts speed conversion by funding upgrades from off-balance-sheet operating budgets tied to measured savings. Yet the 7.86% CAGR logged by new-build installations signals a pivot as construction rebounds and codes prescribe LEDs from the blueprint stage. New projects often specify network-ready fixtures, which compresses future upgrade costs but raises design complexity upfront.
Retrofit contractors grapple with the quirks of incumbent wiring, ceiling plenum depths, and sometimes asbestos abatement, all of which extend project timelines. Conversely, new installations enable architects to integrate daylight harvesting and occupancy sensing into core building management systems, thereby raising the functionality expectations across the North America indoor LED lighting market.

By Distribution Channel: Wholesale Retail Dominance Challenged by E-Commerce
Wholesale retail outlets supplied 55.12% of fixtures in 2025, leveraging local inventory and specification support for trade partners. Mergers such as Bell & McCoy’s May 2025 purchase of Smart Lighting Solutions consolidate that advantage by broadening geographic coverage and line card breadth. However, the 7.63% CAGR posted by e-commerce underscores a shift in buyer behavior: homeowners and smaller businesses find doorstep delivery and one-click bundling more convenient than in-person visits to brick-and-mortar stores.
Direct sales to large enterprises involve handling complex, multisite projects that require engineering services and warranty coordination. E-commerce’s weakness remains after-sales technical support for DMX, DALI, or PoE systems; such gaps protect wholesaler relevance in higher-value segments of the North America indoor LED lighting industry.
Geography Analysis
The United States held 33.28% of the North America indoor LED lighting market in 2025, driven by federal infrastructure funds and state mandates such as California’s Title 24 and New York’s Local Law 97. Dense headquarters clusters in New York, Texas, and California specify premium luminaires with sophisticated controls to meet ESG reporting obligations. Supply-chain localization efforts, including Signify’s reduced China component exposure to under 20%, insulate U.S. buyers from tariff or freight shocks.
Canada contributes a steadier, mature demand curve thanks to national standards aligned with U.S. efficiency criteria. Provincial utilities offer generous rebates, yet extended producer responsibility laws in provinces such as New Brunswick increase end-of-life costs that manufacturers must factor into their pricing. These regulations also spur early exploration of circular-economy business models within the North America indoor LED lighting market.
Mexico, which is expected to expand at a 6.54% CAGR through 2031, benefits from the near-shoring of supply chains and industrial modernization. Automotive plants, logistics hubs, and maquiladora sites demand high-bay and task lighting compliant with U.S. OSHA visibility guidelines, creating alignment of product SKUs across borders. Government modernization of hospitals and schools injects additional volume, though bid cycles are longer and financing hurdles higher than northern neighbors.
Competitive Landscape
The North America indoor LED lighting market sits at a moderate consolidation point: the top five manufacturers together command a near-60% share, yet niche entrants flourish in specialized niches such as horticulture and UV-C disinfection. Acuity Brands’ USD 1.215 billion purchase of QSC illustrates a pivot toward integrated “intelligent spaces” that merge lighting with AV and control layers. [4]Acuity Brands, “Acuity Announces Agreement to Acquire QSC, LLC,” acuitybrands.comSignify, having trimmed its workforce by 2,500 in 2024 and reduced debt by EUR 440 million, centers its strategy on connected systems and agriculture lighting platforms.
Samsung’s withdrawal from commodity LED chips leaves players like Nichia, Lumileds, and Cree with greater bargaining leverage over die pricing, intensifying supply chain differentiation battles. Patent wars persist: the PTAB’s March 2025 decision to review Feit’s white-filament patent introduces uncertainty in the decorative filament bulb sub-segment. At the channel level, agency roll-ups such as SESCO’s ELS acquisition build geographic reach to counter online challengers, while vertical integration in driver electronics shields OEMs from IC shortages.
Emergent white-space opportunities include horticulture fixtures that leverage spectrum tunability, as well as human-centric offerings for healthcare and education that combine circadian control with antimicrobial modes. Smaller firms carve footholds through Energy-as-a-Service contracts, compensating for limited manufacturing scale with financing innovation. As rebate programs increasingly tie payouts to verified controls performance, software analytics becomes a new frontier of competition in the North America indoor LED lighting market.
North America Indoor LED Lighting Industry Leaders
Signify N.V.
Acuity Brands, Inc.
Hubbell Incorporated
Eaton Corporation plc (Cooper Lighting Solutions)
ams-OSRAM AG
- *Disclaimer: Major Players sorted in no particular order

Recent Industry Developments
- May 2025: Bell & McCoy acquired Smart Lighting Solutions, extending coverage into the Atlanta specification market.
- March 2025: The U.S. PTAB accepted an inter partes review of Feit Electric’s white-filament LED patent, challenging competitive IP positions.
- January 2025: Signify reported 2024 sales of EUR 6.1 billion (USD 6.4 billion) and announced a EUR 150 million (USD 174.13 million) share repurchase for 2025.


North America Indoor LED Lighting Market Report Scope
Agricultural Lighting, Commercial, Industrial and Warehouse, Residential are covered as segments by Indoor Lighting. United States are covered as segments by Country.| Lamps |
| Luminaires/ Fixtures |
| Residential |
| Commercial Offices |
| Retail Stores |
| Hospitality |
| Industrial Facilities |
| Healthcare and Education |
| Other Applications |
| New Installation |
| Retrofit Installation |
| Direct Sales |
| Wholesale Retail |
| E-commerce |
| United States |
| Canada |
| Mexico |
| By Product Type | Lamps |
| Luminaires/ Fixtures | |
| By Application | Residential |
| Commercial Offices | |
| Retail Stores | |
| Hospitality | |
| Industrial Facilities | |
| Healthcare and Education | |
| Other Applications | |
| By Installation Type | New Installation |
| Retrofit Installation | |
| By Distribution Channel | Direct Sales |
| Wholesale Retail | |
| E-commerce | |
| By Country | United States |
| Canada | |
| Mexico |


Market Definition
- INDOOR LIGHTING - It incorporates all LED based lamps and fixtures/luminaire that are used to illuminate indoor section of residential, commercial, industrial buildings and agricultural lighting. LED offers efficient brightness with higher durability in comparison to other lighting technology.
- OUTDOOR LIGHTING - It incorporates the LED lighting fixtures that is used for illumination for exterior/outdoor illumination. For instance, LED lighting fixtures used to illuminate streets and highways, transport hubs, stadiums and other public places such as parking spaces.
- AUTOMOTIVE LIGHTING - It refers to the lighting fixtures installed for illumination and signaling purposes. It is used in both exterior and interior lighting of the vehicle. Headlamps, fog lamp, daytime running light (DRLs) are examples of exterior light whereas cabin light are interior lights.
- END USER - It refers to the end use application area where the LED fixture will be installed. For instance, in terms of indoor lighting, we have residential, commercial and industrial as end user category. For automotive lighting, primary end user considered are automotive manufacturers and aftermarket sale
| Keyword | Definition |
|---|---|
| Lumen | Lumen is a unit of luminous flux in the International System of Units that is equal to the amount of light given out through a solid angle by a source of one-candela intensity radiating equally in all directions. |
| Footcandle | A foot-candle (or foot-candle, fc, lm/ft2, or ft-c) is a measurement of light intensity. One foot-candle is defined as enough light to saturate a one-foot square with one lumen of light. |
| Colour Rendering Index (CRI) | Color Rendering Index (CRI) is a measurement of how natural colors render under an artificial white light source when compared with sunlight. The index is measured from 0-100, with a perfect 100 indicating that colors of objects under the light source appear the same as they would under natural sunlight. |
| Luminous flux | Luminous flux is a measure of the power of visible light produced by a light source or light fitting. It is measured in lumens (lm). |
| Annual Energy Cost | Annual Energy Cost means the average daily energy consumption multiplied by 365 (days per year), expressed in kilowatt hour per year (kWh/a). |
| Constant voltage drivers | Constant voltage drivers are designed for a single direct current (DC) output voltage. Most common constant voltage drivers (or Power Supplies) are 12VDC or 24VDC. An LED light that is rated for constant voltage usually specifies the amount of input voltage it needs to operate correctly. |
| Constant Current Driver | Constant current LED drivers are designed for a designated range of output voltages and a fixed output current (mA). LEDs that are rated to operate on a constant current driver require a designated supply of current usually specified in milliamps (mA) or amps (A). These drivers vary the voltage along an electronic circuit which allows current to remain constant throughout the LED system. |
| Minimum Energy Performance Standards (MEPS) | Minimum Energy Performance Standards specify the minimum level of energy performance that appliances and equipment must meet or exceed before they can supply or used for commercial purposes. |
| Luminous Efficacy | Luminous efficacy is a measurement commonly used in the lighting industry that indicates the ability of a light source to emit visible light using a given amount of power. |
| Solid State Lighting | Solid-state lighting (SSL) is a type of lighting that uses semiconductor light-emitting diodes (LEDs), organic light-emitting diodes (OLED), or polymer light-emitting diodes (PLED) as sources of illumination rather than electrical filaments, plasma (used in arc lamps such as fluorescent lamps), or gas. |
| Rated Lamp Life | Lamp life, also referred to as rated life, is the time in hours a lamp will last before a percentage of lamps will burn out. |
| Color Temperature | Colour temperature is a scale that measures how ‘warm’ (yellow) or ‘cool’ (blue) the light from a particular source is. It is measured in degrees of the Kelvin scale (abbreviated to K), and the higher the number, the ‘cooler’ the light. The lower the ‘K’ number, the ‘warmer’ the light. |
| Ingress Protection rating (IP rating) | The IP (Ingress Protection) rating of a bulb or light fixture declares the level of protection it has against dirt and water. |
| Fidelity Index | The general colour fidelity index, Rf, represents how closely the colour appearances of the entire sample set are reproduced (rendered) on average by a test light as compared to those under a reference illuminant. |
| Gamut Index | The gamut area is defined as “the area enclosed by a set of test color samples illuminated by a light source, in a two-dimensional chromaticity diagram or a plane of color space.”1 Within a defined color space, a “gamut” describes the subset of colors that can be perceived under specific lighting conditions. |
| Binning | In the lighting industry, the act of "binning" of LEDs is the process of sorting LEDs by certain characteristics, such as color, voltage, and brightness. |
| Accent lighting | Accent lighting, also called highlighting, emphasizes objects by focusing light directly on them. Accent lighting is used inside and outside the home to feature locations such as an entrance or to create dramatic effects. |
| Dimmable driver | A dimming driver has two functions: As a driver, it converts the 230V AC mains input to a low voltage DC output. As a dimmer, it reduces the amount of electrical energy flowing to the LEDs, thereby causing them to dim. |
| Flicker | Flicker is the repeated and frequent variation in the output of a light source over time. |
| Fluorescent | A property of materials defined as the ability to emit light after absorbing electromagnetic radiation such as visible or UV light. |
| Candela | The candela is the unit of luminous intensity in the International System of Units. It measures the light output per unit solid angle emitted from a light source in a specific direction. |
| LUX | Lux is used to measure the amount of light output in a given area - one lux is equal to one lumen per square meter. It enables us to measure the total "amount" of visible light present and the intensity of the illumination on a surface. |
| Uniformity (U0) | The uniformity of lighting has significant effects on visual performance in both indoor and outdoor areas. Uniformity (represented as U0) value can be found by dividing the minimum brightness (Emin) resulting from calculations according to the current lighting order, to the average brightness value (Eavg). |
| Visible Light Spectrum | The visible light spectrum is the segment of the electromagnetic spectrum that the human eye can view. More simply, this range of wavelengths is called visible light. Typically, the human eye can detect wavelengths from 380 to 700 nanometers. |
| Ambient Temperature | Ambient Temperature is the temperature of the air surrounding an electrical enclosure. |
| Current-controlled dimming control | Current-controlled dimming controls LED brightness by varying the applied current using a 0-10V dimmer. Current-controlled dimming is smooth and HD-video friendly. It can only dim to a minimum of 5% of light output. |
| Design Light Consortium | It is a partnership of energy efficiency stakeholders in the United States and Canada to “promote quality, performance and energy efficient lighting solutions for the commercial sector”. |
| Pulse Width Modulation | Pulse-width modulation, or pulse-duration modulation, is a method of controlling the average power delivered by an electrical signal. |
| Surface Mounted Device | A surface mount device (SMD) is an electronic device whose components are mounted or placed directly on the surface of a printed circuit board. |
| Alternating Current | Alternating current is an electric current which periodically reverses direction and changes its magnitude continuously with time, in contrast to direct current, which flows only in one direction. |
| Direct Current | Direct current (DC) is an electric current that is uni-directional, so the flow of charge is always in the same direction. |
| Beam Angle | Beam angle (also called beam spread) is a measure of how light is distributed. On any plane perpendicular to the centerline of the light, the beam angle is the angle between two rays where the light intensity is 50% of the maximum light intensity. |
| LED Based Solar High Mast Lighting Systems | A Solar LED High Mast Light is a raised source of High illumination lights (6~8 lights) and with high intensity on the middle of major junctions (Ring roads, Outer Ring roads), turned on or lit automatically in the absence of light (at specified timings or at periodic times, every night). |
| Surface Mounted Diode (SMD) LEDs | A surface mount diode is a type that emits light and is flat mounted and soldered onto a circuit board. |
| Chip on Board (COB) LEDs | A COB LED is basically multiple LED chips (usually 9 or more) glued directly onto a substrate by the manufacturer to form a single module. |
| Dual In-Line Package (DIP) LEDs | A dual in-line package (DIP or DIL) is an electronic component package with a rectangular case and two parallel rows of electrical connector pins. |
| Graphene LED Lights | A graphene LED light bulb is simply an LED light bulb where the filament has been coated in graphene. A graphene LED bulb is reported to be 10% more efficient than regular LED light bulbs and they are cheaper to manufacture and buy. |
| LED Corn Bulbs | LED Corn lights are designed as an energy efficient alternative to high intensity discharge (HID) and SON lamps. It uses a large number of LEDs on a metal structure to provide sufficient light. This arrangement of LEDs looks a lot like a corn cob, hence the name "corn light". |
| Per Capita Income | Per capita income or total income measures the average income earned per person in a given area in a specified year. It is calculated by dividing the area's total income by its total population. Per capita income is national income divided by population size. |
| Charging Stations | A charging station, also known as a charging station or electric vehicle utility, is a power supply that provides electrical energy for charging plug-in electric vehicles. |
| Headlight | A headlight is a light that is mounted on the front of a car and illuminates the road in front of it. Low beam and high beam LED headlights are additional categories for these LED headlights. |
| Day Time Running Light (DRLs) | A daytime running lamp is a white, yellow, or amber lighting device mounted on the front of a road-going motor vehicle or bicycle. |
| Directional Signal Light | Directional signal lights are the front and rear lights on an automobile that flash to show the direction of a turn. |
| Stop Light | A red light that is mounted to the back of a car and turns on when the brakes are used to show that the car is stopped. |
| Reverse Light | The reverse light is at the back of the vehicle to indicate its backward motion. |
| Tail Light | A red light that can be seen in the dark is mounted on the rear of a road vehicle. Stop, reverse, and directional signal lights are all part of it. |
| Fog Light | Bright lights in automobiles used to increase visibility on the road in foggy conditions or to warn other drivers of the presence of the vehicle. |
| Passenger Vehicle | A passenger vehicle is a road vehicle, other than a moped or a motorcycle, intended for the transportation of people and designed for up to 8 to 9 seats. |
| Commercial Vehicle | A commercial vehicle (Bus, Truck, Van) is any type of motor vehicle used to transport goods or pay passengers. |
| Two Wheelers (2W) | A two-wheeler is a vehicle that runs on two wheels. |
| Streets & Roadways | Both roads and streets refer to hard, flat surfaces on the ground on which vehicles, people, and animals can travel. Since streetways are usually in cities and towns, they often have houses and buildings on both sides. The roadway is in the countryside and sometimes passes through forests and fields |
| Horticulture Lighting | Horticulture is the science and art of sustainably growing, producing, marketing and using high quality, intensively cultivated food and ornamental plants. |


Research Methodology
Mordor Intelligence has followed the following methodology in all our data center reports.
- Step 1: Raw Data Collection: To understand the market, initially, all crtical data points were identified. Critical information about countries and regions of interest including Per-capita Income, Population, Automotive Production, Interest rate on Auto-Loans, Number of Automobiles on Road, Total LED Import, Lighting Electricity Consumption among others were recorded or estimated based on internal calculations.
- Step 2: Identify Key Variables: To build a robust forecasting model, key variables such as Number of Households, Automotive Production, Road Networks among others were identified. Through an iterative process, the variables required for the market forecast were set, and the model was built using these variables.
- Step 3: Build a Market Model: Based on data and critical industry trend data (variables), including LED pricing, LED penetration rate, and project macro and micor economic factors were utilized for building the market forecasting.
- Step 4: Validate and Finalize: In this crucial step, all market numbers and variables derived through an internal mathematical model were validated through an extensive network of primary research experts from all the markets studied. The respondents are selected across levels and functions to generate a holistic picture of the market studied.
- Step 5: Research Outputs: Syndicated Reports, Custom Consulting Assignments, Databases & Subscription Platforms


