United States Indoor LED Lighting Market Size and Share
Market Overview
| Study Period | 2020 - 2031 |
|---|---|
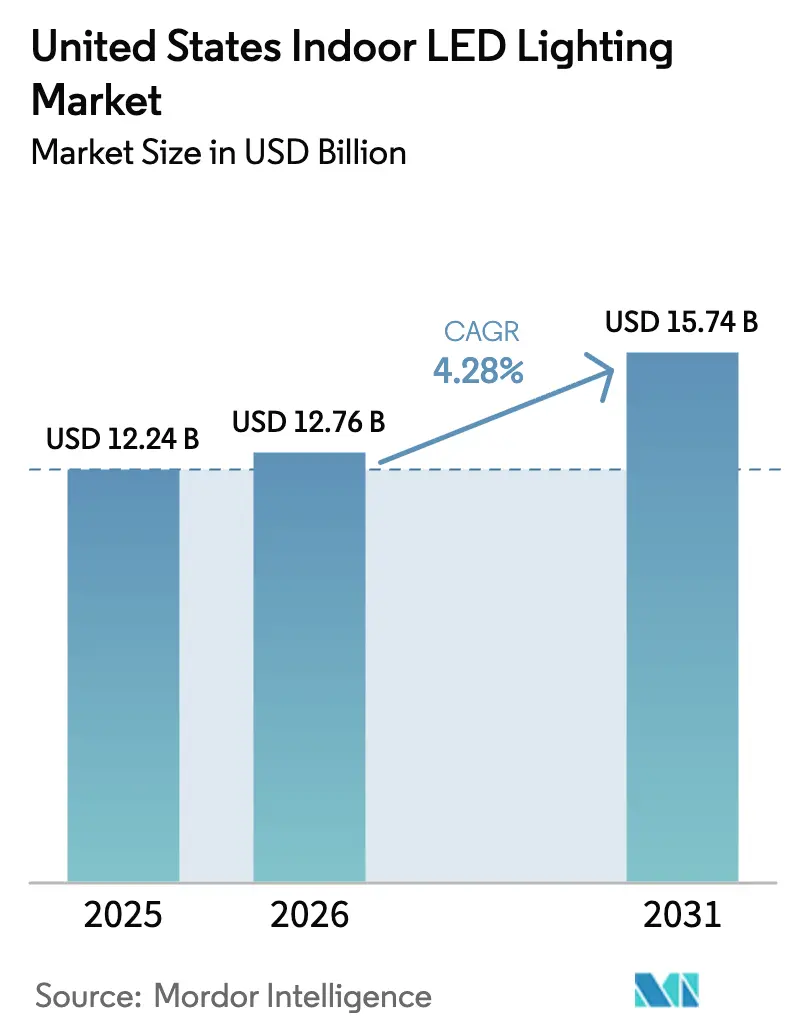
| Base Year Market Size (2025) | USD 12.24 Billion |
| Market Size (2026) | USD 12.76 Billion |
| Market Size (2031) | USD 15.74 Billion |
| Growth Rate (2026 - 2031) | 4.28% CAGR |
| Fastest Growing Market | Commercial |
| Largest Market | Industrial and Warehouse |
Major Players*Disclaimer: Major Players sorted in no particular order Image © Mordor Intelligence. Reuse requires attribution under CC BY 4.0. | |
United States Indoor LED Lighting Market Analysis by Mordor Intelligence
The United States indoor LED lighting market size was valued at USD 12.24 billion in 2025 and estimated to grow from USD 12.76 billion in 2026 to reach USD 15.74 billion by 2031, at a CAGR of 4.28% during the forecast period (2026-2031). Federal efficiency mandates set at 120 lumens per watt for federal procurement, a deep secondary‐replacement wave for first-generation LEDs, and corporate ESG programs together extend a steady runway for retrofit demand.[1]Department of Energy, “LED Lighting Standards,” energy.gov Accelerating efficacy gains and a 15–20% annual decline in component prices through 2024 continue to compress payback periods, stimulating adoption even in cost-sensitive verticals. Human-centric lighting features, particularly tunable-white systems, amplify value perception in homes and hybrid offices, while Lighting-as-a-Service contracts unlock upgrades for capital-constrained buyers. Competitive attention is now shifting toward cybersecurity, interoperability, and supply-chain resilience as fixture makers diversify their sourcing to guard against semiconductor disruptions. Collectively, these forces sustain stable unit volumes even as average selling prices continue their soft descent.
Key Report Takeaways
- By product type, luminaires and fixtures led with 61.25% revenue share in 2025, while lamps are forecast to expand at a 6.73% CAGR through 2031.
- By application, residential lighting accounted for a 40.65% share of the United States' indoor LED lighting market size in 2025 and is projected to advance at a 6.98% CAGR through 2031.
- By installation type, retrofit work accounted for 74.10% of the United States' indoor LED lighting market share in 2025, while new construction is projected to grow at a 6.67% CAGR through 2031.
- By distribution channel, wholesale and retail controlled 53.35% of sales in 2025; e-commerce is the fastest-growing channel, with a 5.42% CAGR through 2031.
Note: Market size and forecast figures in this report are generated using Mordor Intelligence’s proprietary estimation framework, updated with the latest available data and insights as of 2026.
United States Indoor LED Lighting Market Trends and Insights
Drivers Impact Analysis*
| Driver | (~) % Impact on CAGR Forecast | Geographic Relevance | Impact Timeline |
|---|---|---|---|
| Federal energy-efficiency mandates | +1.0% | National, early adoption in federal and regulated facilities | Medium term (2–4 years) |
| Decline in LED component prices and efficacy | +0.8% | National, stronger in cost-sensitive segments | Short term (≤ 2 years) |
| Corporate ESG-driven portfolio upgrades | +0.6% | National, concentrated in major metropolitan areas | Medium term (2–4 years) |
| Secondary replacement wave | +0.4% | National, pronounced in early-adopter regions | Short term (≤ 2 years) |
| Human-centric lighting demand | +0.3% | National, major business districts | Medium term (2–4 years) |
| Lighting-as-a-Service financing | +0.2% | National, higher take-up in large commercial portfolios | Long term (≥ 4 years) |
| Source: Mordor Intelligence | |||


Federal Energy-Efficiency Mandates Accelerate LED Retrofits
Mandatory 120 lumens-per-watt procurement thresholds for federal facilities catalyze accelerated fixture turnover across public buildings. Private-sector tenants and contractors that service government accounts now align purchase specifications with these rules, broadening the addressable base for qualified luminaires. Compliance deadlines in 2028 compress decision timelines, and early adopters leverage compliance status as proof points in competitive bids. The mandate also raises the minimum performance bar for importers, limiting the influx of low-efficacy products. Fixture makers refine SKUs to meet or exceed the threshold, improving catalog consistency and easing distributor stocking complexity. In parallel, utilities update rebate tiers to track the new baseline, sustaining the incentive stack that underpins retrofit economics.
Rapid Decline in LED Component Prices and Higher Efficacy
Scale manufacturing, vertical integration, and chip-on-board packaging drove down packaged LED costs by an average of 17% annually between 2021 and 2024. Commercial products routinely reach 180 lm/W, broadening the feasibility for high-ceiling industrial bays and cold-storage facilities. Lower wattage per fixture reduces breaker loads, trimming upgrade-related electrical work. Supply-chain volatility briefly lifted driver IC costs in late 2024, but multi-sourcing and regional inventory buffers stabilized lead times by mid-2025. Cost and performance tailwinds jointly keep paybacks under three years for most usage profiles, an important threshold for CFO sign-off. Facility managers, therefore, re-prioritize lighting in the capital budget queue after pandemic-induced deferrals.
Corporate ESG Targets Spur Large-Portfolio Lighting Upgrades
Carbon neutrality pledges write LED roll-outs directly into decarbonization road maps because electricity savings translate to Scope 2 reductions. Cisco’s Austin campus modernization, which blended smart luminaires with occupancy analytics, cut lighting energy consumption by 56% and feeds real-time data into corporate ESG dashboards.[2]Cisco, “Smart Building Solutions,” cisco.com Enterprises standardize on networked fixtures that integrate with building management systems, consolidating procurement over multiple sites to capture volume pricing. Lighting upgrades also serve wellness agendas by supporting circadian rhythms, which in turn support hybrid work policies. ESG reporting deadlines increase urgency, pushing multi-site retrofit phases into shorter windows. Demand therefore clusters around turnkey packages pairing fixtures, controls, and cloud analytics with structured financing.
Secondary-Replacement Wave as 2014–2016 LEDs Reach End-of-Life
Fixtures installed during the first mass adoption period now cross their 50,000-hour threshold, prompting proactive replacement before outright failure disrupts operations. Building owners utilize the change-out cycle to transition to networked controls, thereby achieving new efficiency without waiting for another construction event. Many early systems lacked dimming or sensor integration, so the incremental energy savings layer on top of first-wave gains. Installers leverage existing wiring, shaving labor hours versus fluorescent retrofits. The installed-base familiarity with LED light quality reduces evaluation hurdles, making specification decisions faster. As a result, procurement migrates from single-fixture SKUs toward platform-oriented product families.
Restraints Impact Analysis*
| Restraint | (~) % Impact on CAGR Forecast | Geographic Relevance | Impact Timeline |
|---|---|---|---|
| Up-front cost premium for SMEs | -0.7% | National, acute in rural and small business markets | Medium term (2–4 years) |
| Semiconductor supply-chain volatility | -0.5% | National, varying by distributor network density | Short term (≤ 2 years) |
| Cybersecurity and interoperability concerns for smart lighting | -0.4% | National, higher in security-sensitive verticals | Medium term (2–4 years) |
| Proliferation of low-quality imports | -0.3% | National, stronger in price-sensitive segments | Long term (≥ 4 years) |
| Source: Mordor Intelligence | |||
Up-Front Cost Premium for SMEs Despite Long Payback
Small enterprises often face quoted fixture costs three to five times higher than those of legacy fluorescent lighting, which strains their cash flow, even with two-year paybacks. While utility rebates help mitigate sticker shock, many rebates require pre-approval paperwork that exceeds SME administrative capacity. LaaS models fill part of the gap, but credit hurdles still exclude low-score borrowers. Program design varies by state, so regional uptake tends to skew toward utilities with turnkey rebate programs. Without uniform support, national manufacturers struggle to scale SME outreach, which in turn tempers the total addressable volume in this fragmented end-user pool.
Semiconductor Supply-Chain Volatility Inflates Fixture Lead Times
Global driver-IC shortages stretched standard lead times to 12–16 weeks in 2024, delaying projects and pushing contractors to over-order components. Larger brands diversified fabrication partners, yet passing on buffer-inventory costs raised average selling prices. Custom color-tuning skus relied on niche controller chips, heightening delay risk for high-spec projects. A subset of buyers temporarily reverted to commodity downlights to lock in schedules, depressing specification revenues. Manufacturers invest in North American board assembly to localize late-stage production, although added labor premiums are passed on to end-market pricing.
*Our forecasts treat driver/restraint impacts as directional, not additive. The impact forecasts reflect baseline growth, mix effects, and variable interactions.
Segment Analysis
By Product Type: Fixtures Lead the Installed Base While Lamps Capture Incremental Growth
Fixtures held 61.25% of 2025 revenue, reflecting sustained demand for integrated luminaires that embed optics, drivers, and controls into a single housing. This share stabilizes at around 60% through the forecast horizon, as architectural renovation and new smart-office designs prioritize cohesive aesthetics. The United States indoor LED lighting market size for fixtures aligns with commercial renovation budgets, and premium SKUs that include sensors help preserve margins despite average price erosion.
Lamps, although representing a smaller revenue pool, are expected to accelerate at a 6.73% CAGR through 2031, as upgrading consumers opt for screw-in bulbs that preserve legacy fixtures. The United States indoor LED lighting market benefits from utility programs that mail free lamps to residential addresses, further widening market penetration. Manufacturers now offer filament-style decorative lamps that meet Title 24 efficacy requirements without compromising visual appeal. Lamp development also targets horticulture and poultry lighting niches, diversifying demand beyond general illumination.


By Application: Residential Maintains Leadership Under Hybrid Work Patterns
Residential usage accounted for 40.65% of 2025 revenue, and the segment led growth at a 6.98% CAGR as work-from-home setups became permanent. The United States indoor LED lighting market size in residential applications is steadily increasing because homeowners value circadian-friendly tonal shifts that align with their personal comfort preferences.
Commercial offices remain the second-largest sector, but future growth is expected to tilt toward healthcare and education, where studies have linked improved visual environments with higher recovery rates and improved cognitive performance. The United States indoor LED lighting market share for healthcare upgrades is expanding as federal stimulus grants finance behavioral health clinic retrofits. Industrial facilities focus on high-bay solutions, and the intense warehousing activity in e-commerce hubs leads to a clustered demand for 30,000-lumen fixtures with advanced glare control.
By Installation Type: Retrofit Dominates Today While New Construction Gains Speed
Retrofit projects accounted for 74.10% of 2025 revenue, as the United States still maintains a large stock of fluorescent and early-generation LED fixtures. Utility incentives simplify retrofit economics, and installers maintain well-honed processes for troffer and linear-high-bay swaps. The United States indoor LED lighting market size within retrofit holds steady, yet annual unit volumes plateau as first-wave fluorescent replacements near completion in mature metropolitan areas.
New construction is projected to record a 6.67% CAGR through 2031. Architects now specify network-ready LED systems as baseline, embedding Power-over-Ethernet wiring to future-proof ceiling grids. Code updates in California and New York lock in daylight-harvesting and vacancy-sensor requirements, which channel demand toward programmable fixtures. The shift presses manufacturers to supply modular drivers and field-install sensor ports that ease commissioning timelines.

By Distribution Channel Wholesale Retail Retains Core Share While E-Commerce Scales
Traditional wholesalers controlled 53.35% of sales in 2025 by stocking regionally tailored product mixes and value-added layout services. The United States indoor LED lighting market relies on counter pickup for contractors who stage materials daily.
E-commerce volumes grow at 5.42% CAGR, propelled by smart bulbs and direct-ship residential fixtures that non-professional users can install. Marketplaces now publish ANSI-compliant photometric files, boosting buyer confidence. Hybrid models emerge where wholesalers operate storefront portals that allow contractors to reserve inventory online and pick up locally. Manufacturers also expand direct-ship programs for enterprise clients with national footprints, bundling replenishment contracts to stabilize volume visibility and ensure consistent supply.
Geography Analysis
California, Texas, New York, and Florida consistently rank as the highest-revenue states because elevated electricity prices shrink payback periods and state codes enforce strict efficiency thresholds. The United States indoor LED lighting market in California benefits from aggressive utility rebates linked to carbon-reduction mandates, catalyzing early adoption in commercial office towers and K-12 campuses. The Northeast corridor shows dense commercial retrofits, supported by old building stock that missed early LED opportunities.
In the Southeast, the acceleration of manufacturing reshoring and warehouse construction drives up demand for fixtures. Lower cost of electricity means payback horizons extend, yet tax incentives tied to job-creation packages partially offset the economics. Midwestern markets experience a split profile: large logistics hubs adopt high-bay LEDs aggressively, while rural counties lag due to SME budget constraints. The United States indoor LED lighting market size for industrial project clusters along interstate corridors where cross-dock facilities demand 24-hour illumination.
Extreme weather regions influence specification choices. High-humidity Gulf Coast environments select corrosion-resistant driver housings, while Northern climates favor 90-CRI fixtures that maintain color fidelity at low ambient temperatures. Regional distributors tailor stock, and price competition varies accordingly. State building codes continue to converge toward the 2024 edition of the International Energy Conservation Code, further harmonizing baseline demand.
Competitive Landscape
The United States indoor LED lighting market features a moderate level of concentration. Acuity Brands and Signify together command a strong presence in specification-grade lines, yet their combined revenue stays below the 40% threshold that would signal oligopolistic dominance. Mid-tier groups, such as Cooper Lighting and Hubbell, add depth, while niche innovators focus on horticulture, UV-C disinfection, and PoE categories. Component makers, including Cree LED, selectively forward-integrate into finished fixtures, adding channel tension.
Strategic activity centers on portfolio widening. Signify’s acquisition of Cooper Lighting in October 2025 expands channel reach and consolidates R&D resources in smart building platforms.[4]Signify, “Smart Lighting Solutions,” signify.com Acuity Brands focuses on vertical solutions, such as Nightingale, which combines tunable light with antimicrobial properties for healthcare applications. Startups leverage cloud ecosystems to link luminaires with asset-tracking and indoor-positioning services, securing venture funding to scale software layers on top of commodity hardware.
Supply-chain risk management shapes procurement strategy. Manufacturers maintain dual-listed bill-of-materials to quickly swap ICs if one foundry constrains allocations. Some open micro-assembly lines in Mexico and Ohio for final driver board production, sidestepping Pacific shipping volatility. Pricing discipline remains delicate as raw material turbulence forces quarterly list price adjustments. Distributors push for extended price locks to protect job bids, shifting margin pressure back to manufacturers.
United States Indoor LED Lighting Industry Leaders
Acuity Brands, Inc.
Signify N.V.
Hubbell Incorporated
Current Lighting Solutions, LLC
CreeLED, Inc.
- *Disclaimer: Major Players sorted in no particular order

Recent Industry Developments
- October 2025: Signify completed its acquisition of Cooper Lighting Solutions from Eaton Corporation for USD 2.8 billion, creating the largest lighting portfolio in North America and expanding smart building capabilities across commercial and industrial segments.
- September 2025: Acuity Brands launched its Nightingale healthcare lighting platform, incorporating circadian rhythm technology and infection-control features designed for hospital and long-term care applications.
- August 2025: The Department of Energy finalized LED testing standards, requiring 120 lumens per watt efficiency for federal procurement, which accelerates compliance timelines and creates new market requirements for government contractors.
- July 2025: Hubbell divested its residential lighting division to Coleto Brands for USD 485 million, sharpening its focus on commercial and industrial smart-lighting solutions.


United States Indoor LED Lighting Market Report Scope
Agricultural Lighting, Commercial, Industrial and Warehouse, Residential are covered as segments by Indoor Lighting.| Lamps |
| Luminaires/ Fixtures |
| Residential |
| Commercial Offices |
| Retail Stores |
| Hospitality |
| Industrial Facilities |
| Healthcare and Education |
| Other Applications |
| New Installation |
| Retrofit Installation |
| Direct Sales |
| Wholesale Retail |
| E-commerce |
| By Product Type | Lamps |
| Luminaires/ Fixtures | |
| By Application | Residential |
| Commercial Offices | |
| Retail Stores | |
| Hospitality | |
| Industrial Facilities | |
| Healthcare and Education | |
| Other Applications | |
| By Installation Type | New Installation |
| Retrofit Installation | |
| By Distribution Channel | Direct Sales |
| Wholesale Retail | |
| E-commerce |


Market Definition
- INDOOR LIGHTING - It incorporates all LED based lamps and fixtures/luminaire that are used to illuminate indoor section of residential, commercial, industrial buildings and agricultural lighting. LED offers efficient brightness with higher durability in comparison to other lighting technology.
- OUTDOOR LIGHTING - It incorporates the LED lighting fixtures that is used for illumination for exterior/outdoor illumination. For instance, LED lighting fixtures used to illuminate streets and highways, transport hubs, stadiums and other public places such as parking spaces.
- AUTOMOTIVE LIGHTING - It refers to the lighting fixtures installed for illumination and signaling purposes. It is used in both exterior and interior lighting of the vehicle. Headlamps, fog lamp, daytime running light (DRLs) are examples of exterior light whereas cabin light are interior lights.
- END USER - It refers to the end use application area where the LED fixture will be installed. For instance, in terms of indoor lighting, we have residential, commercial and industrial as end user category. For automotive lighting, primary end user considered are automotive manufacturers and aftermarket sale
| Keyword | Definition |
|---|---|
| Lumen | Lumen is a unit of luminous flux in the International System of Units that is equal to the amount of light given out through a solid angle by a source of one-candela intensity radiating equally in all directions. |
| Footcandle | A foot-candle (or foot-candle, fc, lm/ft2, or ft-c) is a measurement of light intensity. One foot-candle is defined as enough light to saturate a one-foot square with one lumen of light. |
| Colour Rendering Index (CRI) | Color Rendering Index (CRI) is a measurement of how natural colors render under an artificial white light source when compared with sunlight. The index is measured from 0-100, with a perfect 100 indicating that colors of objects under the light source appear the same as they would under natural sunlight. |
| Luminous flux | Luminous flux is a measure of the power of visible light produced by a light source or light fitting. It is measured in lumens (lm). |
| Annual Energy Cost | Annual Energy Cost means the average daily energy consumption multiplied by 365 (days per year), expressed in kilowatt hour per year (kWh/a). |
| Constant voltage drivers | Constant voltage drivers are designed for a single direct current (DC) output voltage. Most common constant voltage drivers (or Power Supplies) are 12VDC or 24VDC. An LED light that is rated for constant voltage usually specifies the amount of input voltage it needs to operate correctly. |
| Constant Current Driver | Constant current LED drivers are designed for a designated range of output voltages and a fixed output current (mA). LEDs that are rated to operate on a constant current driver require a designated supply of current usually specified in milliamps (mA) or amps (A). These drivers vary the voltage along an electronic circuit which allows current to remain constant throughout the LED system. |
| Minimum Energy Performance Standards (MEPS) | Minimum Energy Performance Standards specify the minimum level of energy performance that appliances and equipment must meet or exceed before they can supply or used for commercial purposes. |
| Luminous Efficacy | Luminous efficacy is a measurement commonly used in the lighting industry that indicates the ability of a light source to emit visible light using a given amount of power. |
| Solid State Lighting | Solid-state lighting (SSL) is a type of lighting that uses semiconductor light-emitting diodes (LEDs), organic light-emitting diodes (OLED), or polymer light-emitting diodes (PLED) as sources of illumination rather than electrical filaments, plasma (used in arc lamps such as fluorescent lamps), or gas. |
| Rated Lamp Life | Lamp life, also referred to as rated life, is the time in hours a lamp will last before a percentage of lamps will burn out. |
| Color Temperature | Colour temperature is a scale that measures how ‘warm’ (yellow) or ‘cool’ (blue) the light from a particular source is. It is measured in degrees of the Kelvin scale (abbreviated to K), and the higher the number, the ‘cooler’ the light. The lower the ‘K’ number, the ‘warmer’ the light. |
| Ingress Protection rating (IP rating) | The IP (Ingress Protection) rating of a bulb or light fixture declares the level of protection it has against dirt and water. |
| Fidelity Index | The general colour fidelity index, Rf, represents how closely the colour appearances of the entire sample set are reproduced (rendered) on average by a test light as compared to those under a reference illuminant. |
| Gamut Index | The gamut area is defined as “the area enclosed by a set of test color samples illuminated by a light source, in a two-dimensional chromaticity diagram or a plane of color space.”1 Within a defined color space, a “gamut” describes the subset of colors that can be perceived under specific lighting conditions. |
| Binning | In the lighting industry, the act of "binning" of LEDs is the process of sorting LEDs by certain characteristics, such as color, voltage, and brightness. |
| Accent lighting | Accent lighting, also called highlighting, emphasizes objects by focusing light directly on them. Accent lighting is used inside and outside the home to feature locations such as an entrance or to create dramatic effects. |
| Dimmable driver | A dimming driver has two functions: As a driver, it converts the 230V AC mains input to a low voltage DC output. As a dimmer, it reduces the amount of electrical energy flowing to the LEDs, thereby causing them to dim. |
| Flicker | Flicker is the repeated and frequent variation in the output of a light source over time. |
| Fluorescent | A property of materials defined as the ability to emit light after absorbing electromagnetic radiation such as visible or UV light. |
| Candela | The candela is the unit of luminous intensity in the International System of Units. It measures the light output per unit solid angle emitted from a light source in a specific direction. |
| LUX | Lux is used to measure the amount of light output in a given area - one lux is equal to one lumen per square meter. It enables us to measure the total "amount" of visible light present and the intensity of the illumination on a surface. |
| Uniformity (U0) | The uniformity of lighting has significant effects on visual performance in both indoor and outdoor areas. Uniformity (represented as U0) value can be found by dividing the minimum brightness (Emin) resulting from calculations according to the current lighting order, to the average brightness value (Eavg). |
| Visible Light Spectrum | The visible light spectrum is the segment of the electromagnetic spectrum that the human eye can view. More simply, this range of wavelengths is called visible light. Typically, the human eye can detect wavelengths from 380 to 700 nanometers. |
| Ambient Temperature | Ambient Temperature is the temperature of the air surrounding an electrical enclosure. |
| Current-controlled dimming control | Current-controlled dimming controls LED brightness by varying the applied current using a 0-10V dimmer. Current-controlled dimming is smooth and HD-video friendly. It can only dim to a minimum of 5% of light output. |
| Design Light Consortium | It is a partnership of energy efficiency stakeholders in the United States and Canada to “promote quality, performance and energy efficient lighting solutions for the commercial sector”. |
| Pulse Width Modulation | Pulse-width modulation, or pulse-duration modulation, is a method of controlling the average power delivered by an electrical signal. |
| Surface Mounted Device | A surface mount device (SMD) is an electronic device whose components are mounted or placed directly on the surface of a printed circuit board. |
| Alternating Current | Alternating current is an electric current which periodically reverses direction and changes its magnitude continuously with time, in contrast to direct current, which flows only in one direction. |
| Direct Current | Direct current (DC) is an electric current that is uni-directional, so the flow of charge is always in the same direction. |
| Beam Angle | Beam angle (also called beam spread) is a measure of how light is distributed. On any plane perpendicular to the centerline of the light, the beam angle is the angle between two rays where the light intensity is 50% of the maximum light intensity. |
| LED Based Solar High Mast Lighting Systems | A Solar LED High Mast Light is a raised source of High illumination lights (6~8 lights) and with high intensity on the middle of major junctions (Ring roads, Outer Ring roads), turned on or lit automatically in the absence of light (at specified timings or at periodic times, every night). |
| Surface Mounted Diode (SMD) LEDs | A surface mount diode is a type that emits light and is flat mounted and soldered onto a circuit board. |
| Chip on Board (COB) LEDs | A COB LED is basically multiple LED chips (usually 9 or more) glued directly onto a substrate by the manufacturer to form a single module. |
| Dual In-Line Package (DIP) LEDs | A dual in-line package (DIP or DIL) is an electronic component package with a rectangular case and two parallel rows of electrical connector pins. |
| Graphene LED Lights | A graphene LED light bulb is simply an LED light bulb where the filament has been coated in graphene. A graphene LED bulb is reported to be 10% more efficient than regular LED light bulbs and they are cheaper to manufacture and buy. |
| LED Corn Bulbs | LED Corn lights are designed as an energy efficient alternative to high intensity discharge (HID) and SON lamps. It uses a large number of LEDs on a metal structure to provide sufficient light. This arrangement of LEDs looks a lot like a corn cob, hence the name "corn light". |
| Per Capita Income | Per capita income or total income measures the average income earned per person in a given area in a specified year. It is calculated by dividing the area's total income by its total population. Per capita income is national income divided by population size. |
| Charging Stations | A charging station, also known as a charging station or electric vehicle utility, is a power supply that provides electrical energy for charging plug-in electric vehicles. |
| Headlight | A headlight is a light that is mounted on the front of a car and illuminates the road in front of it. Low beam and high beam LED headlights are additional categories for these LED headlights. |
| Day Time Running Light (DRLs) | A daytime running lamp is a white, yellow, or amber lighting device mounted on the front of a road-going motor vehicle or bicycle. |
| Directional Signal Light | Directional signal lights are the front and rear lights on an automobile that flash to show the direction of a turn. |
| Stop Light | A red light that is mounted to the back of a car and turns on when the brakes are used to show that the car is stopped. |
| Reverse Light | The reverse light is at the back of the vehicle to indicate its backward motion. |
| Tail Light | A red light that can be seen in the dark is mounted on the rear of a road vehicle. Stop, reverse, and directional signal lights are all part of it. |
| Fog Light | Bright lights in automobiles used to increase visibility on the road in foggy conditions or to warn other drivers of the presence of the vehicle. |
| Passenger Vehicle | A passenger vehicle is a road vehicle, other than a moped or a motorcycle, intended for the transportation of people and designed for up to 8 to 9 seats. |
| Commercial Vehicle | A commercial vehicle (Bus, Truck, Van) is any type of motor vehicle used to transport goods or pay passengers. |
| Two Wheelers (2W) | A two-wheeler is a vehicle that runs on two wheels. |
| Streets & Roadways | Both roads and streets refer to hard, flat surfaces on the ground on which vehicles, people, and animals can travel. Since streetways are usually in cities and towns, they often have houses and buildings on both sides. The roadway is in the countryside and sometimes passes through forests and fields |
| Horticulture Lighting | Horticulture is the science and art of sustainably growing, producing, marketing and using high quality, intensively cultivated food and ornamental plants. |


Research Methodology
Mordor Intelligence has followed the following methodology in all our data center reports.
- Step 1: Raw Data Collection: To understand the market, initially, all crtical data points were identified. Critical information about countries and regions of interest including Per-capita Income, Population, Automotive Production, Interest rate on Auto-Loans, Number of Automobiles on Road, Total LED Import, Lighting Electricity Consumption among others were recorded or estimated based on internal calculations.
- Step 2: Identify Key Variables: To build a robust forecasting model, key variables such as Number of Households, Automotive Production, Road Networks among others were identified. Through an iterative process, the variables required for the market forecast were set, and the model was built using these variables.
- Step 3: Build a Market Model: Based on data and critical industry trend data (variables), including LED pricing, LED penetration rate, and project macro and micor economic factors were utilized for building the market forecasting.
- Step 4: Validate and Finalize: In this crucial step, all market numbers and variables derived through an internal mathematical model were validated through an extensive network of primary research experts from all the markets studied. The respondents are selected across levels and functions to generate a holistic picture of the market studied.
- Step 5: Research Outputs: Syndicated Reports, Custom Consulting Assignments, Databases & Subscription Platforms


