Indoor LED Lighting Market Size and Share
Market Overview
| Study Period | 2020 - 2031 |
|---|---|
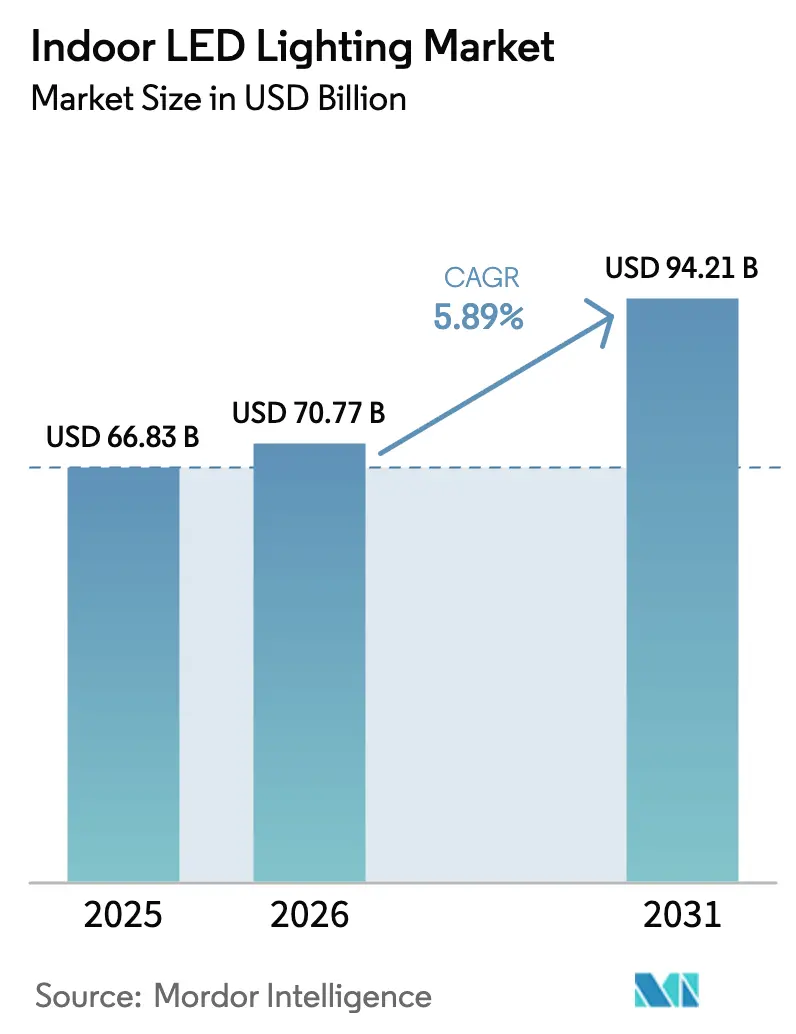
| Market Size (2026) | USD 70.77 Billion |
| Market Size (2031) | USD 94.21 Billion |
| Growth Rate (2026 - 2031) | 5.89% CAGR |
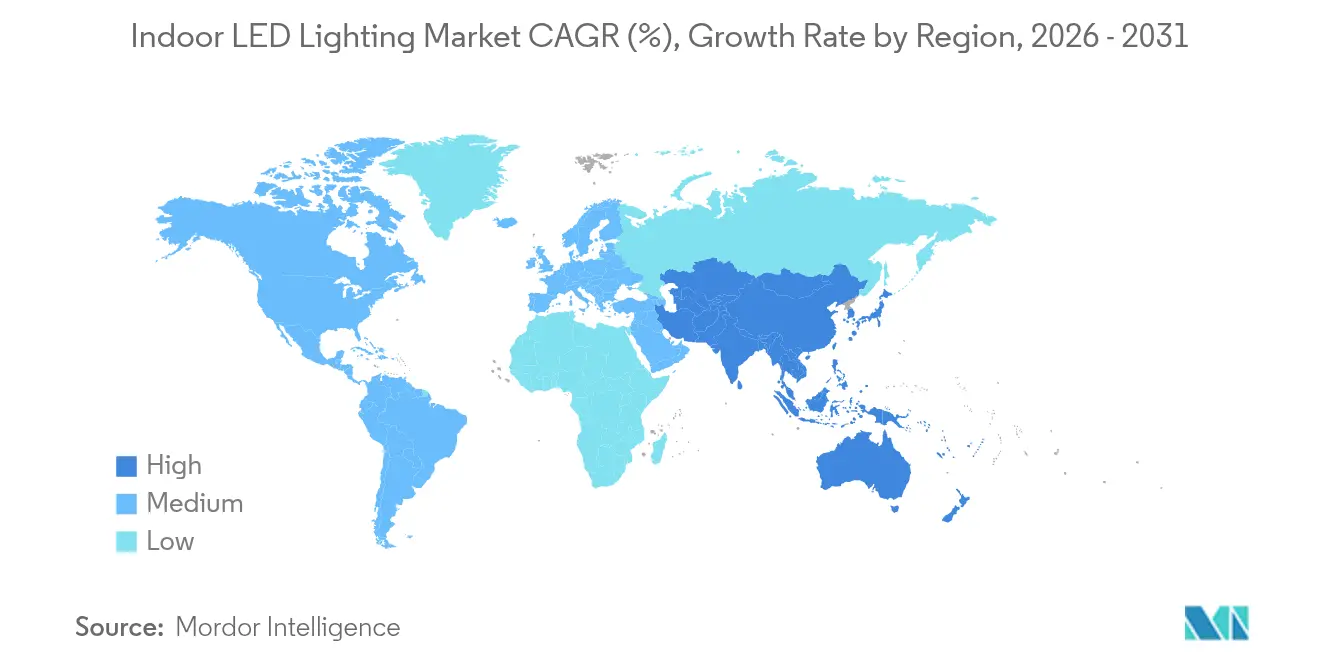
| Fastest Growing Market | Asia Pacific |
| Largest Market | Asia Pacific |
| Market Concentration | Medium |
Major Players *Disclaimer: Major Players sorted in no particular order Image © Mordor Intelligence. Reuse requires attribution under CC BY 4.0. | |
Indoor LED Lighting Market Analysis by Mordor Intelligence
The indoor LED lighting market size is expected to grow from USD 66.83 billion in 2025 to USD 70.77 billion in 2026 and is forecast to reach USD 94.21 billion by 2031 at 5.89% CAGR over 2026-2031. Ongoing efficiency regulations, rapid declines in LED component prices, and mounting corporate sustainability mandates collectively spur steady conversion of legacy fixtures to high-efficacy, network-ready luminaires. Manufacturers accelerate phosphor and driver innovation as the U.S. Department of Energy raises the minimum efficacy bar to 120 lumens per watt by 2028, while municipalities deploy connected LEDs that yield documented operating cost cuts and data-rich infrastructure benefits. Regional adoption remains uneven: the Asia Pacific already commands the largest indoor LED lighting market share, supported by India’s production incentive program and China’s stricter lumen-per-watt norms, whereas North American demand focuses on large-scale retrofits, such as Walgreens’ multi-store upgrade. Application patterns are also shifting the residential segment’s rapid price-driven conversion mirrors growing consumer acceptance of smart bulbs and wellness-oriented fixtures, outpacing mature commercial office installations that once dominated early growth. Competitive dynamics now pivot on thermal management, circadian rhythm support, and connectivity features rather than headline fixture pricing, creating margin upside for suppliers with robust R&D pipelines and upstream material security.
Key Report Takeaways
- By product type, luminaires held a 64.35% revenue share of the indoor LED lighting market in 2025, while the lamp segment is forecast to deliver the fastest growth, with an 8.36% CAGR to 2031.
- By installation type, retrofit projects accounted for 74.65% of current deployments in the 2025 indoor LED lighting market; new installations are projected to grow at an 8.28% CAGR through 2031 as green-building codes become stricter.
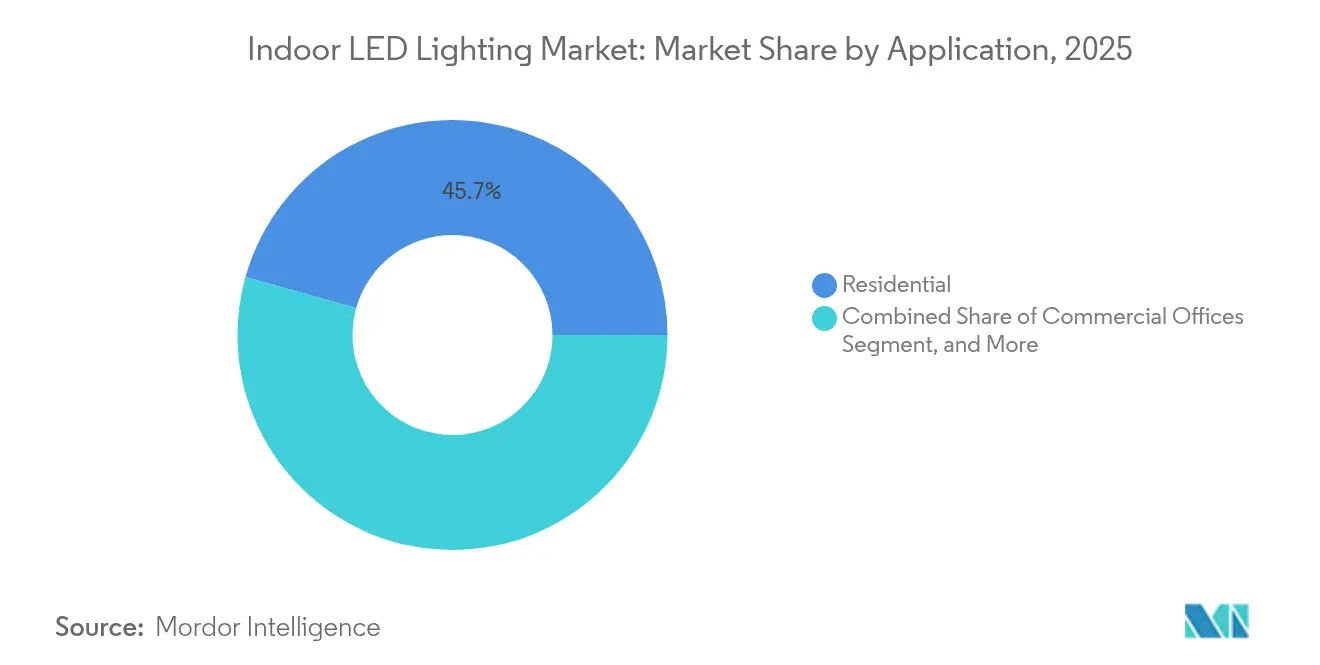
- By application, the residential segment led with 45.65% share of the indoor LED lighting market in 2025 and is expected to expand at a leading 9.74% CAGR to 2031.
- By distribution channel, wholesale outlets retained a 56.95% share of the indoor LED lighting market in 2025, whereas e-commerce orders are set to rise at a 7.78% CAGR through 2031.
- By geography, the Asia Pacific accounted for 26.85% of the 2025 revenues of the indoor LED lighting market and is projected to post the highest CAGR of 6.94% between 2026 and 2031.
Note: Market size and forecast figures in this report are generated using Mordor Intelligence’s proprietary estimation framework, updated with the latest available data and insights as of 2026.
Global Indoor LED Lighting Market Trends and Insights
Drivers Impact Analysis*
| DRIVER | (~) % IMPACT ON CAGR FORECAST | GEOGRAPHIC RELEVANCE | IMPACT TIMELINE |
|---|---|---|---|
| Declining LED prices and efficiency gains | +1.2% | Global, strongest in price-sensitive Asia Pacific | Medium term (2-4 years) |
| Government energy-efficiency regulations and incandescent phase-outs | +1.8% | North America, EU leadership; Asia Pacific following | Short term (≤ 2 years) |
| Smart city initiatives accelerating smart lighting deployments | +1.1% | Urban centers worldwide, notably China, India, U.S. | Medium term (2-4 years) |
| Corporate sustainability commitments fueling retrofit demand | +0.9% | Global Fortune 500 operations | Short term (≤ 2 years) |
| Integration of Li-Fi capability in commercial luminaires | +0.4% | Early adoption in Europe and North America | Long term (≥ 4 years) |
| Adoption of circadian lighting for wellness in workplaces and healthcare | +0.6% | North America and Europe | Medium term (2-4 years) |
| Source: Mordor Intelligence | |||


Government Energy-Efficiency Regulations and Incandescent Phase-Outs
Tightening global standards have transformed the indoor LED lighting market by rendering incandescent and halogen products commercially unviable. In the United States, the minimum efficacy threshold is expected to triple to 120 lm/W by 2028, prompting accelerated innovation in phosphor chemistry and driver electronics. China’s 2024 rules similarly require circadian-capable and light-health-rated LEDs, broadening compliance metrics to wellness as well as energy. Europe’s 2024/1781 Ecodesign Regulation layers full life-cycle mandates on material choices and recyclability, raising competitive hurdles for low-spec imports.[1]European Commission, “Ecodesign for Sustainable Products Regulation 2024/1781,” EC.EUROPA.EU Municipal evidence underscores the regulations’ payoff: Chicago’s 270,000 fixture changeover saves USD 10 million each year and halves maintenance costs.[2]Chicago Department of Transportation, “Smart Lighting Initiative Results,” CHICAGO.GOV Compliant suppliers that invest in advanced thermal management and alternative phosphors now win procurement contracts as sub-par competitors exit.
Smart City Initiatives Accelerating Smart Lighting Deployments
LED networks now anchor urban Internet-of-Things (IoT) strategies, turning lighting grids into sensing platforms for traffic, air quality, and security analytics. Programs under India’s Smart Cities Mission finance integrated fixtures with remote monitoring and adaptive dimming, covering more than 100 municipalities. Signify’s BrightSites project in Chatou, France, demonstrates monetization potential by integrating Wi-Fi hotspots with environmental sensing capabilities in a single luminaire. Li-Fi-ready luminaires introduced through European pilots promise gigabit data delivery without radio congestion, elevating lighting assets to the level of telecom infrastructure. Collectively, these initiatives enlarge the indoor LED lighting market beyond illumination, rewarding vendors that bundle software, connectivity, and analytics with high-efficacy hardware.
Corporate Sustainability Commitments Fueling Retrofit Demand
Enterprises translate net-zero pledges into portfolio-wide LED retrofits featuring smart controls and verified performance metrics. Walgreens invested USD 146 million to convert 2,000 outlets, achieving 45-50% energy savings that are directly reflected in its carbon accounting. The TJX Companies cut greenhouse-gas emissions by 37% after switching to LEDs across its shops and distribution hubs. Dollar Tree allocated USD 113 million to energy upgrades, with half of its distribution centers already converted. Franchise operators mirror this trend: 7-Eleven’s 4,760-store program saves USD 15.3 million annually. Suppliers able to package lighting hardware with financing, installation, and performance guarantees see stronger retrofit pipelines.
Adoption of Circadian Lighting for Wellness in Workplaces and Healthcare
Demand for light that supports human biological rhythms converts LEDs from commodity products to premium wellness tools. Mayo Clinic reports better sleep and shorter stays in wards equipped with tunable-white luminaires. Academic studies from the University of Surrey confirm reductions in cortisol levels and cognitive gains under circadian rhythms. Technology vendors respond: Signify’s EyeComfort range satisfies glare, flicker, and spectrum criteria designed around occupant well-being. U.S. hospitals increasingly tie patient-satisfaction metrics to circadian lighting, linking the feature to reimbursement revenue. These outcomes justify higher price points and longer replacement cycles within the indoor LED lighting market.
Restraints Impact Analysis*
| Restraint | (~) % Impact on CAGR Forecast | Geographic Relevance | Impact Timeline |
|---|---|---|---|
| High upfront cost of intelligent lighting controls | -0.8% | Global, acute in cost-sensitive developing regions | Short term (≤ 2 years) |
| Thermal management issues in high-ambient industrial environments | -0.6% | Manufacturing hubs worldwide | Medium term (2-4 years) |
| Rare-earth phosphor supply chain vulnerabilities | -0.7% | Asia-centric manufacturing chains | Medium term (2-4 years) |
| Data-privacy concerns around sensor-enabled lighting networks | -0.4% | North America and Europe, spreading globally | Long term (≥ 4 years) |
| Source: Mordor Intelligence | |||
High Upfront Cost of Intelligent Lighting Controls
Advanced LEDs with sensor bundles, wireless radios, and analytics engines cost 40-60% more than basic fixtures, pushing payback periods past five years in low-utilization sites. Small enterprises and budget-constrained public schools often defer upgrades even when energy savings are clear. Retrofits often incur additional wiring and commissioning expenses, as older buildings typically lack power-over-Ethernet or compatible dimming circuits. Consequently, the indoor LED lighting market splits between commodity retrofits and premium smart systems, narrowing the addressable base for high-margin offerings.
Thermal Management Issues in High-Ambient Industrial Environments
Steel mills, foundries, and chemical plants operate in ambient conditions exceeding 40 °C, which accelerates the junction temperatures of LEDs and the degradation of phosphors.[3]IEEE Industry Applications Society, “Industrial LED Thermal Management Standards,” IEEE.ORG Industrial-grade luminaires often require redesigns of their heat sinks or active cooling systems, which raises costs and complicates maintenance. Facility engineers accustomed to high-intensity-discharge lamps often mistrust the resilience of LEDs, which slows the penetration of the indoor LED lighting market in heavy-industry settings.
*Our forecasts treat driver/restraint impacts as directional, not additive. The impact forecasts reflect baseline growth, mix effects, and variable interactions.
Segment Analysis
By Product Type: Integrated Luminaires Capture Value
The indoor LED lighting market size for luminaires accounted for the majority of 2025 revenues, as integrated fixtures combined light engines, optics, and drivers into turnkey packages valued by contractors. Lamps still appeal to cost-conscious retrofits; however, rising smart-home adoption and decorative form factors are expected to lift lamp demand at an 8.36% CAGR through 2031. Luminaires increasingly feature full-spectrum or circadian tuning, positioning suppliers like Seoul Semiconductor, whose joint study with UC Davis replicates natural sunlight for premium wellness applications. As building projects specify network-ready devices, integrated luminaires hold pricing leverage, while lamps sustain replacement-cycle volume.
Advanced fixture design now incorporates wireless radios, environmental sensors, and edge processors, enabling a single luminaire to monitor occupancy, temperature, and asset location. This convergence secures annuity revenue from software licenses and cloud analytics, differentiating brands in the crowded indoor LED lighting market. Component cost erosion also allows manufacturers to release lower-priced variants without sacrificing margins, thereby broadening adoption across mid-tier commercial interiors.


By Installation Type: Retrofit Dominance Mirrors Installed-Base Reality
Retrofits account for three-quarters of 2025 shipments, reflecting the vast inventory of fluorescent and HID fixtures still in use. Companies exploit maintenance windows to replace lamps, ballasts, and troffers with LED equivalents, qualifying for utility rebates and tax incentives. The indoor LED lighting market share for retrofit solutions remains strong as rising electricity prices reinforce simple payback logic.
Yet new-construction demand accumulates as net-zero buildings and wellness-certification schemes (WELL, LEED v4) specify connected luminaires from the design phase. New installations are expanding at an 8.28% CAGR, providing opportunities for fixture-integrated controls and Li-Fi nodes that are difficult to justify in piecemeal upgrades. Manufacturers that offer both retrofit kits and purpose-built new-build ranges retain channel relevance across the project lifecycle.
By Application: Residential Surge Redefines Volume Mix
Residential buyers absorbed 45.65% of 2025 shipments, and their 9.74% CAGR makes them the fastest-rising customer class. Entry-level smart bulbs sold via e-commerce create low-barrier adoption pathways, while decorative luminaires with tunable white light attract wellness-minded homeowners. Commercial offices and retail stores still account for substantial revenue but face slowing growth as early retrofit cycles mature.
Healthcare and education specify circadian lighting to improve outcomes; Mayo Clinic’s quantifiable patient-benefit data persuade administrators to approve higher capital budgets. Industrial buyers remain selective until vendors solve high-ambient challenges, leaving room for niche specialists within the indoor LED lighting industry.
By Distribution Channel: Digital Platforms Erode Wholesale Dominance
Traditional electrical wholesalers still account for 56.95% of the indoor LED lighting market volume, thanks to their long-standing contractor relationships. However, end users now research specification sheets online, pushing 7.78% CAGR growth in e-commerce channels through 2031. Direct-to-customer storefronts reduce margin layers and speed configuration quoting; Havells’ USD 50 million U.S. entry exemplifies this model.
Wholesale distributors respond by enhancing value-added services such as on-site audits, financing facilitation, and just-in-time delivery. For manufacturers, omnichannel capability is crucial: digital catalogs, spec-builder apps, and rapid customer support complement traditional brick-and-mortar logistics, sustaining competitiveness across evolving buyer journeys.
Geography Analysis
The Asia Pacific leads the indoor LED lighting market, with a 26.85% revenue share in 2025 and a forecasted 6.94% CAGR. Large-scale programs, such as India’s Production Linked Incentive, which has attracted INR 10,478 crore (USD 1.26 billion) in commitments, expand domestic chip-packaging and driver plants, thereby lowering regional component costs. China enforces new human-centric lighting codes, further tilting demand toward high-spec LEDs and incentivizing domestic manufacturers to climb the value chain [GB688.CN]. Government bulk-procurement schemes such as UJALA, credited with distributing 368.7 million lamps, sustain affordable pricing for households and small businesses.
North America remains a retrofit powerhouse fueled by strict efficacy mandates and corporate ESG agendas. Walgreens’ chain-wide upgrade, Chicago’s municipal rollout, and widespread utility rebates anchor predictable lamp and troffer volume. Upcoming federal standards are expected to drive a wave of compliance replacements, reinforcing baseline demand within the indoor LED lighting market.
Life-cycle sustainability rules and smart-city pilots drive European growth. The 2024/1781 Ecodesign law requires recyclability and material traceability, favoring producers that have invested in circular-economy research and development. Cities like Chatou deploy multi-purpose poles that combine lighting, Wi-Fi, and air-quality sensors, creating reference projects for future tenders. Meanwhile, the Middle East and Africa markets are adopting LEDs in new airports, malls, and infrastructure projects, although the project cadence remains sensitive to oil revenues and public-sector budgets.

Competitive Landscape
Industry leaders Signify, ams-OSRAM, Acuity Brands, Seoul Semiconductor, and Eaton’s Cooper Lighting command scale advantages in R&D, packaging, and global channels. These incumbents continually refine phosphor recipes, thermal designs, and driver architectures to meet upcoming 120 lm/W targets while integrating networking stacks for Matter, Zigbee, and Bluetooth interoperability. Mid-tier challengers differentiate themselves by vertical specialization: Cree Lighting targets high-ambient industrial bays, Glamox focuses on marine lighting, and Fagerhult addresses Nordic architectural niches.
Strategic moves demonstrate the shift toward integrating software and semiconductors. Signify’s USD 85 million acquisition of Cooper’s smart-controls unit enhances its Interact platform reach.[4]Signify, “Company Press Releases and Financial Reports,” SIGNIFY.COM ams-OSRAM derives 45% of its USD 1.18 billion in Q4 2024 revenue from LED components, reinforcing its vertical integration into the automotive and horticulture sub-segments. Start-ups pursuing Li-Fi, human-centric wellness metrics, or AI-driven analytics are shaping emerging competition by layering services on top of hardware.
Supply-chain risk management has become a core differentiator as China restricts exports of gallium and germanium. Firms with long-term rare-earth contracts or substitute phosphor chemistries hedge against production continuity issues. Data-privacy compliance also influences product design: the European General Data Protection Regulation (GDPR) rules require edge processing or anonymization of occupancy data captured by sensors, affecting firmware architecture and cloud-connectivity choices across the indoor LED lighting market.
Indoor LED Lighting Industry Leaders
Signify N.V.
Acuity Brands, Inc.
ams-OSRAM AG
Zumtobel Group AG
Hubbell Incorporated
- *Disclaimer: Major Players sorted in no particular order

Recent Industry Developments
- February 2025: Signify has formed an Egyptian joint venture aimed at manufacturing 2 million luminaires annually for projects in the MENA region.
- January 2025: ams-OSRAM reported Q4 2024 sales of EUR 1.1 billion (USD 1.18 billion), with LEDs accounting for 45%.
- December 2024: Havells allocated USD 50 million to launch direct sales and warehousing in the United States.
- November 2024: Seoul Semiconductor and UC Davis research have validated full-spectrum LEDs for enhancing plant growth and providing circadian benefits.


Global Indoor LED Lighting Market Report Scope
Agricultural Lighting, Commercial, Industrial and Warehouse, Residential are covered as segments by Indoor Lighting. Asia-Pacific, Europe, Middle East and Africa, North America, South America are covered as segments by Region.| Lamps |
| Luminaires/Fixtures |
| New Installation |
| Retrofit Installation |
| Residential |
| Commercial Offices |
| Retail Stores |
| Hospitality |
| Industrial Facilities |
| Healthcare and Education |
| Other Applications |
| Direct Sales |
| Wholesale Retail |
| E-commerce |
| North America | United States | |
| Canada | ||
| Mexico | ||
| South America | Brazil | |
| Argentina | ||
| Chile | ||
| Rest of South America | ||
| Europe | Germany | |
| United Kingdom | ||
| France | ||
| Italy | ||
| Spain | ||
| Rest of Europe | ||
| Asia Pacific | China | |
| Japan | ||
| South Korea | ||
| India | ||
| Australia | ||
| Rest of Asia Pacific | ||
| Middle East and Africa | Middle East | Saudi Arabia |
| United Arab Emirates | ||
| Turkey | ||
| Rest of Middle East | ||
| Africa | South Africa | |
| Nigeria | ||
| Rest of Africa | ||
| By Product Type | Lamps | ||
| Luminaires/Fixtures | |||
| By Installation Type | New Installation | ||
| Retrofit Installation | |||
| By Application | Residential | ||
| Commercial Offices | |||
| Retail Stores | |||
| Hospitality | |||
| Industrial Facilities | |||
| Healthcare and Education | |||
| Other Applications | |||
| By Distribution Channel | Direct Sales | ||
| Wholesale Retail | |||
| E-commerce | |||
| By Geography | North America | United States | |
| Canada | |||
| Mexico | |||
| South America | Brazil | ||
| Argentina | |||
| Chile | |||
| Rest of South America | |||
| Europe | Germany | ||
| United Kingdom | |||
| France | |||
| Italy | |||
| Spain | |||
| Rest of Europe | |||
| Asia Pacific | China | ||
| Japan | |||
| South Korea | |||
| India | |||
| Australia | |||
| Rest of Asia Pacific | |||
| Middle East and Africa | Middle East | Saudi Arabia | |
| United Arab Emirates | |||
| Turkey | |||
| Rest of Middle East | |||
| Africa | South Africa | ||
| Nigeria | |||
| Rest of Africa | |||


Market Definition
- INDOOR LIGHTING - It incorporates all LED based lamps and fixtures/luminaire that are used to illuminate indoor section of residential, commercial, industrial buildings and agricultural lighting. LED offers efficient brightness with higher durability in comparison to other lighting technology.
- OUTDOOR LIGHTING - It incorporates the LED lighting fixtures that is used for illumination for exterior/outdoor illumination. For instance, LED lighting fixtures used to illuminate streets and highways, transport hubs, stadiums and other public places such as parking spaces.
- AUTOMOTIVE LIGHTING - It refers to the lighting fixtures installed for illumination and signaling purposes. It is used in both exterior and interior lighting of the vehicle. Headlamps, fog lamp, daytime running light (DRLs) are examples of exterior light whereas cabin light are interior lights.
- END USER - It refers to the end use application area where the LED fixture will be installed. For instance, in terms of indoor lighting, we have residential, commercial and industrial as end user category. For automotive lighting, primary end user considered are automotive manufacturers and aftermarket sale
| Keyword | Definition |
|---|---|
| Lumen | Lumen is a unit of luminous flux in the International System of Units that is equal to the amount of light given out through a solid angle by a source of one-candela intensity radiating equally in all directions. |
| Footcandle | A foot-candle (or foot-candle, fc, lm/ft2, or ft-c) is a measurement of light intensity. One foot-candle is defined as enough light to saturate a one-foot square with one lumen of light. |
| Colour Rendering Index (CRI) | Color Rendering Index (CRI) is a measurement of how natural colors render under an artificial white light source when compared with sunlight. The index is measured from 0-100, with a perfect 100 indicating that colors of objects under the light source appear the same as they would under natural sunlight. |
| Luminous flux | Luminous flux is a measure of the power of visible light produced by a light source or light fitting. It is measured in lumens (lm). |
| Annual Energy Cost | Annual Energy Cost means the average daily energy consumption multiplied by 365 (days per year), expressed in kilowatt hour per year (kWh/a). |
| Constant voltage drivers | Constant voltage drivers are designed for a single direct current (DC) output voltage. Most common constant voltage drivers (or Power Supplies) are 12VDC or 24VDC. An LED light that is rated for constant voltage usually specifies the amount of input voltage it needs to operate correctly. |
| Constant Current Driver | Constant current LED drivers are designed for a designated range of output voltages and a fixed output current (mA). LEDs that are rated to operate on a constant current driver require a designated supply of current usually specified in milliamps (mA) or amps (A). These drivers vary the voltage along an electronic circuit which allows current to remain constant throughout the LED system. |
| Minimum Energy Performance Standards (MEPS) | Minimum Energy Performance Standards specify the minimum level of energy performance that appliances and equipment must meet or exceed before they can supply or used for commercial purposes. |
| Luminous Efficacy | Luminous efficacy is a measurement commonly used in the lighting industry that indicates the ability of a light source to emit visible light using a given amount of power. |
| Solid State Lighting | Solid-state lighting (SSL) is a type of lighting that uses semiconductor light-emitting diodes (LEDs), organic light-emitting diodes (OLED), or polymer light-emitting diodes (PLED) as sources of illumination rather than electrical filaments, plasma (used in arc lamps such as fluorescent lamps), or gas. |
| Rated Lamp Life | Lamp life, also referred to as rated life, is the time in hours a lamp will last before a percentage of lamps will burn out. |
| Color Temperature | Colour temperature is a scale that measures how ‘warm’ (yellow) or ‘cool’ (blue) the light from a particular source is. It is measured in degrees of the Kelvin scale (abbreviated to K), and the higher the number, the ‘cooler’ the light. The lower the ‘K’ number, the ‘warmer’ the light. |
| Ingress Protection rating (IP rating) | The IP (Ingress Protection) rating of a bulb or light fixture declares the level of protection it has against dirt and water. |
| Fidelity Index | The general colour fidelity index, Rf, represents how closely the colour appearances of the entire sample set are reproduced (rendered) on average by a test light as compared to those under a reference illuminant. |
| Gamut Index | The gamut area is defined as “the area enclosed by a set of test color samples illuminated by a light source, in a two-dimensional chromaticity diagram or a plane of color space.”1 Within a defined color space, a “gamut” describes the subset of colors that can be perceived under specific lighting conditions. |
| Binning | In the lighting industry, the act of "binning" of LEDs is the process of sorting LEDs by certain characteristics, such as color, voltage, and brightness. |
| Accent lighting | Accent lighting, also called highlighting, emphasizes objects by focusing light directly on them. Accent lighting is used inside and outside the home to feature locations such as an entrance or to create dramatic effects. |
| Dimmable driver | A dimming driver has two functions: As a driver, it converts the 230V AC mains input to a low voltage DC output. As a dimmer, it reduces the amount of electrical energy flowing to the LEDs, thereby causing them to dim. |
| Flicker | Flicker is the repeated and frequent variation in the output of a light source over time. |
| Fluorescent | A property of materials defined as the ability to emit light after absorbing electromagnetic radiation such as visible or UV light. |
| Candela | The candela is the unit of luminous intensity in the International System of Units. It measures the light output per unit solid angle emitted from a light source in a specific direction. |
| LUX | Lux is used to measure the amount of light output in a given area - one lux is equal to one lumen per square meter. It enables us to measure the total "amount" of visible light present and the intensity of the illumination on a surface. |
| Uniformity (U0) | The uniformity of lighting has significant effects on visual performance in both indoor and outdoor areas. Uniformity (represented as U0) value can be found by dividing the minimum brightness (Emin) resulting from calculations according to the current lighting order, to the average brightness value (Eavg). |
| Visible Light Spectrum | The visible light spectrum is the segment of the electromagnetic spectrum that the human eye can view. More simply, this range of wavelengths is called visible light. Typically, the human eye can detect wavelengths from 380 to 700 nanometers. |
| Ambient Temperature | Ambient Temperature is the temperature of the air surrounding an electrical enclosure. |
| Current-controlled dimming control | Current-controlled dimming controls LED brightness by varying the applied current using a 0-10V dimmer. Current-controlled dimming is smooth and HD-video friendly. It can only dim to a minimum of 5% of light output. |
| Design Light Consortium | It is a partnership of energy efficiency stakeholders in the United States and Canada to “promote quality, performance and energy efficient lighting solutions for the commercial sector”. |
| Pulse Width Modulation | Pulse-width modulation, or pulse-duration modulation, is a method of controlling the average power delivered by an electrical signal. |
| Surface Mounted Device | A surface mount device (SMD) is an electronic device whose components are mounted or placed directly on the surface of a printed circuit board. |
| Alternating Current | Alternating current is an electric current which periodically reverses direction and changes its magnitude continuously with time, in contrast to direct current, which flows only in one direction. |
| Direct Current | Direct current (DC) is an electric current that is uni-directional, so the flow of charge is always in the same direction. |
| Beam Angle | Beam angle (also called beam spread) is a measure of how light is distributed. On any plane perpendicular to the centerline of the light, the beam angle is the angle between two rays where the light intensity is 50% of the maximum light intensity. |
| LED Based Solar High Mast Lighting Systems | A Solar LED High Mast Light is a raised source of High illumination lights (6~8 lights) and with high intensity on the middle of major junctions (Ring roads, Outer Ring roads), turned on or lit automatically in the absence of light (at specified timings or at periodic times, every night). |
| Surface Mounted Diode (SMD) LEDs | A surface mount diode is a type that emits light and is flat mounted and soldered onto a circuit board. |
| Chip on Board (COB) LEDs | A COB LED is basically multiple LED chips (usually 9 or more) glued directly onto a substrate by the manufacturer to form a single module. |
| Dual In-Line Package (DIP) LEDs | A dual in-line package (DIP or DIL) is an electronic component package with a rectangular case and two parallel rows of electrical connector pins. |
| Graphene LED Lights | A graphene LED light bulb is simply an LED light bulb where the filament has been coated in graphene. A graphene LED bulb is reported to be 10% more efficient than regular LED light bulbs and they are cheaper to manufacture and buy. |
| LED Corn Bulbs | LED Corn lights are designed as an energy efficient alternative to high intensity discharge (HID) and SON lamps. It uses a large number of LEDs on a metal structure to provide sufficient light. This arrangement of LEDs looks a lot like a corn cob, hence the name "corn light". |
| Per Capita Income | Per capita income or total income measures the average income earned per person in a given area in a specified year. It is calculated by dividing the area's total income by its total population. Per capita income is national income divided by population size. |
| Charging Stations | A charging station, also known as a charging station or electric vehicle utility, is a power supply that provides electrical energy for charging plug-in electric vehicles. |
| Headlight | A headlight is a light that is mounted on the front of a car and illuminates the road in front of it. Low beam and high beam LED headlights are additional categories for these LED headlights. |
| Day Time Running Light (DRLs) | A daytime running lamp is a white, yellow, or amber lighting device mounted on the front of a road-going motor vehicle or bicycle. |
| Directional Signal Light | Directional signal lights are the front and rear lights on an automobile that flash to show the direction of a turn. |
| Stop Light | A red light that is mounted to the back of a car and turns on when the brakes are used to show that the car is stopped. |
| Reverse Light | The reverse light is at the back of the vehicle to indicate its backward motion. |
| Tail Light | A red light that can be seen in the dark is mounted on the rear of a road vehicle. Stop, reverse, and directional signal lights are all part of it. |
| Fog Light | Bright lights in automobiles used to increase visibility on the road in foggy conditions or to warn other drivers of the presence of the vehicle. |
| Passenger Vehicle | A passenger vehicle is a road vehicle, other than a moped or a motorcycle, intended for the transportation of people and designed for up to 8 to 9 seats. |
| Commercial Vehicle | A commercial vehicle (Bus, Truck, Van) is any type of motor vehicle used to transport goods or pay passengers. |
| Two Wheelers (2W) | A two-wheeler is a vehicle that runs on two wheels. |
| Streets & Roadways | Both roads and streets refer to hard, flat surfaces on the ground on which vehicles, people, and animals can travel. Since streetways are usually in cities and towns, they often have houses and buildings on both sides. The roadway is in the countryside and sometimes passes through forests and fields |
| Horticulture Lighting | Horticulture is the science and art of sustainably growing, producing, marketing and using high quality, intensively cultivated food and ornamental plants. |


Research Methodology
Mordor Intelligence has followed the following methodology in all our data center reports.
- Step 1: Raw Data Collection: To understand the market, initially, all crtical data points were identified. Critical information about countries and regions of interest including Per-capita Income, Population, Automotive Production, Interest rate on Auto-Loans, Number of Automobiles on Road, Total LED Import, Lighting Electricity Consumption among others were recorded or estimated based on internal calculations.
- Step 2: Identify Key Variables: To build a robust forecasting model, key variables such as Number of Households, Automotive Production, Road Networks among others were identified. Through an iterative process, the variables required for the market forecast were set, and the model was built using these variables.
- Step 3: Build a Market Model: Based on data and critical industry trend data (variables), including LED pricing, LED penetration rate, and project macro and micor economic factors were utilized for building the market forecasting.
- Step 4: Validate and Finalize: In this crucial step, all market numbers and variables derived through an internal mathematical model were validated through an extensive network of primary research experts from all the markets studied. The respondents are selected across levels and functions to generate a holistic picture of the market studied.
- Step 5: Research Outputs: Syndicated Reports, Custom Consulting Assignments, Databases & Subscription Platforms


