
Market Overview
| Study Period | 2021 - 2031 |
|---|---|
| Forecast Data Period | 2026 - 2031 |
| Base Year Market Size (2025) | USD 16.93 Billion |
| Market Size (2026) | USD 17.47 Billion |
| Market Size (2031) | USD 20.46 Billion |
| Growth Rate (2026 - 2031) | 3.20 % |
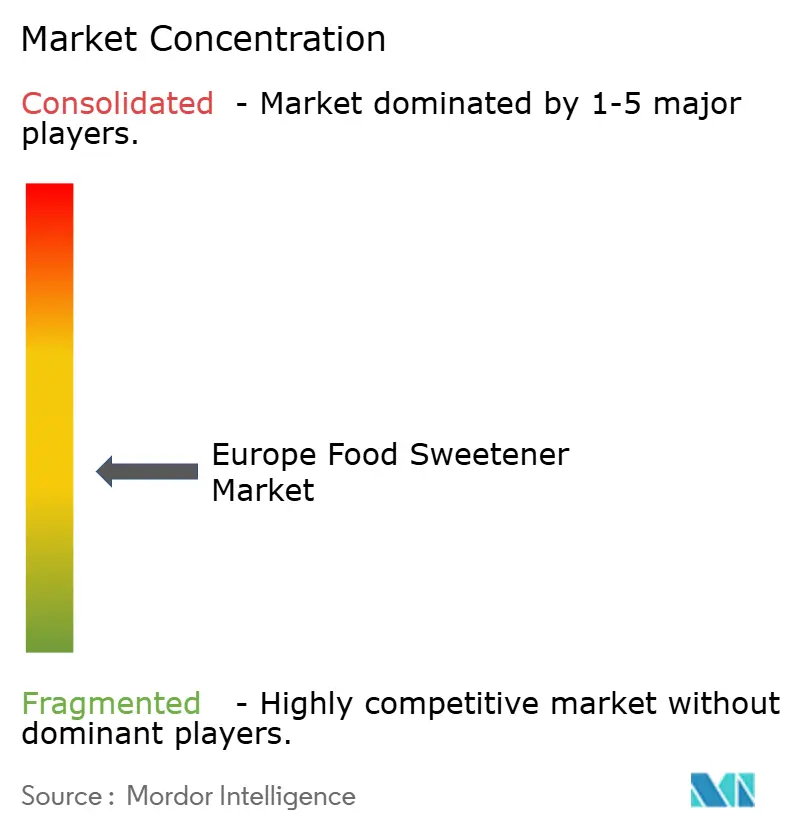
| Market Concentration | Medium |
Major Players
*Disclaimer: Major Players sorted in no particular order Image © Mordor Intelligence. Reuse requires attribution under CC BY 4.0. |
|
Europe Food Sweetener Market Analysis by Mordor Intelligence
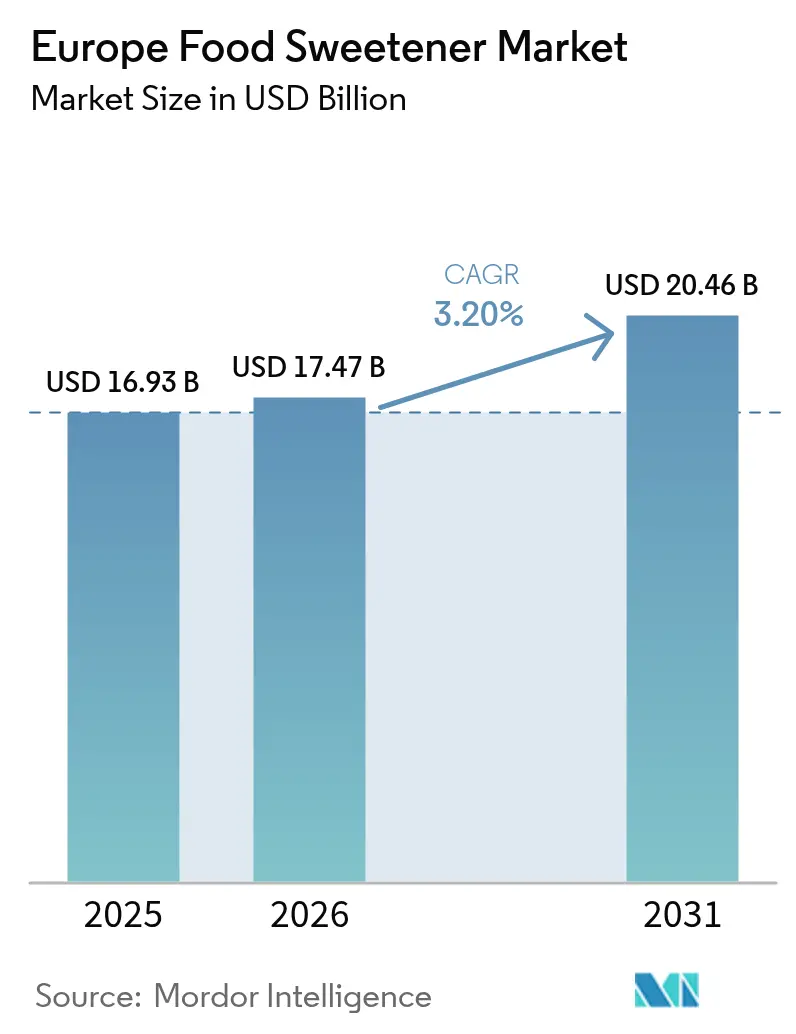
Europe food sweeteners market size in 2026 is estimated at USD 17.47 billion, growing from 2025 value of USD 16.93 billion with 2031 projections showing USD 20.46 billion, growing at 3.20% CAGR over 2026-2031. Demand is sustained by beverage and dairy reformulation, yet oversupply of beet sugar has compressed prices and forced factory closures, pushing processors to diversify into high-intensity and functional alternatives. Duty-free Ukrainian imports and record beet harvests pulled European Union sugar prices down from EUR 856 per tonne in December 2023 to EUR 541 per tonne by February 2025, squeezing refinery margins and accelerating consolidation. At the same time, stricter sugar taxes in the United Kingdom, France, Spain, and Poland are spurring producers to adopt stevia, erythritol, and next-generation sweet proteins. Precision-fermentation startups are joining incumbents such as Cargill, Tate & Lyle, Südzucker, and Ingredion in developing enzymatically modified glycosides and rare sugars, while functional sweeteners like isomalto-oligosaccharides (IMO) and human milk oligosaccharides (HMOs) gain traction for prebiotic claims. The Europe food sweeteners market is therefore balancing cost-driven down-trading in traditional sucrose against value-added growth in natural and functional segments.
Key Report Takeaways
- By product type, sucrose led with 66.58% of the Europe food sweeteners market share in 2025, while high-intensity sweeteners (HIS) are forecast to expand at a 4.62% CAGR through 2031.
- By application, food accounted for 58.64% of the Europe food sweeteners market size in 2025, whereas beverages are projected to grow at a 4.05% CAGR as soft-drink reformulation accelerates.
- By form, solid formats held 62.95% share of the Europe food sweeteners market in 2025; liquid and syrup formats are expected to advance at a 4.36% CAGR to 2031.
- By country, Germany captured 24.12% revenue share in 2025, and the Netherlands is set to record the quickest rise with a 3.61% CAGR through 2031.
Note: Market size and forecast figures in this report are generated using Mordor Intelligence’s proprietary estimation framework, updated with the latest available data and insights as of 2026.
Europe Food Sweetener Market Trends and Insights
Drivers Impact Analysis*
| Driver | (~) % Impact on CAGR Forecast | Geographic Relevance | Impact Timeline |
|---|---|---|---|
| Consumer shift toward sugar-free and diet-conscious food and beverage products | +0.8% | European Union-wide, strongest in Germany, United Kingdom, Netherlands | Medium term (2–4 years) |
| Growth in functional foods and clean-label product innovation | +0.6% | Western Europe (Germany, France, Benelux), expanding to Poland | Medium term (2–4 years) |
| Increasing adoption of natural sweeteners like stevia for premium positioning | +0.5% | Germany, Netherlands, United Kingdom, Nordic markets | Long term (≥4 years) |
| Mandatory country-specific nutrient-profile regulations | +0.4% | France (Nutri-Score), United Kingdom (HFSS), Spain, Poland | Short term (≤2 years) |
| Increasing prevalence of obesity and diabetes | +0.3% | European Union-wide, particularly Southern Europe (Italy, Spain) | Long term (≥4 years) |
| Large-scale European Union approvals of isomalto-oligosaccharide and HMOs | +0.3% | Germany, Netherlands, France (early adoption) | Medium term (2–4 years) |
| Source: Mordor Intelligence | |||
Consumer shift toward sugar-free and diet-conscious food and beverage products
Consumers in Europe are modifying their purchasing patterns in response to persistent inflation and heightened health awareness. The shift includes replacing animal proteins with more affordable carbohydrate sources and increasing demand for low-calorie sweeteners that maintain taste at a reduced cost. In 2024, France's ANSES reported that 77% of 54,000 processed foods contained sweetening ingredients [1]Source: French Agency for Food, Environmental and Occupational Health & Safety (ANSES), "Report on the Use of Sugars and Sweeteners in Processed Foods", anses.fr . However, the use of artificial sweeteners declined significantly, with aspartame presence dropping from 1.8% to 0.4%, as manufacturers transitioned to sucrose or fruit-juice concentrates, which are perceived as more natural. This reformulation trend underscores a paradox: fewer listed sweetening ingredients do not necessarily indicate lower total sugar content. Instead, brands are simplifying ingredient lists to meet clean-label preferences while preserving sweetness levels through blends of stevia, erythritol, and monk fruit. The EU-funded SWEET project, which conducted randomized controlled trials in Denmark, France, Spain, and the Netherlands, demonstrated that replacing dietary sugar with sweeteners supported long-term weight-loss maintenance and reduced cravings without increasing the risk of type-2 diabetes or cardiovascular issues over one year. Consumer perception studies within the project revealed that plant-based sweeteners, such as stevia, are viewed more positively than artificial alternatives, with health concerns being the primary reason for avoidance rather than taste or cost. In response, beverage manufacturers are launching zero-sugar products featuring stevia-erythritol blends, targeting adolescents and adults who exceed ANSES's recommended daily sugar limit of 100 grams.
Growth in functional foods and clean-label product innovation
Functional food growth and clean-label product innovation are driving demand for food sweeteners in Europe. Prebiotic sweeteners are increasingly utilized in nutraceuticals and dairy products due to their gut-health benefits, supported by regulatory approvals such as the EU Novel Foods authorization for isomalto-oligosaccharides (e.g., BENEO's Orafti® Inulin) and human milk oligosaccharides (HMOs). These developments align with the EU’s Agricultural Outlook (2024 edition), which highlights consumer preferences for lower-sugar diets and policy initiatives aimed at reducing sugar content [2]Source: European Commission, "EU Agricultural Outlook 2023-35 Report", agriculture.ec.europa.eu. Supply-side factors, including shifts in sugar beet cultivation and production trends, are influencing ingredient availability and reformulation strategies. Research published in *Chemical Senses* (November 2024) demonstrated that binary blends of rebaudioside A with erythritol and mogroside V with thaumatin synergize at the TAS1R2/TAS1R3 sweet receptor, enabling a 30–40% reduction in sweetener concentrations while maintaining sweetness and minimizing bitter TAS2R notes. This advancement is accelerating clean-label reformulations in products such as yogurt, ice cream, and protein bars, replacing sucrose and artificial sweeteners with natural alternatives. These scientific developments, combined with EU policies promoting sugar reduction, provide formulators with opportunities to utilize stable supplies of prebiotic fibers like BENEO's Orafti® Oligofructose, produced by Südzucker's BENEO division. These fibers serve as low-calorie sweeteners and prebiotic substrates, meeting the growing demand for sweeteners that also function as health-promoting ingredients, fostering market growth amid clean-label trends.
Increasing adoption of natural sweeteners like stevia for premium positioning
The adoption of natural sweeteners, such as stevia, is significantly influencing the food sweetener market in Europe. Brands are leveraging attributes like "natural," "plant-derived," and "clean-label" to enhance product positioning and justify premium pricing. Consumer preferences for reduced-sugar products without compromising taste are driving a shift from artificial sweeteners to alternatives like stevia, monk fruit, and other botanical options. This trend is particularly evident in premium beverage and yogurt launches, where stevia balances indulgence with perceived health benefits. Manufacturers are reformulating existing product lines to replace artificial sweeteners like aspartame or sucralose with stevia blends that improve taste performance, reinforcing the narrative of premium, health-conscious offerings. Stevia’s compatibility with fruit-based flavor systems has made it a preferred ingredient for developing new products, including juices, flavored waters, and wellness drinks. Ingredient suppliers are responding with advanced stevia solutions, such as Cargill’s Truvia® stevia leaf extract, which provides improved sweetness profiles tailored for high-end applications. These innovations enable brands to differentiate by combining natural ingredients with reduced-sugar claims, offering a competitive advantage in premium retail segments. This trend aligns with Europe’s growing focus on clean-label products, positioning plant-based sweeteners as a key element in reformulation strategies and highlighting their role as value-driving components for premium brand positioning.
Increasing prevalence of obesity and diabetes
The rising prevalence of obesity and diabetes is driving significant changes in the European sweetener market, as public health authorities intensify efforts to reduce sugar consumption in response to increasing metabolic health risks. Projections indicate a decline in per-capita sugar consumption in Europe over the next decade, with OECD-FAO attributing this trend to sustained campaigns addressing obesity and type-2 diabetes, which are influencing both consumer preferences and industry reformulation. WHO/Europe’s 2024 findings reveal that nearly 60% of adults in the region are overweight or obese, underscoring the urgency for lower-sugar dietary patterns [3]Source: World Health Organization, "The Challenge of Obesity - Europe", who.int . This shift has led to growing demand for low-calorie sweeteners in products such as breakfast cereals, yogurts, and soft drinks. Scientific validation is reinforcing this trend, as evidenced by the EU-funded SWEET project’s one-year randomized controlled trial, which demonstrated that substituting sugar with sweeteners supports weight-loss maintenance and reduces sweet-food cravings without adverse metabolic effects. Southern Europe, particularly Italy and Spain, faces higher obesity rates and historically lower sweetener adoption compared to Northern Europe, creating opportunities for growth as awareness increases and sugar taxes are implemented. Ingredient suppliers, such as Tate & Lyle with its Dolcia Prima® allulose, are enabling manufacturers to reduce sugar content while maintaining product quality, accelerating the adoption of low-calorie sweeteners as both a public health initiative and a commercial opportunity.
Restraints Impact Analysis*
| Restraint | (~) % Impact on CAGR Forecast | Geographic Relevance | Impact Timeline |
|---|---|---|---|
| Higher costs of natural sweeteners compared to traditional options | -0.5% | European Union-wide, particularly price-sensitive Southern and Eastern Europe | Medium term (2–4 years) |
| Regulatory complexities and varying EU country rules on labeling and approvals | -0.3% | Pan-European, acute in United Kingdom post-Brexit and France (Nutri-Score) | Short term (≤2 years) |
| Neonicotinoid ban-driven beet yield risk | -0.2% | Germany, France, Poland, Czech Republic (major beet regions) | Long term (≥4 years) |
| Concerns over long-term health effects of artificial sweeteners | -0.2% | Western Europe (Germany, United Kingdom, Netherlands), lower in Eastern Europe | Medium term (2–4 years) |
| Source: Mordor Intelligence | |||
Higher costs of natural sweeteners compared to traditional options
The scalability of natural sweeteners remains constrained due to their higher costs compared to traditional options. Ingredients such as stevia, monk fruit, and erythritol often carry a price premium of 2-4 times over sucrose, making them less viable in cost-sensitive categories like sauces, dressings, spreads, and mainstream confectionery. This cost disparity has been further exacerbated by a sharp decline in European Union sugar prices. For example, Südzucker reported revenue declines and operating losses in its sugar segment as prices dropped from EUR 856 per tonne in December 2023 to EUR 541 per tonne by February 2025, widening the affordability gap between sucrose and natural sweeteners. Price compression has enhanced sucrose’s competitiveness in industrial bakery and beverage applications, where procurement decisions prioritize cost per kilogram over clean-label attributes. Deflationary trends are also evident in starch-derived sweeteners, with AGRANA’s starch segment experiencing an 11.7% revenue decline in 2024/25 due to falling commodity costs. These reductions led to a 25% drop in bioethanol prices and a 40% decline in vital gluten prices, which subsequently lowered the prices of glucose syrups and maltodextrin. The widening cost differential is particularly significant in Eastern and Southern Europe, where lower household incomes amplify consumer price sensitivity. While suppliers like Ingredion offer premium natural alternatives, such as Reb M–M-based stevia solutions, adoption remains limited as manufacturers weigh clean-label benefits against the affordability of traditional sweeteners.
Neonic ban-driven beet yield risk
The Europe sugar industry faces structural challenges due to the ban on neonicotinoid seed treatments, which has increased the vulnerability of sugar-beet crops to virus yellows and pest pressure, leading to a higher risk of yield volatility. This uncertainty poses significant risks for beet processors, who depend on consistent crop volumes to sustain efficient production, potentially tightening regional sucrose supply during unfavorable growing seasons. For sugar producers already contending with price fluctuations and margin pressures, this added supply-side instability complicates operations and decision-making. Manufacturers remain cautious about transitioning from low-cost sucrose to higher-priced natural alternatives, as any shortfall in beet-based sugar production could further widen the cost gap between conventional and natural sweeteners. Rising sucrose prices due to scarcity would create a complex procurement environment, forcing food and beverage brands to balance supply security with cost management, particularly in sugar-intensive categories like bakery, dairy desserts, and beverages, where even small price changes can significantly impact overall costs. In response, ingredient suppliers are diversifying their offerings and focusing on resilience, with solutions such as DSM-Avansya’s EVERSWEET® Reb M stevia sweetener providing a premium yet stable alternative. The agronomic implications of the neonic ban underscore the broader market tension between regulatory pressures, supply reliability, and the economics of sweetener selection across Europe.
*Our forecasts treat driver/restraint impacts as directional, not additive. The impact forecasts reflect baseline growth, mix effects, and variable interactions.
Segment Analysis
By Product Type: Sucrose Dominance Masks Structural Shift to HIS
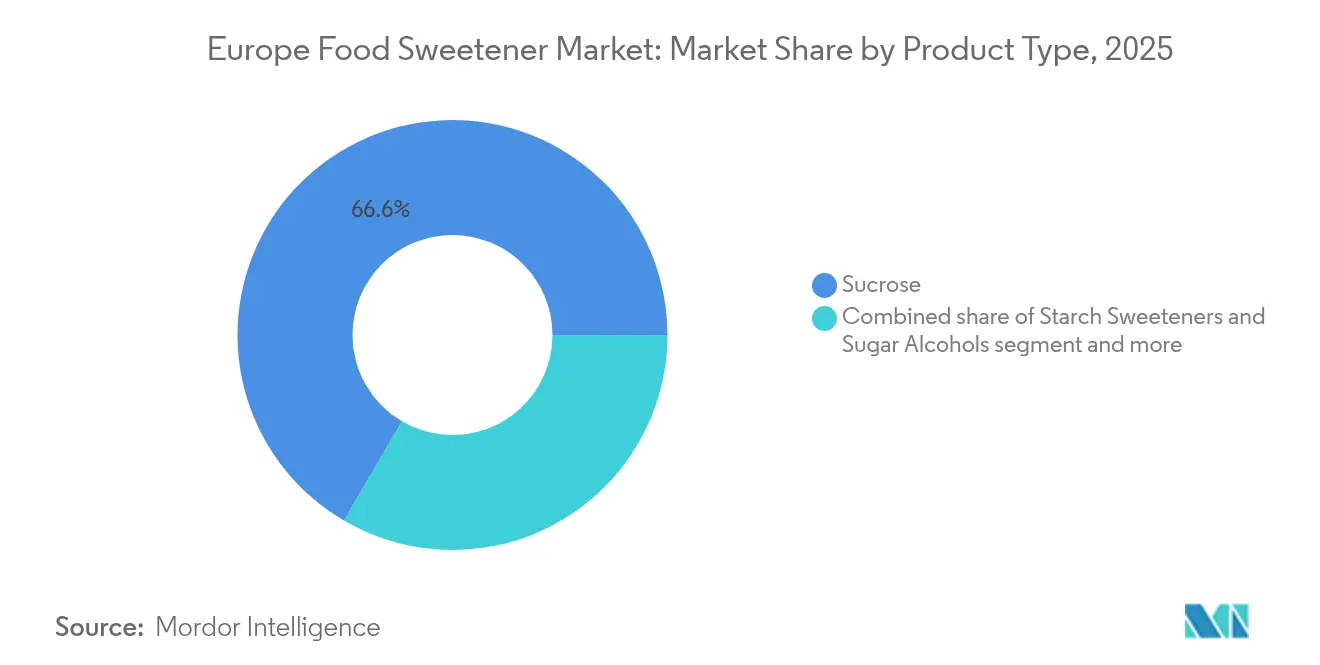
Sucrose is projected to maintain a 66.58% market share in 2025, underscoring its entrenched role in bakery, confectionery, and industrial food processing. However, the market is witnessing a shift toward high-intensity sweeteners (HIS), which are expected to grow at a compound annual growth rate (CAGR) of 4.62% through 2031, driven by sugar-reduction initiatives in beverages and functional foods. Starch sweeteners and sugar alcohols remain relevant, with sorbitol and xylitol supporting sugar-free confectionery, while maltodextrin continues as a bulking agent in sports nutrition and infant formula. Stevia leads growth within HIS, supported by enzymatic conversion technologies that produce Reb M and Reb D with superior sensory performance. Research highlights Reb M’s 34-micromolar activation threshold and its ability to avoid bitter TAS2R pathways, accelerating its adoption as consumer skepticism grows around sucralose and aspartame. For instance, ANSES data from France shows declining aspartame usage, with brands shifting toward stevia and fruit-juice concentrates.
Supply-side factors are reshaping sucrose’s competitive position. EU sugar prices dropped from EUR 856/tonne in December 2023 to EUR 541/tonne by February 2025, driven by strong beet harvests and duty-free Ukrainian imports under the June 2024 cap. This price decline reinforces sucrose’s cost advantage as manufacturers evaluate the premium pricing of HIS solutions. Starch-derived sweeteners like dextrose and High Fructose Corn Syrup (HFCS) face structural constraints in Europe, with OECD-FAO projecting HFCS per-capita consumption at just 1.2 kg by 2033 due to regulatory and consumer preferences for sucrose. These dynamics ensure sucrose’s short-term dominance, even as HIS gains traction. Ingredient suppliers, such as PureCircle by Ingredion, are positioning to meet the rising demand for natural and high-performance HIS as sugar-reduction efforts intensify.



By Application: Beverage Reformulation Outpaces Food Innovation
Food applications represented 58.64% of the food sweetener market in 2025, while beverages are expected to grow at a faster 4.05% CAGR through 2031. This growth is driven by regulatory measures such as the United Kingdom's HFSS rules and Poland’s 2024 sugar tax, which have accelerated reformulation efforts. Soft drink and sports drink manufacturers are increasingly adopting stevia-erythritol systems and acesulfame-K to achieve zero-sugar profiles. While soft drinks dominate in volume, sports drinks are expanding rapidly as fitness-conscious consumers demand electrolyte-rich, low-calorie hydration. Synergies between sweetener combinations like sucralose + Ace-K and Reb A + erythritol, enabling 30–40% sweetener reduction, are critical for maintaining taste and controlling costs. Ingredient suppliers, such as Sweegen with its Bestevia® Reb M solutions, play a key role in supporting reformulation efforts for cleaner profiles without sensory compromise.
In food categories, bakery and confectionery lead by volume, but nutraceuticals and functional foods are the fastest-growing segments, driven by prebiotic sweeteners like isomalto-oligosaccharides and HMOs following EU Novel Foods approval. Investments such as Nutricia’s PLN 230 million Opole plant expansion highlight the rising demand for therapeutic and infant-nutrition products. Dairy and dessert manufacturers are adopting stevia–erythritol blends for low-sugar yogurts and ice creams, while sauces and spreads remain constrained by cost structures favoring sucrose or glucose syrups. These trends reflect how economic factors and regulatory pressures shape sweetener choices, with premium innovations concentrated in beverages and functional foods.
By Form: Liquid Blends Gain Share in Industrial Channels
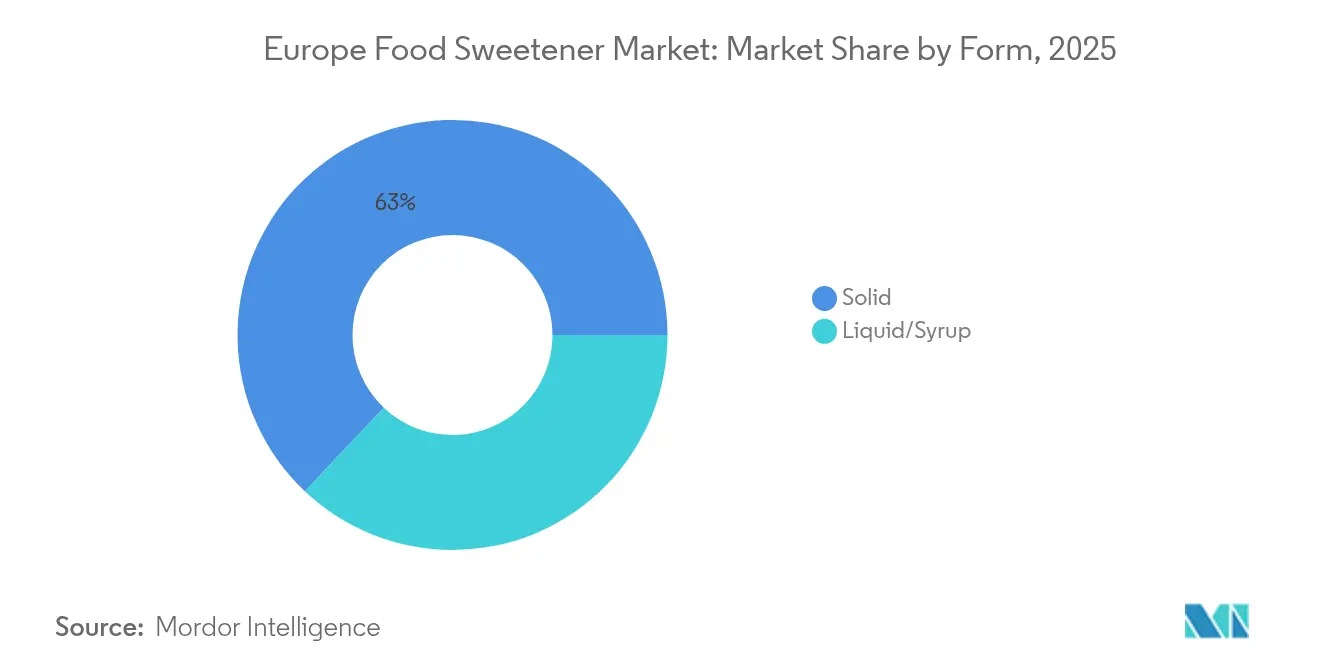
Solid sweeteners held a 62.95% market share in 2025, including granulated sucrose, crystalline stevia, and powdered polyols, which are widely utilized in bakery, confectionery, and tabletop applications. However, liquid and syrup-based sweeteners are expected to grow at a faster CAGR of 4.36% through 2031, driven by industrial manufacturers adopting ready-to-use systems that enhance processing efficiency. Liquid glucose syrups, HFCS, and liquid stevia extracts eliminate the dissolution step required for solid sweeteners, reducing processing time and energy consumption in high-volume operations. This is particularly advantageous in the beverage industry, where liquid stevia ensures precise dosing and minimizes batch variability during rapid bottling processes. The shift toward liquid blends aligns with industrial priorities such as consistency and speed, particularly in large Western European manufacturing hubs. As automation expands in these facilities, the adoption of liquid sweeteners continues to rise, benefiting ingredient suppliers like Tate & Lyle with its liquid TASTEVA® stevia solutions.
While liquid formats gain traction in industrial applications, solid sweeteners remain dominant in retail and foodservice channels, where consumers prefer familiar options like granulated sucrose and tabletop sweeteners, including saccharin, aspartame, and stevia, for portion control. Powdered erythritol and xylitol are essential in sugar-free confectionery and gum, though Germany’s BfR labeling requirements on laxative effects limit their broader market use. Crystalline fructose, distributed by global traders such as Czarnikow, serves niche applications in sports nutrition and diabetic-friendly products due to its lower glycemic index. Regional differences also influence format preferences, with Western Europe favoring liquid sweeteners due to concentrated industrial production, while Eastern Europe relies more on solid formats due to smaller-scale operations and limited investment in liquid-handling infrastructure. Companies like BENEO, offering both solid and liquid functional ingredients such as inulin and oligofructose, are well-positioned to address these diverse regional demands.
Geography Analysis
Germany maintained a significant 24.12% share of the Europe food sweetener market in 2025, driven by Südzucker’s extensive factory network and BASF’s integration into specialty intermediates for pharmaceutical and nutraceutical sweeteners. Industrial demand in Germany remains concentrated in bakery, confectionery, and beverage manufacturing, where cost efficiency and supply security favor sucrose and glucose syrups over premium natural high-intensity sweeteners (HIS). Despite challenges such as the neonicotinoid ban impacting beet yields, with AGRANA’s 2024 campaign reporting a historic low sugar content of 14.6% due to Cercospora outbreaks, Germany continues to lead as Europe’s largest beet-sugar producer. Nordzucker and Südzucker ensure domestic production capacity, reinforcing Germany’s role as a stabilizing force in the regional supply chain. BASF’s Sweetener Intermediates portfolio further supports value-added segments aligned with Germany’s strong nutraceutical and pharmaceutical industries.
The Netherlands is positioned as the fastest-growing major market, with a projected CAGR of 3.61% through 2031. Rotterdam’s port logistics establish the country as a central hub for re-export and distribution of refined sweeteners, specialty blends, and imported raw materials. Global trader Czarnikow, managing over 7 million MT of agriproducts annually, strengthens this position by handling sucrose, molasses, HFCS, glucose syrups, and HIS such as acesulfame-K, sucralose, aspartame, and xylitol. Domestic demand for natural sweeteners is rising, particularly in dairy and functional foods, as manufacturers incorporate stevia and erythritol into yogurts, cheeses, and plant-based formulations. Proximity to processing clusters in Germany and Belgium enhances just-in-time delivery models, reducing inventory burdens. Czarnikow’s 2024 Vendor Managed Inventory (VMI) rollout further supports efficiency, enabling producers to focus on innovation while outsourcing procurement and logistics.
Other key markets, including the United Kingdom, Italy, France, Spain, and Poland, reflect diverse regulatory and consumer dynamics shaping sweetener adoption. The United Kingdom's post-Brexit divergence from EFSA regulations has slowed the introduction of novel sweeteners like allulose and mogroside V. France’s Nutri-Score labeling and sugar tax have accelerated beverage reformulation, while Italy and Spain present growth opportunities due to higher obesity rates and historically lower sweetener penetration. Belgium and Sweden play specialized roles, with Belgium hosting Tereos’s refining facilities and Sweden showing strong demand for sugar-free confectionery and gum. Sustainability initiatives, such as Nordzucker’s biomethane-powered production in Denmark, are influencing procurement decisions as manufacturers seek lower-carbon sweetener supply chains across Europe.
Regulatory Landscape
Food sweeteners in Europe are regulated primarily under Regulation (EC) No 1333/2008 on food additives, under which sweeteners must be listed at the Union level and are subject to EFSA-led re-evaluation. In February 2026, EFSA concluded that sucralose (E 955) remains safe for currently authorised uses (ADI 15 mg/kg body weight/day), but it could not confirm safety for proposed extensions into fine bakery wares due to potential formation of chlorinated compounds during high-temperature processing, a consideration for industrial bakery reformulation.
Regulatory actions in 2026 also tightened compliance requirements and trade conditions that affect both high-intensity sweeteners and sugar-based ingredients. The European Commission adopted Regulations (EU) 2026/189 and 2026/196 to revise specifications and maximum levels for several additives, with a particular focus on products for vulnerable populations (including infants and foods for special medical purposes), increasing the need for specification and supplier-documentation checks. Separately, the Commission initiated a partial interim review of anti-dumping measures for aspartame imports from China (March 2026), while Implementing Regulation (EU) 2026/1124 suspended inward processing arrangements for certain raw cane sugar codes for 12 months (until May 2027), adding another variable for import-dependent supply planning.
Value Chain Analysis
The Europe food sweetener value chain begins with agricultural and industrial feedstocks (sugar beet and cane for sucrose, and cereals for starch-derived sweeteners) and moves into processing and refining by large integrated groups and specialty ingredient suppliers. Major regional processors such as Suedzucker and Tereos anchor sucrose and starch-sweetener production, while global ingredient companies, including Cargill, Tate and Lyle, and Ingredion, supply high-intensity sweeteners, polyols, and application systems for beverage, dairy, bakery, and nutraceutical formulations.
Downstream, sweeteners are distributed through traders and distributors into food and beverage manufacturers, with increasing emphasis on formulation services, blended systems (solid and liquid), and documentation to meet additive specifications and labeling rules. Collaboration also shows up upstream in sustainability and innovation programs, such as Suedzucker and Nestle working on regenerative farming initiatives (started in 2020) that connect agricultural practices to ingredient sourcing requirements. For newer sweetener modalities, the chain extends into biotech inputs and contract or in-house fermentation capabilities, but market access still hinges on EFSA opinions and the Union list under Regulation (EC) No 1333/2008, which affects timelines and investment decisions for novel sweeteners.
Competitive Landscape
The market for food sweeteners in Europe is characterized by moderate fragmentation, with large multinational companies maintaining significant influence alongside regional specialists and emerging players. Leading companies such as Cargill, Incorporated, Tate & Lyle PLC, Südzucker, and Ingredion Incorporated are heavily investing in enzymatic and fermentation-based technologies to produce refined glycosides like Reb M and Reb D. These advancements cater to the growing demand for improved taste and clean-label products, enabling the production of high-intensity sweeteners (HIS) with superior sensory performance. This innovation supports their application in sensitive categories such as dairy desserts and zero-sugar beverages, where issues like bitterness or aftertaste are critical concerns.
Recent industry trends underscore the competitive dynamics within the market. For example, Cargill, through its joint venture with DSM-Firmenich, and Tate & Lyle have scaled up production and commercialization of next-generation stevia sweeteners. Products such as Cargill’s EverSweet and Tate & Lyle’s TASTEVA® are specifically designed for clean-label, low-calorie formulations. These innovations enable food and beverage manufacturers across Europe to achieve sugar reduction without compromising on taste, texture, or stability. Such developments reinforce the competitive advantage of established players in a market increasingly influenced by health-conscious consumers, regulatory requirements, and shifting preferences.
At the same time, regional specialists and precision-fermentation startups contribute to a highly competitive environment. These smaller players often focus on niche or emerging sweetener technologies, including novel glycosides, alternative sugar alcohols, and rare-sugar pathways. Their agility and innovation push larger incumbents to continuously evolve to maintain market share. As the demand for cleaner labels and lower-calorie products grows, the industry faces the challenge of balancing taste quality, cost efficiency, and supply chain resilience. While large companies leverage their scale and research capabilities, smaller players drive innovation with advanced sweetener solutions.
Europe Food Sweetener Industry Leaders
-
Cargill Incorporated
-
Südzucker Group
-
Tereos S.A.
-
Tate & Lyle PLC
-
Archer Daniels Midland Company
- *Disclaimer: Major Players sorted in no particular order

Market Opportunities and Future Outlook
A key whitespace in Europe is scalable, clean-label sweetness that reduces sugar while staying within the taste, labeling, and thermal-processing constraints faced by some established additives in particular applications. EFSA's February 2026 statement that it could not confirm safety for proposed extensions of sucralose (E 955) into fine bakery wares under high-temperature processing points suppliers toward bakery reformulation support using alternative systems (such as stevia glycosides, polyol blends, fibers, and process-adapted sweetener platforms) that avoid the same use extension pathway.
Authorization and investment signals also keep attention on higher-value functional and next-generation sweeteners that combine sweetness with health positioning. In June 2026, the EU authorized inulin-propionate ester as a novel food via Implementing Regulation (EU) 2026/1219, with proprietary data protection through June 30, 2031, reinforcing innovation routes for functional sweetening and fiber-based systems. On the supply and technology side, the January 2026 EFSA positive opinion on a modified manufacturing process for enzymatically produced steviol glycosides (E 960c) using newly developed production strains supports broader industrialization of next-generation stevia, aligning with ongoing beverage and dairy reformulation activity across Europe. Taken together, these developments create room for ingredient suppliers and manufacturers to build differentiated portfolios in functional foods, reduced-sugar beverages, and specialized nutrition where regulatory compliance and processing performance drive selection.
Recent Industry Developments
- May 2026: Suedzucker published its fiscal year 2025/26 results and maintained its group revenue outlook for 2026/27, keeping attention on how sugar price compression is reshaping European sweetener economics. The update reinforced the ongoing pivot toward portfolio resilience, including value-added ingredients alongside traditional sugar operations.
- September 2025: Avantium, LVMH, and Tereos signed a memorandum of understanding to form a strategic alliance to scale production of plant-based materials and bio-based products at a European facility. This move signals broader diversification of sugar groups into bio-based platforms and higher-value industrial applications linked to carbohydrate feedstocks.
- October 2024: Tate and Lyle and Manus announced The Natural Sweetener Alliance to expand access to natural sugar-reduction solutions, launching with a stevia Reb M ingredient positioned for large-scale commercialization. The partnership strengthened supply options for next-generation stevia in Europe as beverage and dairy manufacturers accelerate reformulation away from higher-sugar recipes and certain artificial sweeteners.


Research Methodology Framework and Report Scope
Market Definition and Coverage
For this study, the Europe food sweeteners market is defined as the value of sweetening ingredients sold for use in food and beverage manufacturing across Europe, including bulk sweeteners and high-intensity options in solid or liquid form.
Scope exclusions: We exclude tabletop retail sweetener packs and non-food uses such as pharmaceuticals, personal care, and industrial fermentation inputs when they are not used for food and beverage sweetening.
Segmentation Overview
-
By Product Type
- Sucrose
-
Starch Sweeteners and Sugar Alcohols
- Dextrose
- High Fructose Corn Syrup (HFCS)
- Maltodextrin
- Sorbitol
- Xylitol
- Other Product Types
-
High Intensity Sweeteners (HIS)
- Sucralose
- Aspartame
- Saccharin
- Cyclamate
- Ace-K
- Neotame
- Stevia
- Other High Intensity Sweeteners (HIS)
-
By Application
-
Food
- Bakery and Confectionery
- Dairy and Desserts
- Meat and Savory Products
- Nutraceuticals and Functional Foods
- Sauces, Dressings and Spreads
- Other Processed Foods
-
Beverages
- Soft Drinks
- Sport Drinks
- Other Beverages
-
Food
-
By Form
- Solid
- Liquid/Syrup
-
By Country
- Germany
- United Kingdom
- Italy
- France
- Spain
- Netherlands
- Poland
- Belgium
- Sweden
- Rest of Europe
Data Sources, Market Sizing, and Validation
Desk Research
Desk research was used to build the base structure of the market and to anchor country level demand signals. We relied on public sources such as Eurostat for production and trade series, FAOSTAT for commodity and sugar balance context, and European Commission publications covering sugar policy and agri-food outlook.
We also reviewed sources such as national statistics offices, customs and tariff schedules for sweetener related trade codes, and EFSA documents that explain approvals and usage conditions for certain sweeteners. Company annual reports, investor presentations, and reputable industry press were used to understand pricing direction and capacity additions, and then a paid subscription for company financials and an import and export shipment level database were used selectively to confirm scale and routing patterns. The sources listed here are illustrative only, and many other public documents and references were checked for data collection, validation, and clarification.
Primary Interviews and Surveys
Primary work was used to pressure-test the desk assumptions that most often move the number, such as mix shifts between sucrose and high-intensity sweeteners, contract pricing behavior, and substitution linked to reformulation. We spoke with people across ingredient supply, distribution, and food and beverage procurement roles, and then insights were compared across major consuming countries in Western, Northern, and Central Europe so we could separate local dynamics from region-wide trends.
Distribution of primary research fieldwork respondents
| Company type | Respondent position |
|---|---|
| Top tier: 28% | CXOs: 13% |
| Mid tier: 53% | Functional/Unit leaders: 32% |
| Smaller Players: 19% | Managers: 55% |
Market-Sizing & Forecasting
The market size was first reconstructed using a top-down approach where regional consumption is built from country-level supply, trade flows, and food and beverage output indicators, and then converted into value using price and mix assumptions by sweetener group. We then cross-checked totals through selective bottom-up approximations, like sampled supplier revenue exposure to Europe, channel checks, and volume-by-application logic, and gaps were adjusted when the two views did not reconcile.
Key inputs that shaped the model included sugar and sweetener price trends, import and export movements for relevant sweetener codes, food and beverage manufacturing output by country, reformulation activity driven by sugar reduction programs, and category mix changes (such as beverages and bakery). For forecasting, scenario analysis was used to reflect different paths for sugar pricing, adoption of high-intensity sweeteners, and regulatory or labeling changes, and the preferred scenario was aligned to what most interviewees described as the most likely outlook. Where data was thin for smaller countries or niche sweeteners, we used proxy indicators like production capacity signals and trade intensity, and then normalized results to avoid overcounting within Europe.
Data Validation & Update Cycle
Results were validated by comparing model outputs against independent signals such as country trade balances, reported production levels, and practical checks on price ranges by sweetener type. When large jumps appeared, we rechecked units, currency timing, and mix assumptions, and then a second analyst review was used to confirm that changes were explainable and consistent with market events.
Reports are refreshed annually, and interim updates are made when material events change pricing, regulation, or supply availability. Before delivery, a fresh pass is completed so the final output reflects the latest public releases and any newly confirmed primary inputs.
Mordor Intelligence's Europe Food Sweetener Market Market Size Versus Other Published Estimates
Published market sizes for Europe food sweeteners can look far apart because the studies do not always count the same products, years, and pricing logic. Differences usually come from what is included as a sweetener, how much of retail and non-food demand is blended in, and whether values are reported at manufacturer level prices or at a later point in the value chain.
Some estimates fold in a wider set of sweetening ingredients and sometimes capture retail tabletop products or adjacent specialty syrups beyond typical industrial usage. In Mordor Intelligence, the market value is counted for food and beverage applications only, and it follows a consistent product grouping and country coverage so mix and pricing do not get double-counted across categories.
Benchmark comparison
| Source | Market Size | Gaps in Research Methodology |
|---|---|---|
| Mordor Intelligence | USD 16.93 B (2025) | |
| Regional Consultancy A | USD 23.42 B (2024) | Uses a different base year and appears to include a broader set of sweetener types and applications, which can lift totals when retail packs or adjacent syrups are blended with industrial demand. |
| Industry Databook B | USD 15.18 B (2025) | Shows a narrower revenue pool in the base year, likely driven by product-scope filtering and revenue accounting choices that reduce value captured from starch sweeteners and sugar alcohols in food processing. |
The spread in the table is mainly explained by scope breadth and where pricing is captured in the chain, and then amplified by base-year selection. By keeping the demand pool tied to food and beverage usage and checking it against trade and production signals, our estimate stays easier to trace back to observable variables and repeatable steps.


Key Questions Answered in the Report
How large is the Europe food sweeteners market in 2026?
It stands at USD 17.47 billion and is forecast to reach USD 20.46 billion by 2031.
Which segment is growing fastest within European sweeteners?
High-intensity sweeteners, especially stevia-based products, are projected to rise at a 4.62% CAGR through 2031.
Why are liquid sweeteners gaining popularity among manufacturers?
Ready-to-use liquid projected to rise at a 4.36% CAGR through 2031 formats cut dissolution time, save energy, and improve dosing accuracy in large-scale beverage and bakery processing.
What regulatory factors influence sweetener demand in Europe?
Sugar taxes in France, the United Kingdom, Spain, and Poland, plus front-of-pack labeling schemes like Nutri-Score and HFSS, push brands toward reduced-sugar formulations.
Page last updated on:


 Your data is secure and never sold or shared.


