Europe Defense Logistics Market Size and Share
Market Overview
| Study Period | 2020 - 2031 |
|---|---|
| Forecast Data Period | 2026 - 2031 |
| Historical Data Period | 2020 - 2024 |
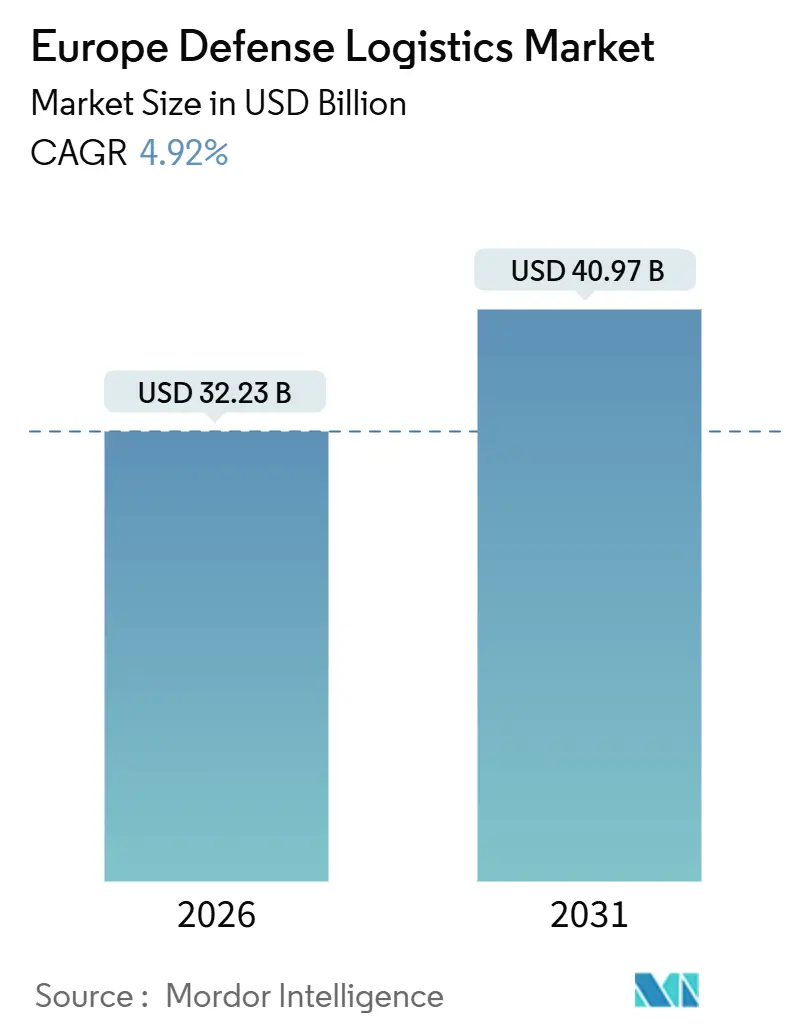
| Market Size (2026) | USD 32.23 Billion |
| Market Size (2031) | USD 40.97 Billion |
| Growth Rate (2026 - 2031) | 4.92% CAGR |
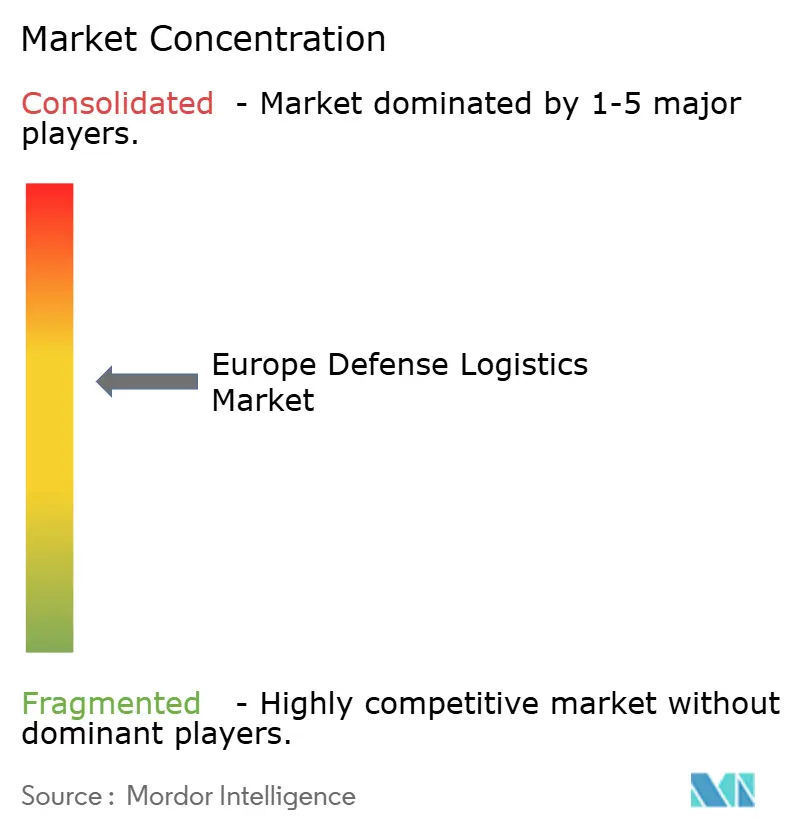
| Market Concentration | Medium |
Major Players *Disclaimer: Major Players sorted in no particular order Image © Mordor Intelligence. Reuse requires attribution under CC BY 4.0. | |
Europe Defense Logistics Market Analysis by Mordor Intelligence
The Europe Defense Logistics Market size is estimated at USD 32.23 billion in 2026, and is expected to reach USD 40.97 billion by 2031, at a CAGR of 4.92% during the forecast period (2026-2031).
This steady rise in market size is propelled by the European Commission’s Rearm Europe initiative, a joint-procurement program that is reshaping cross-border sustainment networks. Key opportunities stem from the shift toward alliance-wide logistics frameworks that reduce duplication, increase unit-level readiness, and foster common technical standards. Demand is further amplified by accelerated modernization plans across Eastern and Western Europe, ongoing replenishment of ammunition stocks, and the rapid rollout of digitized supply-chain platforms. Expanded outsourcing to commercial third-party logistics providers (3PLs and 4PLs) is boosting competition, while large-scale mergers such as the DSV-DB Schenker deal are redefining market boundaries. Value-added services such as kitting, labeling, and predictive analytics are recording the strongest gains as ministries prioritize speed, resilience, and transparency in contested environments.
Key Report Takeaways
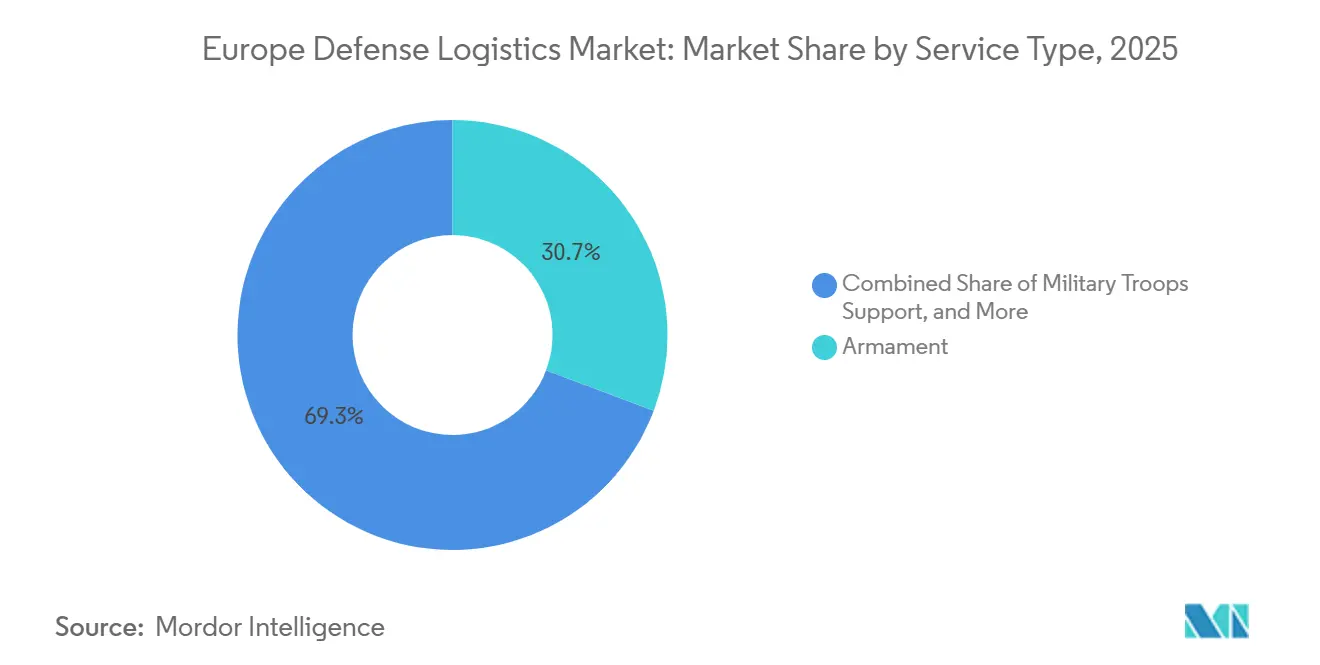
- By service type, armament services held 30.73% of Europe's defense logistics market share in 2025, while technical support and maintenance are forecast to expand at a 7.27% CAGR through 2031.
- By logistics function, transportation accounted for 69.78% of the European defense logistics market size in 2025, and value-added services are projected to grow at an 8.38% CAGR to 2031.
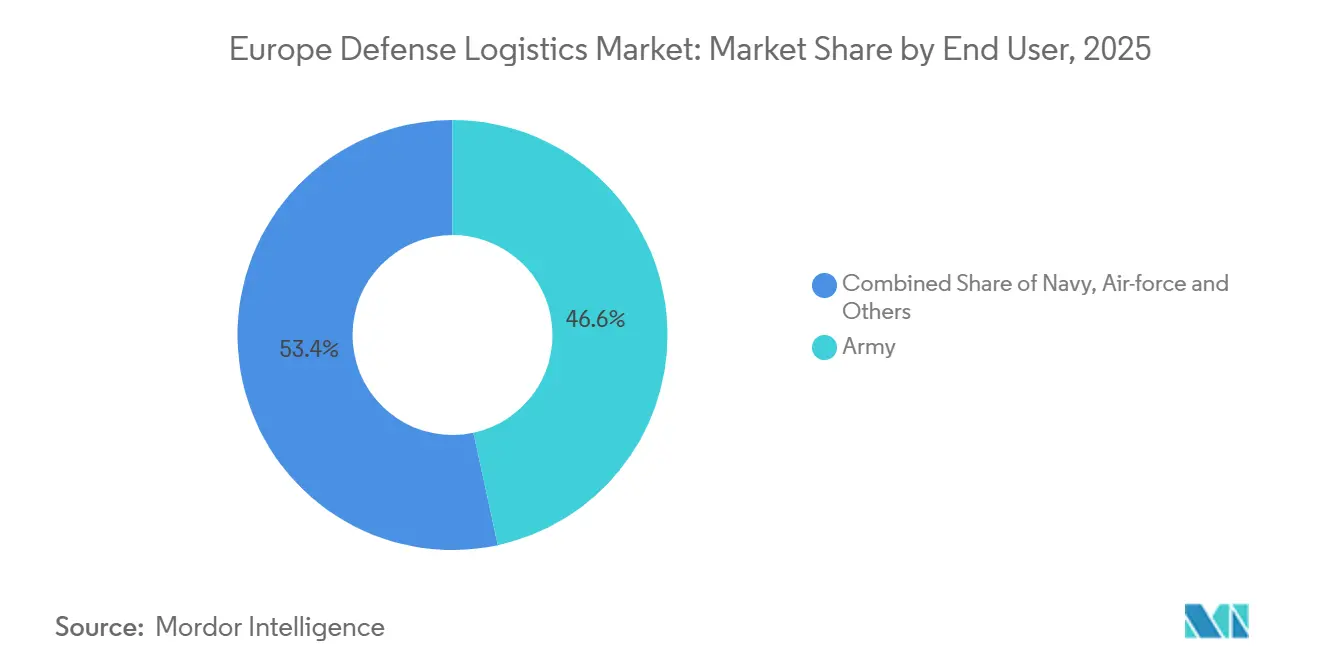
- By end user, the army segment commanded 46.63% of Europe's defense logistics market share in 2025, whereas the air force segment is advancing at a 6.62% CAGR through 2031.
- By country, the United Kingdom led with an 18.75% revenue share in 2025, while Poland is forecast to expand at an 8.32% CAGR to 2031.
Note: Market size and forecast figures in this report are generated using Mordor Intelligence’s proprietary estimation framework, updated with the latest available data and insights as of January 2026.
Europe Defense Logistics Market Trends and Insights
Drivers Impact Analysis*
| Driver | (~) % Impact on CAGR Forecast | Geographic Relevance | Impact Timeline |
|---|---|---|---|
| Surge in EU and NATO joint procurement frameworks | +1.1% | EU member states, NATO allies | Medium term (2–4 years) |
| Acceleration of digitized supply-chain platforms | +0.9% | Advanced NATO economies | Long term (≥ 4 years) |
| Increased outsourcing to European 3PL and 4PL providers | +0.7% | Western Europe, expanding eastward | Long term (≥ 4 years) |
| Increasing security concerns in the region | +1.0% | Eastern Europe, Baltic states | Short term (≤ 2 years) |
| Rapid military modernization programs | +0.8% | Poland, Germany, the UK, and France | Medium term (2–4 years) |
| Multinational defense collaborations | +0.5% | NATO member states, EU initiatives | Long term (≥ 4 years) |
| Source: Mordor Intelligence | |||
Surge in EU and NATO Joint Procurement Frameworks
The European Defense Industrial Strategy sets a binding goal that 50% of defense purchases be collaborative by 2030, with 60% sourced from European suppliers. Pooling demand allows ministries to standardize platforms, cut acquisition costs by as much as 20%, and simplify downstream logistics. The European Defense Agency recently brokered a EUR 550 million (USD 642 million) joint ammunition purchase that demonstrated the financial and operational leverage of coordinated buying. These frameworks push logistics providers to develop pan-European footprints, favor large contractors with multi-national clearance, and streamline technical training across fleets. Suppliers able to certify technicians for multiple allied operators capture incremental revenue and boost equipment availability.
Acceleration of Digitized Supply-Chain Platforms Across European Forces
European militaries are fielding artificial-intelligence-enabled software that replaces manual tracking with real-time inventory visibility. NATO’s order for Palantir’s Maven Smart System shows a clear preference for data-centric decision tools capable of integrating logistics metrics with battlefield intelligence[1]Army Recognition, “NATO Orders Palantir Maven Smart System,” armyrecognition.com. Predictive maintenance platforms such as Lockheed Martin’s Herc Fusion have achieved 15% fuel savings and a 3% mission capability jump on test fleets. Contractors that can demonstrate higher mission-ready rates through advanced analytics win long-term performance-based logistics contracts. However, success hinges on secure connectivity, common data standards, and the cyber-hardening of legacy networks.
Increased Outsourcing of Non-Core Logistics to European 3PL and 4PL Providers
Defense ministries are migrating warehousing, distribution, and planning activities to the commercial sector. KBR’s USD 771 million LOGCAP option illustrates the scale of opportunities available to firms able to fuse military regulations with commercial efficiencies. Outsourcing gives governments access to best-practice transportation management systems and demand-forecast models, freeing soldiers for operational duties. Still, dependencies on civilian contractors create operational-security and surge-capacity risks that ministries mitigate through dual-source agreements and strict performance clauses.
Increasing Security Concerns and Geopolitical Instability in the Region
Russia’s invasion of Ukraine has accelerated defense budgets throughout Eastern Europe, prompting rapid stockpile expansion and construction of forward logistics hubs. Poland’s East Shield initiative alone channels EUR 2.5 billion (USD 2.92 billion) into border fortifications and rapid-response infrastructure. The Baltic states are purchasing pre-positioned depots to guarantee resupply within 72 hours. Logistics providers with demonstrated contingency routing and austere-environment capabilities secure premium contracts as militaries emphasize resilience over efficiency.
Restraints Impact Analysis*
| Restraint | (~) % Impact on CAGR Forecast | Geographic Relevance | Impact Timeline |
|---|---|---|---|
| Fragmented customs and VAT regimes | −0.6% | EU-wide, especially the East | Short term (≤ 2 years) |
| Aging European military transport fleets | −0.8% | Western Europe | Medium term (2–4 years) |
| Cyber-hardening gaps in legacy logistics IT | −0.5% | EU-wide | Long term (≥ 4 years) |
| Budget volatility and fiscal caps | −0.7% | Germany, France, Italy, Spain | Short term (≤ 2 years) |
| Source: Mordor Intelligence | |||
Fragmented Customs and VAT Regimes Across Non-Schengen Defense Movements
Divergent customs documentation and inconsistent VAT rules delay cross-border equipment shipments, especially along NATO’s northeast corridor. The European Commission proposed a defense-mobility waiver in 2024, but member-state implementation is uneven[2]European Commission, “Proposal on Military Mobility,” europa.eu. Delays jeopardize readiness when ammunition, spare parts, or fuel convoys are held at borders. Unified electronic manifests, simplified VAT exemptions, and mutual-recognition agreements could unlock smoother flows and save millions in demurrage fees.
Aging European Military Transport Fleet Pressures MRO Budgets
The average age of European transport aircraft now exceeds 30 years, driving up depot-level maintenance costs and diverting funds from digital upgrades. Ground vehicles face similar obsolescence. Smaller nations without in-house overhaul facilities rely on contractor logistics support, which secures revenue for prime contractors but strains national budgets. Fleet recapitalization programs will eventually ease the burden, yet near-term sustainment remains costly.
*Our forecasts treat driver/restraint impacts as directional, not additive. The impact forecasts reflect baseline growth, mix effects, and variable interactions.
Segment Analysis
By Service Type: Technical Support Gains Momentum Amid Platform Complexity
Technical support and maintenance represents the fastest-growing service line, recording a 7.27% CAGR as highly digital platforms demand OEM-certified technicians and specialized diagnostic tooling. Modern fighters such as the F-35 and remote-weapon stations require proprietary software updates, secure data transfer, and component-level repairs that only a handful of firms can deliver. Armament services, which held 30.73% of Europe's defense logistics market share in 2025, continue to benefit from urgent ammunition restocking. Military troops support retains a steady baseline demand due to ongoing overseas deployments and training cycles. Medical aid, firefighting protection, and emergent cybersecurity support round out the portfolio, signaling a market that is rapidly diversifying beyond traditional lift and sustain lines.
Complexity favors firms with integrated services that package technical support with inventory management, parts distribution, and training. Full-spectrum offerings lock in longer revenue streams and raise switching costs for ministries. The European defense logistics market size for technical support is projected to climb steadily as each new platform enters operational service, generating a predictable aftermarket workload. Meanwhile, legacy platforms will remain in service during transition, creating parallel sustainment challenges and additional volume for maintenance providers.


By Logistics Function: Value-Added Services Reshape Traditional Models
Transportation dominated with 69.78% of functional demand in 2025, underscoring the ongoing importance of fast, flexible lift. Road haulage provides last-mile reach while airlift handles time-critical, high-value cargo. However, value-added services are projected to expand at an 8.38% CAGR as forces embrace commercial inventory-optimization techniques. Kitting, configuration management, and data analytics drive down order-to-delivery times and improve asset visibility. The Europe defense logistics market size for value-added services is expected to surpass earlier forecasts as ministries formalize performance-based logistics contracts.
Warehousing and distribution maintain moderate growth as pre-positioned stocks become standard practice on the eastern flank. New depots incorporate automated picking, cold-chain storage, and climate-resilient design. Providers that integrate warehousing with real-time tracking and automated customs clearance attract premium margins. Coordination among multimodal transport, high-density warehousing, and digital demand forecasting forms a key competitive lever in the evolving Europe defense logistics market.
By End User: Air Force Modernization Drives Logistics Intensity
The army kept 46.63% of Europe defense logistics market share in 2025 thanks to ammunition and armored-vehicle sustainment. Yet the air force segment is set to post the highest CAGR at 6.62% to 2031, reflecting major fighter and transport aircraft acquisitions. Operating costs for fifth-generation fighters significantly exceed those of legacy jets, bringing heightened demand for specialized ground support equipment, software patches, and classified spares. Navy sustainment focuses on submarine tenders, port services, and naval-aviation integration, but grows at a steady pace limited by slower fleet expansion schedules.
Cross-domain interoperability is encouraging ministries to consolidate contracts across services. Suppliers that offer integrated packages to the army, navy, and air force customers gain scale economies and higher throughput, reducing overall support costs. Continuous fleet rotation and joint-training requirements further stimulate a resilient baseline for contractor services in the Europe defense logistics market.
By Country: Poland’s Defense Surge Reshapes Regional Dynamics
Poland is forecast to be the fastest-growing national market within Europe, recording an 8.32% CAGR through 2031. Heavy procurement of missile systems, advanced armor, and combat aircraft demands new depots, ammunition plants, and eastward rail upgrades[3]RAND Corporation, “Poland’s Defense Transformation,” rand.org. Strong public support for defense spending ensures stable funding pipelines. The United Kingdom retains leadership in revenue terms, buoyed by deep contractor ecosystems and longstanding public-private partnership frameworks. Germany functions as a logistics bridge between Western Europe and the frontline, but further growth hinges on accelerating rail and road upgrades now budgeted at EUR 30 billion (USD 35.05 billion). France, Italy, Spain, the Netherlands, Norway, and Sweden each add targeted capabilities, such as Arctic logistics and amphibious resupply, reinforcing the distributed architecture that defines the modern European defense logistics market.
Geography Analysis
Poland’s eastward orientation and 4.7% GDP defense allocation are fueling record infrastructure spending. The government has financed new transshipment terminals, heavy-equipment maintenance parks, and dual-use airfields. The sheer volume of US and European materiel transiting Polish territory has turned the country into a primary node for the alliance. As a result, global and regional logistics providers are opening bonded warehouses, sensor-equipped truck fleets, and cross-docking facilities. The Europe defense logistics market size attached to Poland is set to climb sharply as East Shield projects transition from groundbreaking to steady-state operation.
Across the Channel, the United Kingdom combines a mature industrial base with digital supply-chain initiatives. The Strategic Defense Review placed digital command-and-control and predictive sustainment at the core of force-generation targets. Longstanding frameworks such as Future Logistics Concept grant private contractors a multiyear scope, smoothing investment cycles and supporting innovative pilots, including autonomous truck convoys that completed initial trials in 2025. Britain’s maritime orientation also drives steady demand for port services and submarine supply hubs, an area where the Royal Navy’s Clyde modernization program channels fresh spending.
Germany remains central due to its geographic location. New Force Model planning assumptions require ground combat units to move across German corridors within days, raising pressure for rail and bridge upgrades. Rheinmetall’s framework for 6,500 trucks signals an intent to overhaul aging fleets[4]Rheinmetall, “Major Order for Logistics Vehicles,” rheinmetall.com. Yet progress is moderated by fiscal caps and lengthy environmental approvals. France, Spain, and Italy continue to professionalize expeditionary sustainment for operations in the Sahel, the Levant, and the Indo-Pacific, adding unique know-how in medical evacuation, refrigerated storage, and amphibious resupply. Nordic countries contribute cold-weather expertise, maritime patrol logistics, and ice-class support vessels, elements vital to alliance deterrence in the High North.
Competitive Landscape
Europe's defense logistics market participants range from defense primes to pure-play forwarders, producing a moderately fragmented structure. The DSV-DB Schenker merger vaulted the combined entity into the top revenue slot and set a high bar for scale-based efficiencies. Legacy primes such as BAE Systems and Rheinmetall leverage vertical integration by bundling platform manufacture, spares production, and in-service support, tailoring offerings to ministries that value sovereign industrial capacity. Logistics specialists like DHL Global Forwarding and Kuehne + Nagel exploit global networks, automated warehouses, and low-carbon fleets to offer competitive pricing on routine lift.
Technology is the main differentiator. Rheinmetall’s acquisition of digitalization firm Blackned widened its secure communications portfolio and positioned the company to deliver cyber-hardened logistics platforms. Lockheed Martin’s purchase of Amentum’s Rapid Solutions group expanded intelligence, surveillance, and reconnaissance integration, essential for predictive sustainment. Contract wins favor providers showing compliance with NATO supply-classification protocols, active cyber-defense measures, and sustainability road maps. Emerging suppliers specializing in drone delivery, hydrogen-powered trucks, or blockchain certification are nibbling at niche segments such as last-mile resupply and tamper-proof inventory control.
Barriers to entry remain high due to security-clearance requirements, country-specific export controls, and the capital intensity of multimodal hubs. Nonetheless, smaller firms secure space by partnering with larger players, sub-contracting specialized modules such as refrigerated transport or explosive-ordnance disposal. The competitive ecosystem increasingly rewards alliances that blend military expertise with civilian innovation to meet the fast-evolving requirements of the Europe defense logistics market.
Europe Defense Logistics Industry Leaders
BAE Systems
Rheinmetall AG
Leonardo SpA
Airbus Defence & Space
KBR Inc.
- *Disclaimer: Major Players sorted in no particular order

Recent Industry Developments
- June 2025: Rheinmetall won a USD 107.5 million US Army contract for M1 Abrams track systems, extending transatlantic logistics reach.
- May 2025: The Netherlands ordered 785 logistics trucks from Iveco, signaling continued fleet modernization.
- March 2025: BAE Systems and the British Army agreed on a GBP 282 million program to field 500 Rheinmetall HX trucks.
- February 2025: The German Bundestag approved Rheinmetall’s EUR 3 billion framework for up to 6,500 military logistics trucks.


Research Methodology Framework and Report Scope
Market Definitions and Key Coverage
Our study defines the Europe defense logistics market as the yearly value of goods, services, and infrastructure devoted to procuring, moving, storing, repairing, and sustaining equipment and personnel for the Army, Navy, Air Force, and other uniformed branches across continental Europe and the United Kingdom. Activities counted range from armored-vehicle spares shipped by rail to pre-positioned medical kits and multinational ammunition depots, all expressed in constant 2025 dollars.
Scope exclusion: purely civilian disaster-relief missions conducted by armed forces are outside the sizing.
Segmentation Overview
- By Service Type
- Armament
- Military Troops Support
- Technical Support & Maintenance
- Medical Aid & Health Services
- Fire-fighting Protection
- Other Services
- By Logistics Function
- Transportation
- Road
- Air
- Sea and Inland Waterways
- Rail
- Warehousing & Distribution
- Value-added Services (Labelling, Kitting, Consulting)
- Transportation
- By End User
- Army
- Navy
- Air Force
- Other
- By Country
- United Kingdom
- Germany
- France
- Italy
- Spain
- Poland
- Netherlands
- Norway
- Sweden
- Rest of Europe
Detailed Research Methodology and Data Validation
Primary Research
We interviewed base-logistics officers in Germany, Poland, and Spain, spoke with procurement managers at integrated service providers, and surveyed defense economists tracking EU Military Mobility 2.0 grants. Their insights validated allocation ratios, typical lead times for cross-border heavy haul, and expected cost inflation on munitions transport, shaping assumption limits in the model.
Desk Research
Mordor analysts first mapped the spending pool through open data issued by NATO defense-expenditure databases, European Defense Agency logistics guidelines, Eurostat transport cost indices, SIPRI arms-transfer registers, and national MoD budget white papers. These sources clarify what proportion of overall military outlays is consistently tagged to logistics functions and how that share has shifted after the Ukraine conflict.
Company filings collected via D&B Hoovers, news archives on Dow Jones Factiva, and contract notices from the EU Tenders Electronic Daily provided unit-price ranges for depot-level maintenance, fuel convoys, and third-party freight services, letting us anchor realistic average selling prices.
The listed references are illustrative only; many additional public and proprietary documents helped verify trends and close data gaps.
Market-Sizing & Forecasting
A top-down build starts with each country's operations and maintenance budget, nets out personnel pay, and applies a logistics share derived from historic NATO benchmarks. Results are then corroborated with sampled contract roll-ups for warehousing, multimodal freight, and platform sustainment. Key inputs include troop deployment counts, average daily sustainment cost per soldier, cross-border heavy freight tariffs, spare parts refurbishment cycles, and EU infrastructure grant disbursements. Multivariate regression ties these drivers to forecast outlays, and bottom-up supplier revenue checks adjust any country totals that deviate beyond a two-point band.
Data Validation & Update Cycle
Outputs pass anomaly tests and peer review before sign-off. We refresh every twelve months and trigger interim updates after material events, such as a new NATO force structure plan, so clients receive the latest vetted view.
Why Mordor's Europe Defense Logistics Baseline Commands Reliability
Published estimates often diverge because firms choose different service baskets, currency years, and refresh schedules. By tracing every euro back to verifiable budget lines and contract values, we give decision-makers a figure that can be repeated and audited.
Key gap drivers include whether in-house military transport is counted, how ammunition mark-ups are treated, and if humanitarian missions are folded in.
Our deliberate scope choices and annual refresh cadence minimize such distortions.
Benchmark comparison
| Market Size | Anonymized source | Primary gap driver |
|---|---|---|
| USD 30.7 B (2025) | Mordor Intelligence | - |
| USD 36.5 B (2024) | Global Consultancy A | Adds global procurement flows, mixes 2024 currency, and assumes higher armament mark-ups |
| USD 14.3 B (2024) | Industry Publisher B | Counts only outsourced third-party logistics, omits in-house military transport and medical support |
Taken together, the comparison shows that when scope boundaries and variables are aligned, Mordor's baseline sits between overly broad and overly narrow views, offering a balanced, transparent starting point for planners.


Key Questions Answered in the Report
How large is the Europe defense logistics market in 2026?
The market is valued at USD 32.23 billion in 2026 and is projected to reach USD 40.97 billion by 2031.
Which service category is growing fastest?
Technical support and maintenance are rising at a 7.27% CAGR through 2031 as complex platforms demand OEM-certified sustainment.
Why is Poland attracting significant logistics investment?
Poland’s 4.7% GDP defense allocation and its East Shield fortification program are driving rapid infrastructure upgrades and creating an 8.32% CAGR growth path.
What impact did the DSV–DB Schenker merger have?
The deal created the largest integrated network in Europe, expanding scale efficiencies and reshaping competitive dynamics across transport and value-added services.
Which logistics function held the largest share in 2025?
Transportation dominated with 69.78% of functional revenue, underscoring ongoing demand for rapid and flexible military mobility.
How are digital platforms changing defense logistics?
AI-enabled supply-chain tools provide real-time inventory, predict maintenance needs, and improve mission readiness, prompting ministries to favor tech-savvy providers.
Page last updated on:


