Market Overview
| Study Period | 2018 - 2031 |
|---|---|
| Forecast Data Period | 2026 - 2031 |
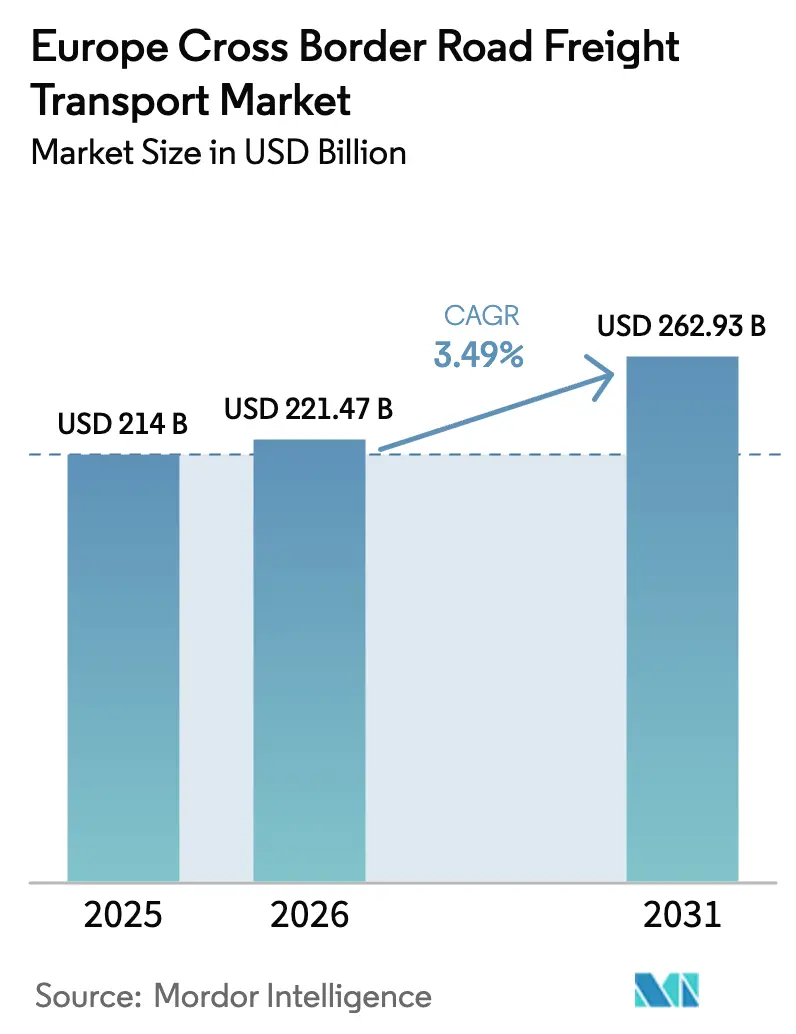
| Base Year Market Size (2025) | USD 214 Billion |
| Market Size (2026) | USD 221.47 Billion |
| Market Size (2031) | USD 262.93 Billion |
| Growth Rate (2026 - 2031) | 3.49% CAGR |
| Market Concentration | Low |
Major Players *Disclaimer: Major Players sorted in no particular order Image © Mordor Intelligence. Reuse requires attribution under CC BY 4.0. | |
Europe Cross Border Road Freight Transport Market Analysis by Mordor Intelligence
The Europe cross-border road freight transport market size is expected to grow from USD 214 billion in 2025 to USD 221.47 billion in 2026 and is forecast to reach USD 262.93 billion by 2031 at 3.49% CAGR over 2026-2031. This growth pace underscores a mature environment in which structural changes—including post-Brexit border formalities, rising CO₂-linked tolls, and a persistent driver shortage—reshape network design while e-commerce and near-shoring sustain overall demand. Freight corridors anchored to the Trans-European Transport Network (TEN-T) continue to attract infrastructure spending that shortens transit times and boosts corridor reliability. Retail platforms scale distributed fulfillment centers across Central Europe to meet next-day delivery expectations, stimulating incremental lane density even as traditional automotive flows remain the backbone of long-haul activity. Near-shored production in Poland, the Czech Republic, and Hungary produces bi-directional raw-material and finished-goods movements, reinforcing demand for temperature-controlled and high-value equipment transport.
Key Report Takeaways
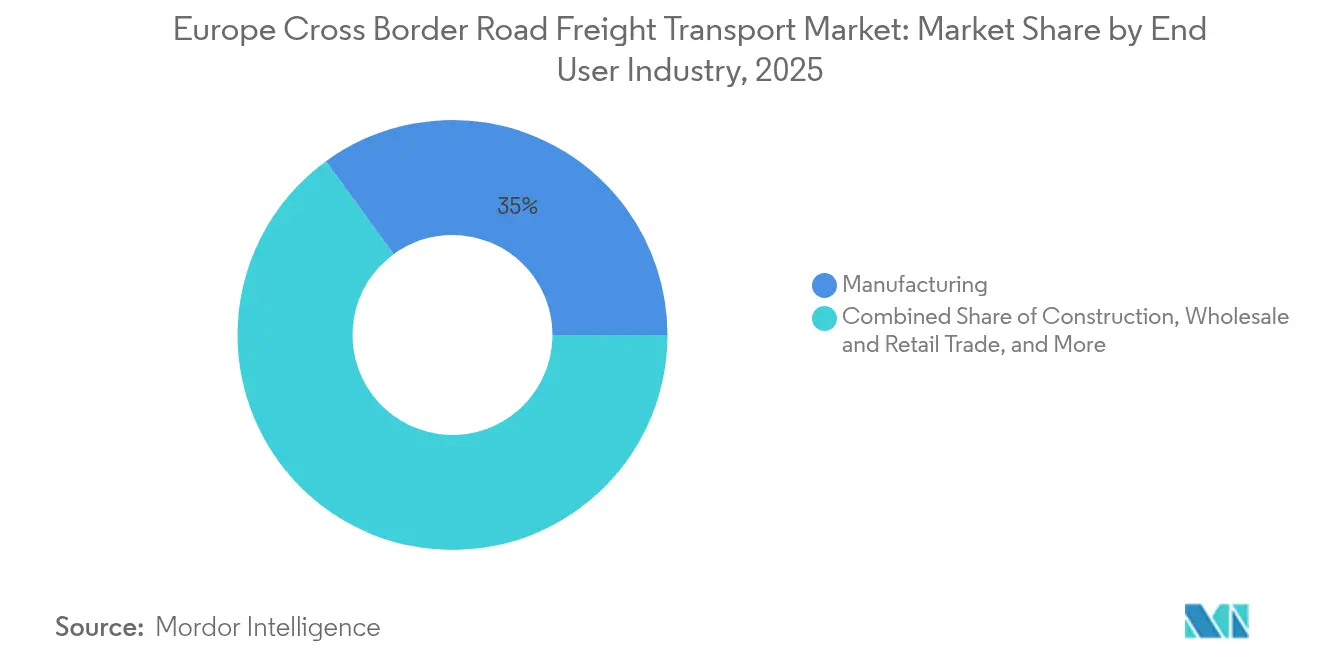
- By end user industry, manufacturing led with 35.02% of the Europe cross-border road freight transport market share in 2025, while wholesale and retail trade is forecast to advance at a 4.05% CAGR between 2026-2031.
- By country, the United Kingdom accounted for an 11.34% share of the Europe cross-border road freight transport market size in 2025, whereas the Netherlands is projected to expand at a 4.61% CAGR between 2026 and 2031.
Note: Market size and forecast figures in this report are generated using Mordor Intelligence’s proprietary estimation framework, updated with the latest available data and insights as of 2026.
Europe Cross Border Road Freight Transport Market Trends and Insights
Drivers Impact Analysis*
| Driver | (~) % Impact on CAGR Forecast | Geographic Relevance | Impact Timeline |
|---|---|---|---|
| Continued EU single-market trade expansion along TEN-T corridors | +0.8% | EU core, extending to EFTA countries | Medium term (2-4 years) |
| E-commerce parcel boom powering cross-border volumes | +0.7% | Western Europe core, spillover to CEE | Short term (≤ 2 years) |
| Near-shoring of manufacturing to CEE countries | +0.5% | Central and Eastern Europe focus | Long term (≥ 4 years) |
| Temperature-controlled pharma and food flows post-Brexit | +0.4% | UK-EU corridors, Nordics expansion | Medium term (2-4 years) |
| CO₂-differentiated toll incentives for zero-emission long-haul trucks | +0.3% | Germany, Netherlands, France leadership | Long term (≥ 4 years) |
| Autonomous-truck platooning pilots on trans-EU motorways | +0.2% | TEN-T core network corridors | Long term (≥ 4 years) |
| Source: Mordor Intelligence | |||


Continued EU Single-Market Trade Expansion Along TEN-T Corridors
Investment across the TEN-T core and comprehensive networks integrates digital customs tools that cut stop-time at key crossings to minutes rather than hours[1]European Commission, “TEN-T Corridors,” ec.europa.eu. Harmonized axle-load standards and expanded secure truck parking lower unproductive dwell, enabling carriers to complete longer hauls within regulated driving hours. Automotive giants funnel high-value components between German assembly centers and Eastern European suppliers on the Rhine-Alpine corridor, sustaining predictable back-and-forth flows. Digital freight-matching platforms piggy-back on corridor data to eliminate empty returns, raising asset utilization and compressing per-kilometer costs. Corridor reliability attracts logistics investments from pallet networks that require tightly-timed consolidation windows, reinforcing a positive feedback loop of volume and efficiency. As member states continue to co-finance intermodal hubs, the Europe cross-border road freight transport market benefits from reduced modal hand-off friction, further enlarging its addressable lane network.
E-commerce Parcel Boom Powering Cross-Border Volumes
Cross-border online transactions grew strongly in 2024 as marketplaces expanded EU-wide offerings and consumers demanded direct-to-door delivery options. Amazon, Zalando, and other platforms opened new fulfillment centers across Poland and the Czech Republic, positioning inventory inside the customs union for rapid shipping. Specialized parcel operators retrofitted fleets with temperature-controlled micro-boxes to satisfy rising pharmaceutical and fresh-food orders, creating premium-yield lanes on short-distance cross-border routes. Real-time API integrations with customs authorities sped up parcel clearance, supporting same-day promises on select BENELUX–Germany lanes that were unimaginable three years earlier. Higher shipment frequency lifts network density, helping fleets offset fixed toll and labor costs through tighter routing. This virtuous cycle keeps the Europe cross-border road freight transport market on a steady growth path despite macroeconomic volatility.
Near-shoring of Manufacturing to CEE Countries
Automotive, electronics, and white-goods brands accelerated factory openings in Poland, Hungary, and Slovakia in 2024, lured by shorter supply chains and EU regulatory alignment. Freight flows now move east-west and west-east in balanced volumes, minimizing empty backhauls for carriers. Road freight replaces a portion of long-haul ocean containers, cutting lead-time risk for just-in-sequence assembly lines. Regional governments co-invest in logistics parks near border crossings, bundling customs, warehousing, and value-added services within single permits that trim paperwork. As wage differentials narrow, CEE-based drivers show higher retention, partially easing the driver deficit on high-growth corridors. These dynamics embed durable demand into the Europe cross-border road freight transport market, lifting baseline volume growth through 2030.
Temperature-Controlled Pharma and Food Flows Post-Brexit
Separate regulatory regimes for the United Kingdom and continental Europe force pharmaceutical firms to duplicate distribution chains, multiplying cross-border temperature-controlled shipments[2]European Medicines Agency, “Pharmacovigilance,” ema.europa.eu. Cold-chain specialists installed GDP-compliant sensor networks on main UK–Benelux lanes, providing proof-of-temperature for every pallet transfer. Dutch agrifood exporters captured market share as British retailers diversified sourcing away from traditional French suppliers, adding new refrigerated rounds that command premium rates. Investment in Irish life-science clusters translated into a steady flow of active pharmaceutical ingredients to mainland fill-finish plants, ensuring two-way utilization. With vaccine pipelines still robust, biologics requiring ultra-cold packaging keep capacity near full utilization year-round. These high-margin niches shield carriers from commoditized spot-rate swings common in general cargo lanes.
Restraints Impact Analysis*
| Restraint | (~) % Impact on CAGR Forecast | Geographic Relevance | Impact Timeline |
|---|---|---|---|
| Acute professional-driver shortage | -0.9% | Pan-European, most severe in Western Europe | Short term (≤ 2 years) |
| Escalating distance-based and CO₂ road tolls | -0.6% | Germany, France, Netherlands core | Medium term (2-4 years) |
| Geopolitical border frictions and sanctions detours | -0.4% | Eastern European corridors, Russia borders | Short term (≤ 2 years) |
| Alpine transit caps and block-handling limits (Tyrol) | -0.3% | Austria-Italy corridor, Swiss routes | Long term (≥ 4 years) |
| Source: Mordor Intelligence | |||
Acute Professional-Driver Shortage
Europe’s driver shortfall topped 500,000 positions in 2024, with Germany alone reporting more than 70,000 vacancies that year[3]Transport & Environment, “Truck Driver Shortage in Europe Reaches Critical Levels,” transportenvironment.org. Retirement rates outpace new licenses as stringent training costs deter younger entrants, raising the average driver age to 47 years. Wage inflation—running in high single digits—is failing to close the gap because lifestyle factors such as rest-time regulations and prolonged border waits reduce job attractiveness. Eastern European drivers, once a labor buffer for Western fleets, are increasingly absorbed by rapid growth in their home markets, where wage differentials have narrowed. Lack of staff forces carriers to idle tractors or reject contract tenders, placing a ceiling on the volume that the Europe cross-border road freight transport market can service during peak periods. Autonomous-truck pilots are years from commercial scale, leaving the near-term capacity pinch unresolved.
Escalating Distance-Based and CO₂ Road Tolls
Germany’s 2024 CO₂-differentiated toll overhaul added a new carbon surcharge that lifted per-kilometer costs for Euro-VI diesel tractors by double-digit percentages on long hauls[4]German Federal Ministry of Transport, “Road Pricing,” bmdv.bund.de. France plans to expand similar schemes across its highway network by 2026, while the Netherlands introduces real-time emissions monitoring linked to toll discounts for zero-emission trucks. The patchwork drives administrative burden as operators juggle diverse declarations, e-vignettes, and refund procedures. Margins of small fleets evaporate when fixed toll outlays outstrip negotiating power with shippers, prompting some to exit international routes altogether. Consolidation accelerates as fully-compliant multinationals spread compliance costs over larger fleets, but reduced competition also threatens rate volatility in underserved corridors. Over the forecast horizon, elevated tolls subtract measurable growth from the Europe cross-border road freight transport market by disincentivizing marginal trips.
*Our forecasts treat driver/restraint impacts as directional, not additive. The impact forecasts reflect baseline growth, mix effects, and variable interactions.
Segment Analysis
By End User Industry: Manufacturing Commands Share While Retail Gains Ground
Manufacturing accounted for a 35.02% share of the Europe cross-border road freight transport market size in 2025, reflecting dense automotive, machinery, and chemical networks that rely on just-in-time delivery windows. Volume steadiness stems from predictable cadence in component flows between German OEMs and Central European tier-one suppliers, allowing carriers to secure long-term contracts that underpin fleet utilization. In contrast, wholesale and retail trade delivered the fastest expansion at a 4.05% CAGR between 2026 and 2031, mirroring the structural rise of omnichannel distribution that prizes regional fulfillment and next-day reach. E-retailers outsource overflow capacity to pallet networks skilled at cross-border returns handling, thereby refreshing load factors on otherwise imbalanced lanes.
The construction segment records lumpy demand tied to regional infrastructure projects, with TEN-T upgrade phases spiking heavy-haul requirements in the Iberian Peninsula and Alpine tunnels. Oil, gas, mining, and quarrying volumes soften amid energy-transition commitments, nudging carriers toward specialized equipment or dangerous-goods compliance to protect yields. Agriculture and forestry players leverage cross-border lanes for fresh organic produce headed to Northern supermarkets, stimulating refrigerated capacity in shoulder seasons when seafood and pharma slacken. Circular-economy activity adds back-haul potential as recyclables, batteries, and remanufactured parts move to consolidation hubs, helping balance directional disparities and raising overall efficiency within the Europe cross-border road freight transport market.


Geography Analysis
The United Kingdom retained an 11.34% slice of the Europe cross-border road freight transport market in 2025 as London-centric high-value cargo—including pharmaceuticals, aerospace components, and luxury goods—justified premium cross-Channel services despite added documentation layers. German corridors follow closely, leveraging deep industrial output to anchor steady east-west traffic. France’s central location supports Iberian, British, and Central European interconnections, yet driver shortages and toll hikes weigh on capacity.
The Netherlands charts the steepest growth, with a 4.61% CAGR projected between 2026-2031, buoyed by Rotterdam-linked tri-modal hubs that streamline hand-offs between sea, barge, and road. Italy and Spain continue to ride intra-EU demand but face Alpine transit caps that lengthen northbound routes. Nordic trade funnels seafood, timber, and vaccines through temperature-controlled specialists that maintain high-reliability operations in harsh climates, insulating yields from spot-rate swings.
Central and Eastern Europe emerges as the structural growth engine. Poland’s metropolitan warehousing belt tightens transit times to Berlin and Prague, drawing multinational manufacturers that seek risk-diversified supply chains. Czech Republic and Hungary ride the same wave, pairing automotive clusters with upgraded border crossings to keep dwell minimal. Baltic states act as back-door conduits for Nordic imports despite geopolitical volatility along the Russian frontier. Balkan corridors linking Romania and Bulgaria to Türkiye evolve into alternatives for Middle East trade, though infrastructure gaps still limit axle-weight allowances. Together these shifts amplify lane complexity yet broaden the opportunity set for asset-flexible carriers across the Europe cross-border road freight transport market.
Competitive Landscape
Europe’s cross-border road freight scene remains moderately fragmented, though consolidation momentum is unmistakable. DSV’s USD 15.8 billion acquisition of DB Schenker vaulted the combined entity to the top tier by revenue and network scope, granting scale economies in contract negotiations, fleet deployment, and customs-brokerage services. Multinational integrators leverage centralized control towers with AI-based routing that slices idle mileage, while mid-sized regional champions double down on vertical specializations such as refrigerated pharma or out-of-gauge industrial equipment, niches that reward compliance expertise and specialized assets.
CO₂-differentiated tolls and forthcoming Euro-VII emission standards accelerate fleet renewal among cash-rich players who can absorb higher capital outlays for electric or hydrogen drivelines. Smaller operators seek refuge in cooperative buying pools or asset-light digital platforms that aggregate loads at scale, yet regulatory ambiguity over driver status in gig-based models hampers expansion. Customer expectations for real-time visibility propel widespread telematics adoption, and early movers embed predictive ETA dashboards as differentiators that win long-term shipper contracts.
Temperature-controlled specialists invest in GDP-certified depots adjacent to pharmaceutical clusters in Dublin, Rotterdam, and Basel, capturing premium revenue protected by stringent compliance walls. Meanwhile, pallet networks such as Palletways extend hub-and-spoke footprints toward Eastern Europe, filling service gaps left by independent hauliers exiting cross-border segments due to toll and labor cost pressures. Overall, bargaining power tilts toward diversified operators with balanced lane portfolios and the capital muscle to embrace low-carbon transition pathways within the Europe cross-border road freight transport market.
Europe Cross Border Road Freight Transport Industry Leaders
DHL Group
DSV A/S (De Sammensluttede Vognmænd af Air and Sea)
Kuehne + Nagel
GEODIS
Rhenus Group
- *Disclaimer: Major Players sorted in no particular order


Recent Industry Developments
- October 2025: DHL Group opened its expanded Europe Innovation Center in Germany to advance smart and sustainable logistics solutions.
- April 2025: Kuehne+Nagel introduced direct line hauls between Türkiye and Europe within its groupage network, cutting lead-time on emerging near-shoring lanes.
- April 2025: DSV completed its acquisition of DB Schenker for EUR 14.3 billion (USD 15.8 billion).
- October 2024: DACHSER broke ground on a new logistics center in Ingolstadt for industrial and consumer goods handling.


Europe Cross Border Road Freight Transport Market Report Scope
Agriculture, Fishing, and Forestry, Construction, Manufacturing, Oil and Gas, Mining and Quarrying, Wholesale and Retail Trade, Others are covered as segments by End User Industry. France, Germany, Italy, Netherlands, Nordics, Russia, Spain, United Kingdom are covered as segments by Country.End User Industry
| Agriculture, Fishing, and Forestry |
| Construction |
| Manufacturing |
| Oil and Gas, Mining and Quarrying |
| Wholesale and Retail Trade |
| Others |
Country
| France |
| Germany |
| Italy |
| Netherlands |
| Nordics |
| Russia |
| Spain |
| United Kingdom |
| Rest of Europe |
| End User Industry | Agriculture, Fishing, and Forestry |
| Construction | |
| Manufacturing | |
| Oil and Gas, Mining and Quarrying | |
| Wholesale and Retail Trade | |
| Others | |
| Country | France |
| Germany | |
| Italy | |
| Netherlands | |
| Nordics | |
| Russia | |
| Spain | |
| United Kingdom | |
| Rest of Europe |


Market Definition
- Agriculture, Fishing, and Forestry (AFF) - This end user industry segment captures the external (outsourced) logistics expenditure incurred by the AFF industry players on road freight transport service. The end user players considered are the establishments primarily engaged in growing crops, raising animals, harvesting timber, harvesting fish & other animals from their natural habitats and providing related support activities. Herein, across the value chain, Logistics Service Providers (LSPs) play a crucial role in acquisition, storage, handling, transportation, and distribution activities for the optimal & continuous flow of inputs (seeds, pesticides, fertilizers, equipment, and water) from manufacturers or suppliers to the producers and smooth flow of output (produce, agro-goods) to distributors/ consumers. This includes both termperature controlled and non-temperature controlled logistics, as and when required according to the shelf life of goods being transported or stored.
- Construction - This end user industry segment captures the external (outsourced) logistics expenditure incurred by the construction industry players, on road freight transport service. The end user players considered are the establishments primarily engaged in constructing, repairing and renovating residential & commercial buildings, infrastructure, engineering works, subdividing and developing land. Logistics Service Providers (LSPs) play a crucial role in increasing profitability of construction projects by maintaing the inventory of raw materials & equipment, time-critical supplies and by providing other value added services for effective project management.
- Containerized Road Freight Transport - The segment captures the external (outsourced) logistics expenditure incurred by the road freight transport service end users on Full-Truck-Load (FTL) services. FTL road freight transport is characterized as a full single load not combined with other shipments. It comprises of shipments (i) devoted to the goods of a single shipper (ii) taken directly from a point of origin to one or more destination points (iii) comprising of bulk mail truck transportation (iv) comprising of both Container (Full Container Load, FCL)/Non-Container trucking services (v)comprsing of goods requiring temperature controlled or non-temperature controlled transportation services (vi) comprising of bulk liquid tankering (vii) invoving trucking of waste (viii) hazardous material trucking. Related value added services (VAS) of sorting, consolidation, deconslidation are included in the other services segment of freight and logistics market.
- Export Trends and Import Trends - Overall logistics performance of an economy is positively and significantly (statistically) correlated to its trade performance (exports and imports). Hence, in this industry trend, total value of trade, major commodities/ commodity groups and the major trade partners, for the studied geography (country or region as per the scope of report) have been analysed alongside the impact of major trade/logistics infrastructure investments & regulatory environment.
- Fluid Goods - The segment captures the external (outsourced) logistics expenditure incurred by the road freight transport service end users for the transport of bulk liquids, that are often used in extraction, manufacturing, food processing, agriculture industries among others. It includes transportation of liquids like (i) Chemicals/ hazardous goods (for instance acids) (ii) Water (potable as well as waste) (iii) Oil and gas (upstream as well as downstream like gasoline, fuel, crude oil, or propane), (iv) Food grade bulk liquids (like milk, or juice), (v) Rubber, (vi) Agrichemical products, among others. These goods are generally transported through tanker trucking.
- Fuel Price - Fuel price spikes can cause delays and diruption for logistics service providers (LSPs), while drops in the same can result in higher short-term profitability and increased market rivalry to offer consumers with the best deals. Hence, the fuel price variations have been studied over the review period and presented along with the causes as well as market impacts.
- Full-Truck-Load (FTL) Road Freight Transport - The segment captures the external (outsourced) logistics expenditure incurred by the road freight transport service end users on Full-Truck-Load (FTL) services. FTL road freight transport is characterized as a full single load not combined with other shipments. It comprises of shipments (i) devoted to the goods of a single shipper (ii) taken directly from a point of origin to one or more destination points (iii) comprising of bulk mail truck transportation (iv) comprising of both Container (Full Container Load, FCL)/Non-Container trucking services (v)comprsing of goods requiring temperature controlled or non-temperature controlled transportation services (vi) comprising of bulk liquid tankering (vii) invoving trucking of waste (viii) hazardous material trucking. Related value added services (VAS) of sorting, consolidation, deconslidation are included in the other services segment of freight and logistics market.
- GDP Distribution by Economic Activity - Nominal Gross Domestic Product and distribution of the same, across major economic sectors in the geography studied (country or region as per scope of the report) have been studied and presented in this industry trend. As GDP is positively related to the profitability and growth of logistics industry, this data has been used in adjunction to the input-output tables/ supply-use tables for analyzing the potential major contributing sectors towards the logistics demand.
- GDP Growth by Economic Activity - Growth of Nominal Gross Domestic Product across major economic sectors, for the geography studied (country or region as per scope of the report) have been presented in this industry trend. This data has been utilized for assessing the growth of logistics demand from all the market end users (economic sectors considered here).
- Inflation - Variations in both Wholesale Price Inflation (YoY change in producer price index) and Consumer Price Inflation have been presented in this industry trend. This data has been used to assess the inflationary environment as it plays a vital role in smooth functioning of the supply chain, directly impacting the logistics operational cost components e.g., pricing of tyres, driver wages & benefits, energy/fuel prices, maintenace costs, toll charges, warehousing rents, custom brokerage, forwarding rates, courier rates etc. hence impacting the overall freight and logistics market.
- Key Industry Trends - The report section named "Key Industry Trends" include all the key variables/parameters studied to better analyze the market size estimates and forecasts. All the trends have been presented in the form of data points (time series or latest available data points) along with analysis of the paramter in the form of concise market relevant commentary, for the geography studied (country or region as per the scope of report).
- Key Strategic Moves - The action taken by a company to differentiate from its competitor or used as a general strategy is referred to as a key strategic move (KSM). This includes (1) Agreements (2) Expansions (3) Financial Restructuring (4) Mergers and Acquisitions (5) Partnerships, and (6) Product Innovations. Key players (Logistics Service Providers, LSPs) in the market have been shortlisted, their KSM have been studied and presented in this section.
- Less than-Truck-Load (LTL) Road Freight Transport - The segment captures the external (outsourced) logistics expenditure incurred by the road freight transport service end users on Less than-Truck-Load (LTL) services. LTL road freight transport is characterized as multiple shipments combined onto a single truck for multiple deliveries within a network. It comprises of establishments (i) primarily engaged in general and specialized freight trucking of less than complete truck-loads, (ii) characterized by the use of terminals to consolidate shipments, generally from several shippers, into a single truck for haulage between a load assembly terminal and a disassembly terminal, where the load is sorted and shipments are re-routed for delivery (iv) Less than-Container-Load (LCL) shipping/ Groupage Shipping in case of trucking services. The activities in scope include (i) local pick-up, (ii) line-haul, and (iii) local delivery. Related value added services (VAS) of sorting, consolidation, deconslidation are included in the other services segment of freight and logistics market.
- Logistics Performance - Logistics Performance and Logistics Costs are the backbone of trade, and influences trade costs, making countries compete globally. Logistics performance is influenced by market wide adopted supply chain management strategies, government services, investments & policies, fuel/ energy costs, inflationary environment etc. Hence, in this industry trend, the logistics performance of the geography studied (country/ region as per the scope of report) has been analysed and presented over the review period.
- Major Truck Suppliers - Market share of truck brands is influenced by factors like geographical preferences, portfolio of truck types, truck prices, local production, truck repair & maintenance service peneteration, customer support, technological innovations (like electric vehicles, digitalization, autonomous trucks), fuel efficiency, financing options, annual maintenance costs, availability of substitutes, marketing startegies etc. Hence, the distribution (share % for base year of the study) of truck sales volume for leading truck brands and commentary on current market scenario & market anticipation over the forecast period have been presented in this industry trend.
- Manufacturing - This end user industry segment captures the external (outsourced) logistics expenditure incurred by the Manufacturing industry players, on road freight transport service. The end user players considered are the establishments primarily engaged in the chemical, mechanical or physical transformation of materials or substances into new products. Logistics Service Providers (LSPs) play a crucial role in maintaining a smooth flow of raw materials across the supply chain, enabling timely delivery of finished goods to distributors or end customers and storing & supplying the raw materials to clients for just-in-time manufacturing.
- Modal Share - Freight Modal Share is influenced by factors like modal productivity, government regulations, containerization, distance of shipment, temperature control requirements, type of goods, international trade, terrain, speed of delivery, shipment weight, bulk shipments, etc. Also, modal share by tonnage (tons) and modal share by freight turnover (ton-km) differ as per average distance of shipments, weight of major commodity groups transported in the economy and number of trips. This industry trend represents the distribution of freight transported by mode of transport (tons as well as ton-km), for the study base year.
- Oil and Gas, Mining and Quarrying - This end user industry segment captures the external (outsourced) logistics expenditure incurred by the extraction industry players, on road freight transport service. The end user players considered are the establishments that extract naturally occurring mineral solids, such as coal and ores; liquid minerals, such as crude petroleum; and gases, such as natural gas. Logistics Service Providers (LSPs) covers entire phases from upstream to downstream and plays a crucial role in the transportation of machinery, drilling equipments, extracted minerals, crude oil & natural gas and refined/ processed products from one place to another.
- Other End Users - Other end user segment captures the external (outsourced) logistics expenditure incurred by the financial services (BFSI), real estate, educational services, healthcare, and professional services (administrative, waste management, legal, architectural, engineering, design, consulting, scientific R&D), on road freight transport service. Logistics Service Providers (LSPs) plays a crucial role in the reliable movement of supplies and documents to/from these industries such as transporting any equipment or resources required, shipping confidential documents and files, movement of medical goods & supplies (surgical supplies and instruments, including gloves, masks, syringes, equipment) to name a few.
- Producer Price Inflation - It indicates inflation from viewpoint of the producers viz. the average selling price received for their output over a period of time. Annual change (YoY) of producer price index is reported as wholesale price inflation in the "Inflation" industry trend. As WPI captures dynamic price movements in most comprehensive way, it is widely used by governments, banks, industry, business circles and is deemed important in formulation of trade, fiscal and other economic policies. The data has been used in adjunction to consumer price inflation for better understanding the inflationary environment.
- Road Freight Pricing Trends - Freight pricing by mode of transport (USD/tonkm), over the review period, has been presented in this industry trend. The data has been used in assessing the inflationary environment, impact on trade, freight turnover (tonkm), road freight transport market demand and hence the road freight transport market size.
- Road Freight Tonnage Trends - Freight tonnage (weight of goods in tons) handled by mode of transport, over the review period, has been presented in this industry trend. The data has been used as one of the parameters apart from average distance per shipment (km), freight volume (tonkm), and freight pricing (USD/tonkm) to assess the freight transport market size.
- Road Freight Transport - Hiring a road freight transport logistics service provider (LSP) or haulier (outsourced logistics), for the transport of commodities constitutes road freight transport market. The scope of study includes (i) road transport of goods reported by hauliers registered in the reporting countries (ii) transport of raw materials or manufactured goods (solids as well as fluids) (iii) transport using commerical motor vehicles (rigid trucks or tractor-trailers, (iv) Full-Truck-Load (FTL) or Less than-Truck-Load (LTL) transport (v) containerized or non-containerized transport (vi) temperature controlled or non-temperature controlled trasnport, (vii) short haul or long haul (Over-the-road, OTR) transport, (viii) used office or household goods transport (movers and packers), (ix) other specialized cargo transport (dangerous goods, oversized cargo) and (x) outsourced first mile/ middle mile/last mile delivery shipments undertaken by road freight transport players. The scope does not include (i) transport undertaken by hauliers registered in other countries (ii) last mile meal delivery market (iii) grocery delivery market (iv) transportation via road network undertaken/ reported by Courier, Express, and Parcel (CEP) players.
- Road Length - As infrastructure plays a vital role in an economy's logistics performance, variables like length of roads, distribution of road length by surface category (paved v/s unpaved), distribution of road length by road classification (expressways v/s highways v/s other roads), have been analysed and presented in this industry trend.
- Segmental Revenue - Segmental Revenue has been triangulated or computed and presented for all the major players in the market. It refers to the road freight transport market specific revenue earned by the company, over the base year of study, in the geography studied (country or region as per the scope of report). It is computed through the study and analysis of major parameters like financials, service portfolio, employee strength, fleet size, investments, number of countries present in, major economies of concern, etc. that have been reported by the company in its annual reports, webpage. For companies having scarce financial disclosures, paid databases like D&B Hoovers, Dow Jones Factiva have been resorted to and verified through industry/expert interactions.
- Short Haul Road Freight Transport - The segment captures the external (outsourced) logistics expenditure incurred by the road freight transport service end users on local trucking (less than 100 miles). It includes the road transport of goods (i) within a single administrative area and its hinterland, (ii) by smaller trucks and pickup trucks (iii) via containerized as well as dry bulk services (iv) intermodal from ports, container terminals or airports, and (v) outsourced first mile/ last mile delivery shipments undertaken by road freight transport players.
- Transport and Storage Sector GDP - Value and growth of Transport and Storage Sector GDP has a direct relation to the freight and logistics market size, and hence road freight transport market size. Therefore, this variable has been studied and presented over the review period, in value terms (USD) and as share % of total GDP, in this industry trend. The data has been supported by concise and relevant commentary around the investments, developments, and current market scenario.
- Trends in E-Commerce Industry - Enhanced internet connectivity and boom in smartphone penetration, coupled with increasing disposable incomes, has led to a phenomenal growth in the e-commerce market globally. Online shoppers require fast and efficient delivery of their orders leading to an increase in the demand for logistics services especially e-commerce fulfilment services. Hence, the Gross Merchandise Value (GMV), historial and projected growth, breakup of major commodity groups in e-commerce industry for the studied geography (country or region as per scope of the report) have been analysed and presented in this industry trend.
- Trends in Manufacturing Industry - Manufacturing industry involves the transformation of raw materials into finished products, while logistics industry ensures the efficient flow of raw materials to the factory, and the transport of manufactured products to the distributors & consumers. Demand-Supply of both industries are highly cross-linked and critical for a seamless supply chain. Hence, the Gross Value Added (GVA), breakup of GVA into major manufacturing sectors, and growth of manufacturing industry over the review period have been analysed and presented, in this industry trend.
- Trucking Fleet Size By Type - Market share of truck types is influenced by factors like geographical preferences, major end user industries, truck prices, local production, truck repair & maintenance service peneteration, customer support, technological disruptions (like electric vehicles, digitalization, autonomous trucks) etc. Hence, the distribution (share % for base year of study) of truck parc volume by type of truck, market disruptors, truck manufacturing investments, truck specifications, truck use & import regulations, and market anticipation over the forecast period have been presented in this industry trend.
- Trucking Operational Costs - The prime reasons for measuring/ benchmarking logistics performance of any trucking company are to reduce operational costs and increase profitability. On the other hand, measuring operational costs helps to identify whether and where to make operational changes to control expenses and identify areas for improved performance. Hence, in this industry trend, trucking operational costs and the variables involved viz. driver wages & benefits, fuel prices, repairs & maintenance costs, tyre costs etc. have been studied over the base year of study, and presented for the geography studied (country or region as per the scope of report).
- Wholesale and Retail Trade - This end user industry segment captures the external (outsourced) logistics expenditure incurred by the wholesalers and retailers, on road freight transport service. The end user players considered are the establishments primarily engaged in wholesaling or retailing merchandise, generally without transformation, and rendering services incidental to the sale of merchandise. Logistics Service Providers (LSPs) plays a crucial role in the reliable movement of supplies to and finished products from production houses to the distributors and finally to the end customer covering activites like material sourcing, transportation, order fulfillment, warehousing & storage, demand forecasting, inventory management etc.
| Keyword | Definition |
|---|---|
| Cabotage | Road transport by a motor vehicle registered in a country performed on the national territory of another country. |
| Cross Docking | Cross docking is a logistics procedure where products from a supplier or manufacturing plant are distributed directly to a customer or retail chain with marginal to no handling or storage time. Cross docking takes place in a distribution docking terminal; usually consisting of trucks and dock doors on two (inbound and outbound) sides with minimal storage space. The name ‘cross docking’ explains the process of receiving products through an inbound dock and then transferring them across the dock to the outbound transportation dock. |
| Cross Trade | International road transport between two different countries performed by a road motor vehicle registered in a third country. A third country is a country other than the country of loading/embarkation and than the country of unloading/disembarkation. |
| Dangerous Goods | The classes of dangerous goods carried by Road are those defined by the fifteenth revised edition of the UN Recommendations on the Transport of Dangerous Goods, United Nations, Geneva 2007. They include Class 1: Explosives; Class 2: Gases; Class 3: Flammable Liquids; Class 4: Flammable solids- substances liable to spontaneous combustion; substances which, on contact with water, emit flammable gases; Class 5: Oxidizing substances and organic peroxides; Class 6: Toxic and infectious substances; Class 7: Radioactive material and Class 8: Corrosive substances, Class 9: Miscellaneous dangerous substances and articles. |
| Direct Shipment | Direct shipment is a method of delivering goods from the supplier or the product owner to the customer directly. In most cases, the customer orders the goods from the product owner. This delivery scheme reduces transportation and storage costs, but requires additional planning and administration. |
| Drayage | A drayage is a form of trucking service that connects the different modes of shipping (intermodal), such as ocean freight or air freight. It’s a short-haul trip that transports goods from one place to another, usually before or after its long-haul shipping process. Drayage trucks move cargo to and from various destinations, such as container ships, storage lots, order fulfillment warehouses, and rail yards. Typically, drayage only transports goods in short distances and operates only in one metropolitan area. It also requires only one trucker in a single shift. But despite this, but it plays an important role in long-haul shipping because it gets the goods to the cargo and vice versa. It makes intermodal transport much more efficient and enables the seamless transfer of goods to the end customer. |
| Dry van | A dry van is a type of semi-trailer that's fully enclosed to protect shipments from outside elements. Designed to carry palletized, boxed or loose freight, dry vans aren't temperature-controlled (unlike refrigerated “reefer” units) and can't carry oversized shipments (unlike flatbed trailers). |
| Final Demand | Final demand includes all types of commodities (goods as well as services) consumed as final use and might include personal consumption, or consumption by government, by businesses as capital investment, and as exports. includes all types of commodities (goods as well as services) consumed as final use and might include personal consumption, or consumption by government, by businesses as capital investment, and as exports. |
| Flatbed Truck | A flatbed truck is a type of truck with rigid design. It has a back body that is flatly shaped for easy loading and unloading of goods. The flatbed truck is mostly used to transport heavy, oversized, wide and indelicate goods such as machinery, building supplies or equipment. Due to the truck open body, the goods transported with it must not be vulnerable to rain. By functionality, the flatbed truck is comparable to a flatbed trailer. |
| Inbound Logistics | Inbound logistics is the way materials and other goods are brought into a company. This process includes the steps to order, receive, store, transport and manage incoming supplies. Inbound logistics focuses on the supply part of the supply-demand equation. |
| Intermediate Demand | Intermediate demand includes goods, services, and maintenance and repair construction sold to businesses, excluding capital investment. |
| International Loaded | Place of loading of goods in reporting country (i.e., country in which the vehicle performing the transport is registered) and place of unloading in a different country. |
| International Unloaded | Place of unloading of goods in reporting country (i.e., country in which the vehicle performing the transport is registered) and place of loading in a different country. |
| OOG cargo | Out of Gauge (OOG) cargo is any cargo that can not be loaded into six-sided shipping containers simply because it is too large. The term is a very loose classification of all cargo with dimensions beyond the maximum 40HC container dimensions. That is a length beyond 12.05 meters – a width beyond 2.33 meters – or a height beyond 2.59 meters. |
| Pallets | Raised platform, intended to facilitate the lifting and stacking of goods. |
| Part load | A part load describes goods which only fills a truck partially. In essence, the quantity of the shipment is bigger than the Less Than Truckload (LTL) shipment. Also, the shipment cannot fully occupy a truck i.e. its capacity is much lower than a Full Truckload (FTL) shipment. |
| Paved Road | Road surfaced with crushed stone (macadam) with hydrocarbon binder or bituminized agents, with concrete or with cobblestone. |
| Reverse Logistics | Reverse logistics comprises of the sector of supply chains that process anything returning inwards through the supply chain or traveling ‘backward’ through the supply chain. |
| Road Freight Transport Service | Hiring a trucking agency for transport of commodities (raw materials or manufactured goods including both solids and liquids) form the origin to a destination within the country (domestic) or cross-border (international) constitutes road freight transport market. The service might be Full-Truck-Load or Less than-Truck-Load, containerized or non-containerized, temperature controlled or non temperature controlled, short haul or long haul. |
| Tautliner vehicle | Tautliner and curtainsider are used as generic names for curtain sided trucks/trailers. The curtains are permanently fixed to a runner at the top and detachable rails/poles at front and rear, allowing the curtains to be drawn open and forklifts used all along the sides for easy and efficient loading and unloading. When closed for travel, vertical load restraint straps are attached to a rope rail beneath the truck bed, connecting the truck bed and curtain along both sides. Winches at either end of the curtain tension it, hence the 'Tautliner' name. This stops the curtain from flapping or drumming in the wind and can also help retain light loads from slipping sideways. |
| Transport for hire or reward | The carriage for remuneration of goods. |
| Unpaved Road | Road with a stabilized base not surfaced with crushed stone, hydrocarbon binder or bituminized agents, concrete or cobblestone. |


Research Methodology
Mordor Intelligence follows a four-step methodology in all our reports.
- Step-1: Identify Key Variables: In order to build a robust forecasting methodology, the variables and factors identified in Step-1 are tested against available historical market numbers. Through an iterative process, the variables required for market forecast are set and the model is built on the basis of these variables.
- Step-2: Build a Market Model: Market-size estimations for the forecast years are in nominal terms. Inflation is considered to be a part of the pricing, and the average selling price (ASP) is varying throughout the forecast period for each country
- Step-3: Validate and Finalize: In this important step, all market numbers, variables and analyst calls are validated through an extensive network of primary research experts from the market studied. The respondents are selected across levels and functions to generate a holistic picture of the market studied.
- Step-4: Research Outputs: Syndicated Reports, Custom Consulting Assignments, Databases & Subscription Platforms


