Market Overview
| Study Period | 2021 - 2031 |
|---|---|
| Forecast Data Period | 2026 - 2031 |
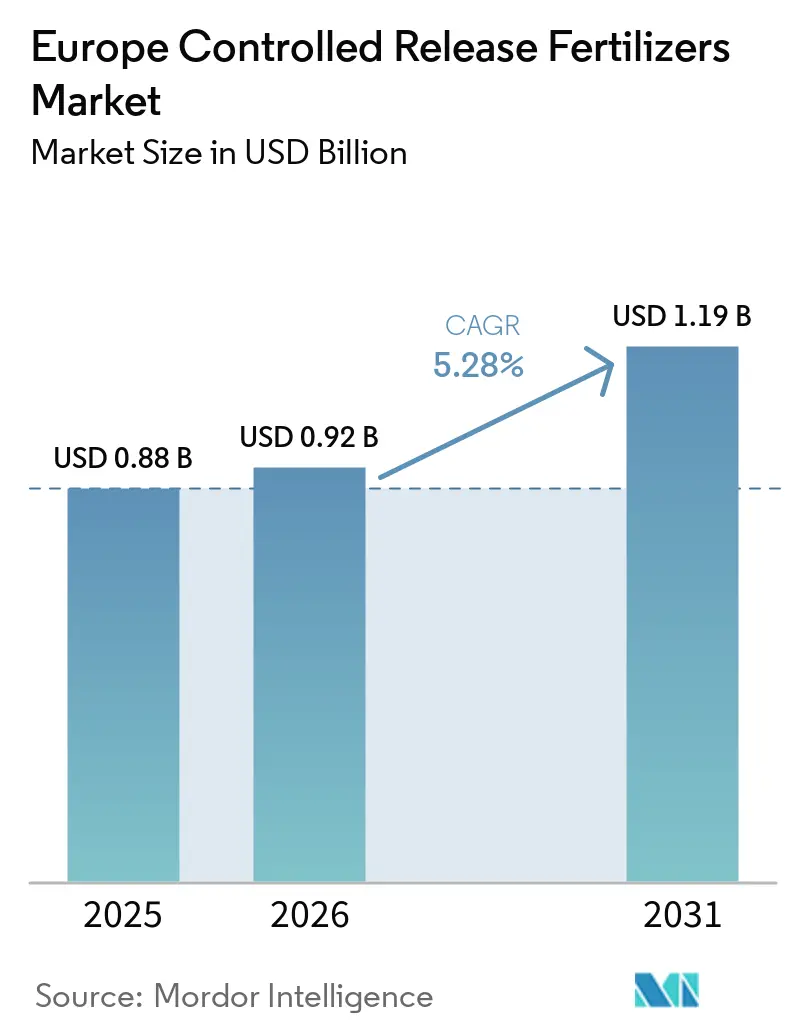
| Base Year Market Size (2025) | USD 0.88 Billion |
| Market Size (2026) | USD 0.92 Billion |
| Market Size (2031) | USD 1.19 Billion |
| Growth Rate (2026 - 2031) | 5.28% CAGR |
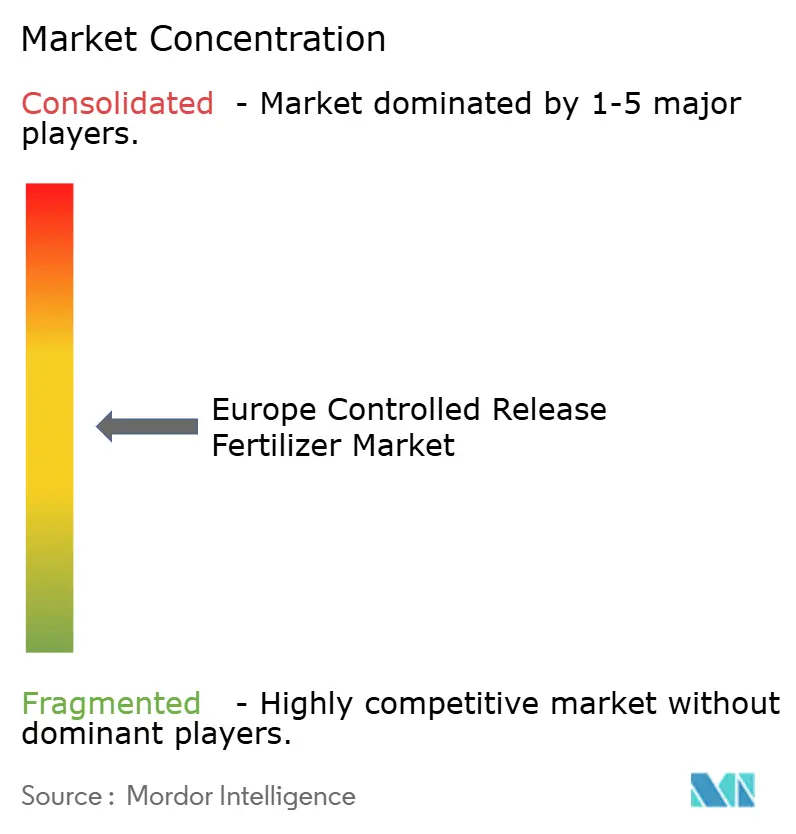
| Market Concentration | Medium |
Major Players*Disclaimer: Major Players sorted in no particular order Image © Mordor Intelligence. Reuse requires attribution under CC BY 4.0. | |
Europe Controlled Release Fertilizers Market Analysis by Mordor Intelligence
The Europe controlled release fertilizers market size was USD 0.88 billion in 2025 and USD 0.92 billion in 2026, and is forecast to reach USD 1.19 billion by 2031 at a 5.28% CAGR over 2026-2031. Regulatory pressure from the European Union’s Farm-to-Fork strategy, which seeks a 20% cut in nutrient losses by 2030, is steering growers toward products that match nutrient release to crop demand while limiting runoff. The mandatory shift to biodegradable polymer coatings by 2028 under REACH rules has triggered sizable investments in coating technology, and digital agriculture platforms now combine soil-sensor data with controlled release prescriptions to cut fertilizer use by up to 30% without hurting yields. Field-scale adoption across cereals and oilseeds underpins near-term revenue, while premium horticulture and urban landscaping niches sustain longer-run growth for the controlled release fertilizers market. [1]Source: Syfert, “Controlled Release Fertilizers: A Review on Coating Materials and Mechanism of Release,” syfert.net
Key Report Takeaways
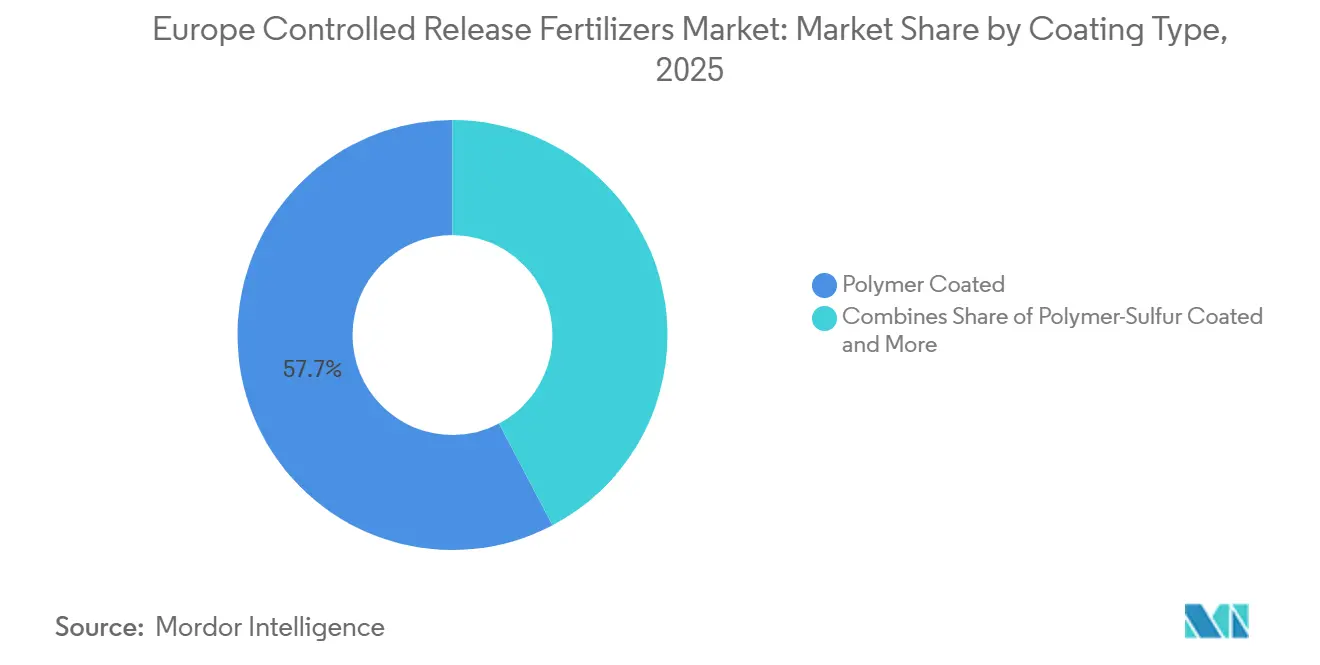
- By Coating Type, polymer-coated products held the largest share, accounting for 57.7% of the Europe controlled release fertilizers market share in 2025, while polymer-sulfur-coated products are projected to be the fastest-growing segment, registering a CAGR of 7.4% during 2026–2031.
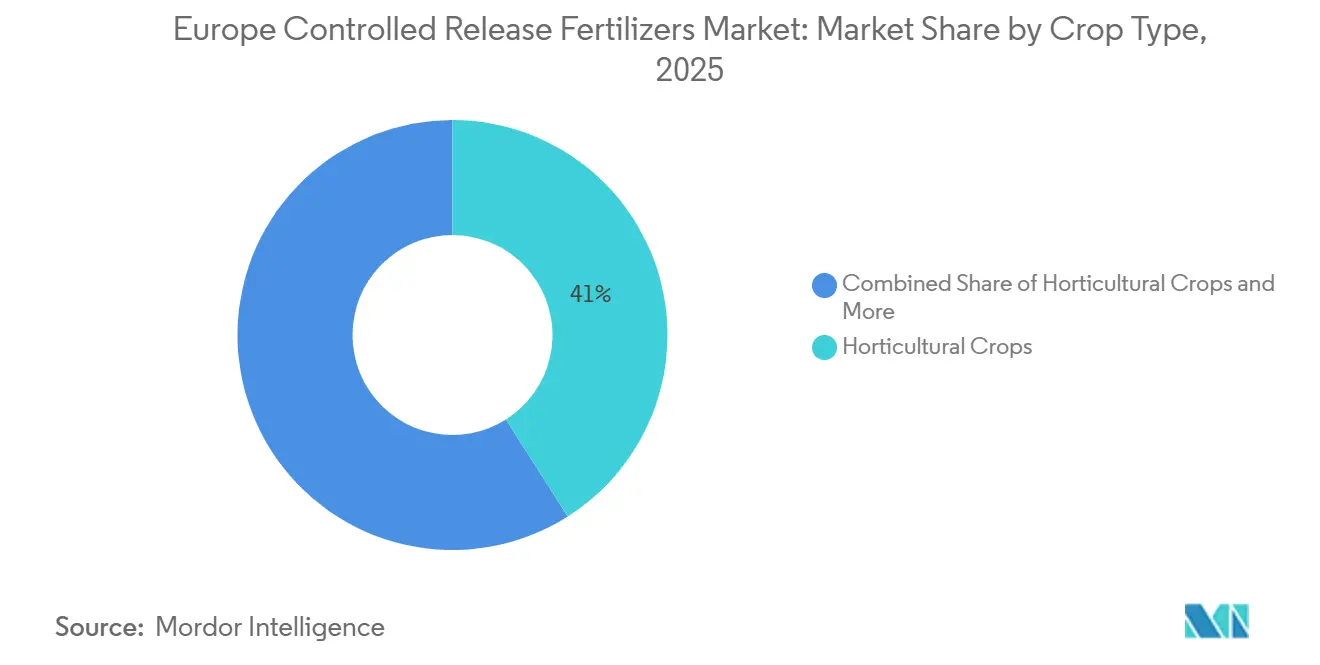
- By Crop Type, horticultural crops accounted for the largest share, representing 41.0% of the Europe controlled release fertilizers market size in 2025, whereas turf and ornamental crops are projected to be the fastest-growing segment, expanding at a CAGR of 6.9% during 2026–2031.
- By Country, Germany held the largest share of the Europe controlled release fertilizers market, accounting for 18.0% in 2025, while Ukraine is projected to be the fastest-growing country, registering a CAGR of 7.8% during 2026–2031.
Note: Market size and forecast figures in this report are generated using Mordor Intelligence’s proprietary estimation framework, updated with the latest available data and insights as of January 2026.
Europe Controlled Release Fertilizers Market Trends and Insights
Drivers Impact Analysis*
| Driver | (~) % Impact on CAGR Forecast | Geographic Relevance | Impact Timeline |
|---|---|---|---|
| Environmental-driven fertilizer bans in Northern EU pushing rapid CRF adoption | +1.8% | Northern Europe, Scandinavia | Short term (≤ 2 years) |
| EU "Farm-to-Fork" 2030 nutrient-loss mandates accelerating CRF subsidies | +1.5% | EU-wide, strongest in France, Germany | Medium term (2-4 years) |
| Blended biodegradable polymer coatings cutting disposal costs for processors | +1.2% | Western Europe, Netherlands, Belgium | Medium term (2-4 years) |
| Digital twins linking soil-sensor data to CRF prescriptions on large estates | +0.9% | France, Germany, UK large-scale operations | Long term (≥ 4 years) |
| Surge in vineyard drip-fertigation retrofits requiring low-salt CRF formats | +0.7% | Mediterranean Europe, Spain, Italy | Short term (≤ 2 years) |
| Vertical-farm operators standardizing on micro-dose CRF substrate cubes | +0.6% | Urban centers, Netherlands, Germany | Long term (≥ 4 years) |
| Source: Mordor Intelligence | |||


Environmental-driven fertilizer bans in Northern EU pushing rapid CRF adoption
Seasonal bans on conventional fertilizers in Denmark and Sweden have lengthened restriction periods and forced growers to use nutrient forms that supply crops over an extended window. This led to a 40% jump in controlled release fertilizers penetration across Scandinavia between 2024 and 2025. The regulatory emphasis has shifted the agronomic mindset from short-term nutrient boosts to season-long availability. National enforcement agencies now hinge compliance on documented use of approved controlled release products, and manufacturers that demonstrate REACH compliance enjoy a first-mover edge.
EU Farm-to-Fork 2030 nutrient-loss mandates accelerating CRF subsidies
France earmarked EUR 150 million (USD 160.5 million) in Common Agricultural Policy eco-schemes to reimburse up to 40% of controlled release fertilizers purchases, making premium coatings economically viable for mid-sized farms. Germany’s federal agriculture ministry is funding similar programs that prioritize nutrient-use-efficiency technologies. These subsidies neutralize the higher upfront cost of controlled release fertilizers and allow growers to recoup investment through reduced environmental compliance fees.
Blended biodegradable polymer coatings cutting disposal costs for processors
ASK Chemicals introduced ASKOCOAT systems that incorporate more than 60% renewable raw materials, eliminating microplastic worries and the need for special waste handling. Processors no longer face polymer disposal charges, and their customers gain access to coatings that meet soil-biodegradability criteria. This alignment of environmental safety and cost savings strengthens the business case for controlled release fertilizers market adoption in high-value horticulture. [2]Source: ASK Chemicals, “ASKOCOAT 2K PU resins for controlled release fertilizers,” ask-chemicals.com
Digital twins linking soil-sensor data to CRF prescriptions on large estates
Precision agriculture platforms are increasingly integrating real-time soil monitoring data with controlled release fertilizers application protocols, enabling dynamic nutrient management strategies that optimize both timing and dosing. Large agricultural estates in France and Germany have deployed sensor networks that monitor soil moisture, temperature, and nutrient levels at sub-field resolution, feeding this data into decision support systems that adjust controlled release fertilizers prescriptions accordingly. This integration allows for variable-rate applications that can reduce overall fertilizer consumption by 20-30% while maintaining or improving yields through more precise nutrient timing. The technology represents a shift from calendar-based application schedules to responsive, data-driven nutrient management, where controlled release characteristics are matched to specific soil conditions and crop requirements. Digital agriculture platforms provide the analytical framework necessary to optimize these complex interactions, creating competitive advantages for producers who can demonstrate superior nutrient use efficiency metrics.
Restraints Impact Analysis*
| Restraint | (~) % Impact on CAGR Forecast | Geographic Relevance | Impact Timeline |
|---|---|---|---|
| Slow regulatory path for certifying bio-based coating chemistries | -1.1% | EU-wide, particularly Germany, France | Medium term (2-4 years) |
| Inflation-driven polymer cost spikes squeezing CRF producer margins | -0.9% | Global supply chains affecting all European markets | Short term (≤ 2 years) |
| Patchy retailer agronomy skills limiting farmer uptake east of the Oder | -0.6% | Eastern Europe, Poland, Czech Republic | Long term (≥ 4 years) |
| Microparticle-shedding concerns triggering lobbying for coating traceability | -0.4% | Northern Europe, environmental advocacy regions | Medium term (2-4 years) |
| Source: Mordor Intelligence | |||
Slow regulatory path for certifying bio-based coating chemistries
The European Chemicals Agency's REACH registration process for novel biodegradable coating materials requires extensive toxicological and environmental fate studies that can extend approval timelines beyond 3 years, creating significant barriers for innovation in controlled release fertilizers technologies. This regulatory bottleneck prevents manufacturers from capitalizing on market demand for environmentally compliant coating systems, forcing continued reliance on conventional polymer technologies that face their own phase-out timelines. The approval delays create market uncertainty and discourage investment in research and development of next-generation coating materials. Companies must navigate parallel approval processes across multiple European jurisdictions, each with distinct requirements and timelines, further complicating market entry strategies for innovative coating technologies.
Inflation-driven polymer cost spikes squeezing producer margins
Volatile ethylene and propylene prices have increased polymer coating raw material costs by 35-45% since 2024, compressing controlled-release fertilizers producer margins and limiting pricing flexibility in competitive markets. The cost inflation affects all polymer-based coating systems, from conventional polyurethane formulations to emerging biodegradable alternatives, creating industry-wide pressure on profitability. Supply chain disruptions in petrochemical feedstocks have created additional uncertainty, with some coating material suppliers implementing force majeure clauses that limit availability during peak demand periods. These cost pressures are particularly challenging for smaller controlled-release fertilizer producers who lack the purchasing power to secure long-term supply contracts at favorable prices. The margin compression forces difficult decisions between maintaining market share through competitive pricing and preserving profitability through premium positioning strategies.
*Our forecasts treat driver/restraint impacts as directional, not additive. The impact forecasts reflect baseline growth, mix effects, and variable interactions.
Segment Analysis
By Coating Type: Polymer Innovation Drives Market Leadership
Polymer-coated controlled-release fertilizers accounted for the largest Europe controlled release fertilizers market share, representing 57.7% of the market in 2025. Their dominance reflects superior performance characteristics and a well-established manufacturing base across European production facilities. The segment benefits from proven nutrient-release profiles that can be precisely calibrated to match crop nutrient uptake patterns, with release durations ranging from two to 24 months depending on coating thickness and formulation. Companies such as ICL Group have invested heavily in next-generation polymer technologies, including biodegradable coating systems designed to improve nutrient-use efficiency and support sustainability objectives.
Polymer-sulfur-coated fertilizers are projected to be the fastest-growing segment, registering a CAGR of 7.4% during 2026–2031. These products combine the benefits of controlled nutrient release with supplemental sulfur nutrition, making them increasingly attractive in sulfur-deficient production systems. While polymer-sulfur-coated fertilizers currently account for a smaller share of the market, their cost-effectiveness and agronomic benefits are anticipated to support rapid adoption. The "Others" category includes emerging coating technologies such as natural wax-based and mineral-based formulations, which currently serve niche applications but face commercialization and scalability challenges. Regulatory and sustainability initiatives across Europe are accelerating research into biodegradable and bio-based coating materials, including starch-derived polymers and other renewable alternatives. This transition is anticipated to create opportunities for innovation leaders while increasing pressure on manufacturers to adapt their product portfolios to evolving environmental requirements.[3]Source: Scientific.net, “Coating of NPK Fertiliser with a Starch-Based Biodegradable Polymer,” scientific.net


By Crop Type: Field Crops Anchor Market Foundation
Horticultural crops dominated the Europe controlled release fertilizers market size, with 41.0% in 2025. This leadership is driven by intensive production systems in which premium crop pricing justifies higher input costs, and environmental regulations are often more stringent. Greenhouse operations, vineyards, and specialty vegetable producers increasingly utilize controlled-release fertilizers to optimize nutrient delivery in confined growing environments, where conventional fertilizer applications can contribute to salt accumulation and root-zone stress. Turf and ornamental applications also represent an important segment, particularly in urban landscaping projects where environmental compliance and reduced maintenance requirements influence fertilizer selection. The European Union's growing emphasis on sustainable urban development and green infrastructure is creating additional opportunities for controlled-release fertilizers in non-agricultural applications, including sports facilities and public green spaces, where nutrient runoff control is a key consideration.
Turf and ornamental crops are projected to be the fastest-growing segment, registering a CAGR of 6.9% during 2026–2031. Growth is supported by increasing investments in golf courses, sports fields, public parks, residential lawns, commercial landscaping projects, and ornamental plant production. The ability of controlled-release fertilizers to provide sustained nutrient availability, improve plant quality, and reduce maintenance requirements makes them particularly well suited for these applications. As urbanization continues and demand for well-maintained green spaces increases across Europe, adoption of controlled-release fertilizers in the turf and ornamental segment is anticipated to expand steadily, supporting long-term market growth.
Geography Analysis
Germany held the largest share of the controlled-release fertilizers market, accounting for 18.0% in 2025. The country benefits from an advanced agricultural ecosystem that integrates controlled-release fertilizer recommendations with digital soil mapping and crop modeling technologies. Farmers increasingly use in-field sensors, satellite imagery, and cloud-based analytics to optimize nutrient management based on spatial variability across large farming operations. Strict groundwater protection regulations make precision nutrient management essential, while grower organizations such as Maschinenring promote training programs that demonstrate the economic benefits of reducing nutrient runoff. Demand for controlled-release fertilizers remains strong across both arable and mixed crop-livestock farming systems, where labor savings and improved nutrient-use efficiency are highly valued.
Ukraine is projected to be the fastest-growing market, registering a CAGR of 7.8% during 2026–2031. Growth is driven by the gradual modernization of agricultural practices, increasing awareness of advanced fertilizer technologies, and the need to improve productivity across large-scale arable farmland. As the country strengthens its agricultural competitiveness and export potential, adoption of controlled-release fertilizers is anticipated to increase, supported by investments in precision agriculture and sustainable nutrient management solutions. The combination of large cultivated areas and improving farm management practices positions Ukraine as one of the most dynamic growth markets in the region during the forecast period.
Southern Europe, led by Spain and Italy, is also experiencing strong growth as specialty crop producers increasingly adopt coated fertilizers. Citrus orchards in Valencia and olive-growing regions in Puglia utilize polymer-coated potassium fertilizers to improve nutrient-use efficiency and support soil health. Water scarcity across Mediterranean production systems is encouraging farmers to maximize the effectiveness of every kilogram of nutrient applied, making controlled-release fertilizers an attractive solution. Meanwhile, Eastern European countries present significant untapped potential. Poland and Czech Republic possess extensive arable land resources but continue to exhibit relatively low controlled-release fertilizer penetration due to limited agronomic advisory capacity. Support from the European Union through rural development initiatives could accelerate adoption as knowledge and training barriers diminish, creating a substantial growth opportunity for the controlled-release fertilizers market.
Competitive Landscape
The Europe-controlled-release fertilizer market demonstrates a moderate level of concentration. Key players include ICL Group, which benefits from the strength of its Osmocote and Eqo.x product ranges and vertically integrated coating lines. Nutrien leverages its multi-channel distribution network and partnerships with cooperatives, while Grupa Azoty capitalizes on domestic Polish production and expanding export channels. Regional suppliers and specialty formulators also hold a significant market share, with many focusing on horticultural or turf-specific niches.
Technology positioning is a critical competitive factor as the 2028 biodegradable mandate approaches. Leading companies are investing significantly in polymer research, regulatory compliance, and pilot reactors designed to handle heat-sensitive bio-resins. Strategic partnerships with robotics and data analytics firms further enhance differentiation by integrating product chemistry with precision-placement hardware. Rising costs of petrochemical feedstocks favor companies that adopt bio-based alternatives early, providing insulation from market volatility. Smaller players can still succeed by targeting underserved crops or regions, but may face consolidation pressures unless they align with larger networks for certification and distribution support.
Mergers and licensing agreements are expected to increase from 2026 onward, as field performance data for next-generation coatings solidify market preferences. Companies with early certification for biodegradable products may achieve premium valuations, as acquirers seek to secure compliant portfolios ahead of the regulatory deadline. Conversely, firms relying on legacy polymers risk inventory write-downs and reduced shelf space as retailers streamline assortments to focus on proven biodegradable product lines.
Europe Controlled Release Fertilizers Industry Leaders
Ekompany International BV (DeltaChem)
Grupa Azoty S.A. (Compo Expert)
ICL Group Ltd
Mivena BV
Nutrien Ltd.
- *Disclaimer: Major Players sorted in no particular order

Recent Industry Developments
- January 2025: Haifa Group committed EUR 30 million (USD 32.1 million) to build a biodegradable controlled-release fertilizer plant in France, expanding Multicote capacity and ensuring supply readiness before the 2028 coating mandate. The facility will feature solvent-free reactors and in-line quality analytics that shorten batch-release cycles.
- January 2025: Yara United Kingdom and potato supplier Branston initiated a field program that integrates controlled release formulations with carbon-footprint tracking. Data from Lincolnshire test blocks will feed Tesco supply-chain dashboards, linking fertilizer choice directly to Scope 3 emissions reporting.
- October 2024: European Bioplastics welcomed amendments to the EU Fertilising Products Regulation (FPR) that formally recognize soil-biodegradable coatings, removing legal ambiguity and accelerating investment in bio-based resin scale-up.


Europe Controlled Release Fertilizers Market Report Scope
The Europe Controlled Release Fertilizers Market Report is Segmented by Coating Type (Polymer-Coated, Polymer-Sulfur Coated, and Others), Crop Type (Field Crops, Horticultural Crops, and Turf and Ornamental), and Geography (France, Germany, Italy, Netherlands, Russia, Spain, Ukraine, United Kingdom, and Rest of Europe). The Market Forecasts are Provided in Terms of Value (USD) and Volume (Metric Tons).
Coating Type
| Polymer Coated |
| Polymer-Sulfur Coated |
| Others |
Crop Type
| Field Crops |
| Horticultural Crops |
| Turf & Ornamental |
Country
| France |
| Germany |
| Italy |
| Netherlands |
| Russia |
| Spain |
| Ukraine |
| United Kingdom |
| Rest of Europe |
| Coating Type | Polymer Coated |
| Polymer-Sulfur Coated | |
| Others | |
| Crop Type | Field Crops |
| Horticultural Crops | |
| Turf & Ornamental | |
| Country | France |
| Germany | |
| Italy | |
| Netherlands | |
| Russia | |
| Spain | |
| Ukraine | |
| United Kingdom | |
| Rest of Europe |


Market Definition
- MARKET ESTIMATION LEVEL - Market Estimations for various types of fertilizers has been done at the product-level and not at the nutrient-level.
- NUTRIENT TYPES COVERED - Urea & Complex
- AVERAGE NUTRIENT APPLICATION RATE - This refers to the average volume of nutrient consumed per hectare of farmland in each country.
- CROP TYPES COVERED - Field Crops: Cereals, Pulses, Oilseeds, and Fiber Crops Horticulture: Fruits, Vegetables, Plantation Crops and Spices, Turf Grass and Ornamentals
| Keyword | Definition |
|---|---|
| Fertilizer | Chemical substance applied to crops to ensure nutritional requirements, available in various forms such as granules, powders, liquid, water soluble, etc. |
| Specialty Fertilizer | Used for enhanced efficiency and nutrient availability applied through soil, foliar, and fertigation. Includes CRF, SRF, liquid fertilizer, and water soluble fertilizers. |
| Controlled-Release Fertilizers (CRF) | Coated with materials such as polymer, polymer-sulfur, and other materials such as resins to ensure nutrient availability to the crop for its entire life cycle. |
| Slow-Release Fertilizers (SRF) | Coated with materials such as sulfur, neem, etc., to ensure nutrient availability to the crop for a longer period. |
| Foliar Fertilizers | Consist of both liquid and water soluble fertilizers applied through foliar application. |
| Water-Soluble Fertilizers | Available in various forms including liquid, powder, etc., used in foliar and fertigation mode of fertilizer application. |
| Fertigation | Fertilizers applied through different irrigation systems such as drip irrigation, micro irrigation, sprinkler irrigation, etc. |
| Anhydrous Ammonia | Used as fertilizer, directly injected into the soil, available in gaseous liquid form. |
| Single Super Phosphate (SSP) | Phosphorus fertilizer containing only phosphorus which has lesser than or equal to 35%. |
| Triple Super Phosphate (TSP) | Phosphorus fertilizer containing only phosphorus greater than 35%. |
| Enhanced Efficiency Fertilizers | Fertilizers coated or treated with additional layers of various ingredients to make it more efficient compared to other fertilizers. |
| Conventional Fertilizer | Fertilizers applied to crops through traditional methods including broadcasting, row placement, ploughing soil placement, etc. |
| Chelated Micronutrients | Micronutrient fertilizers coated with chelating agents such as EDTA, EDDHA, DTPA, HEDTA, etc. |
| Liquid Fertilizers | Available in liquid form, majorly used for application of fertilizers to crops through foliar and fertigation. |


Research Methodology
Mordor Intelligence follows a four-step methodology in all our reports.
- Step-1: IDENTIFY KEY VARIABLES: In order to build a robust forecasting methodology, the variables and factors identified in Step-1 are tested against available historical market numbers. Through an iterative process, the variables required for market forecast are set and the model is built on the basis of these variables.
- Step-2: Build a Market Model: Market-size estimations for the forecast years are in nominal terms. Inflation is not a part of the pricing, and the average selling price (ASP) is kept constant throughout the forecast period for each country.
- Step-3: Validate and Finalize: In this important step, all market numbers, variables and analyst calls are validated through an extensive network of primary research experts from the market studied. The respondents are selected across levels and functions to generate a holistic picture of the market studied.
- Step-4: Research Outputs: Syndicated Reports, Custom Consulting Assignments, Databases & Subscription Platforms


