Market Overview
| Study Period | 2021 - 2031 |
|---|---|
| Forecast Data Period | 2026 - 2031 |
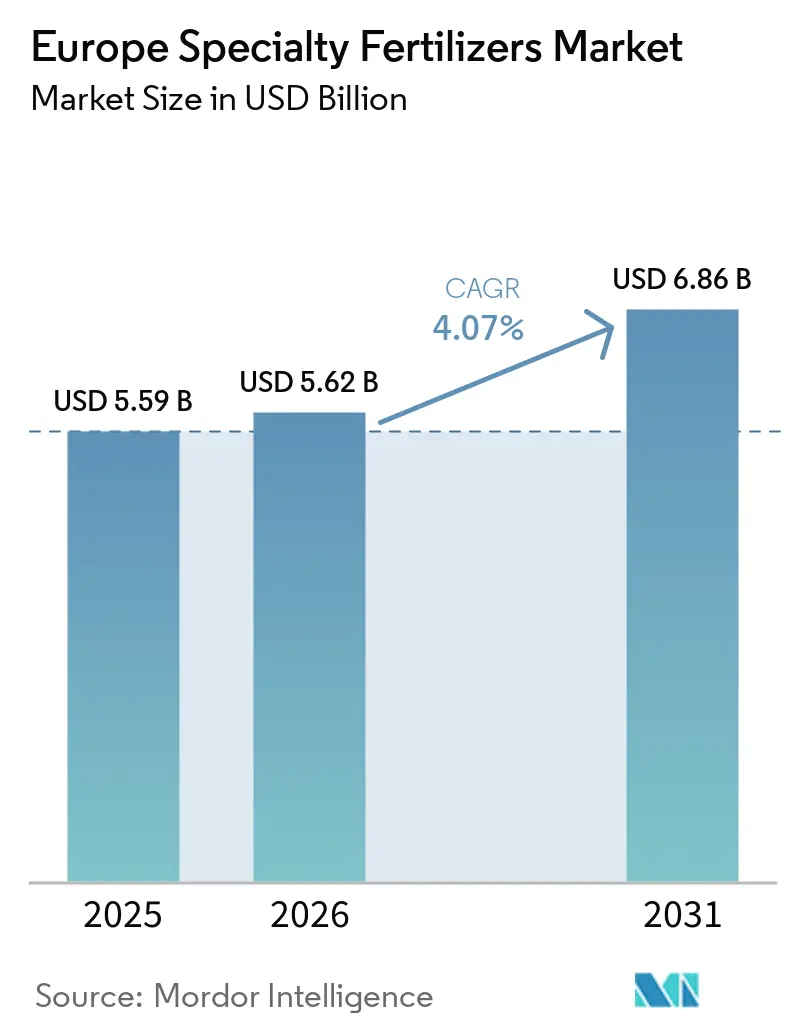
| Base Year Market Size (2025) | USD 5.59 Billion |
| Market Size (2026) | USD 5.62 Billion |
| Market Size (2031) | USD 6.86 Billion |
| Growth Rate (2026 - 2031) | 4.07% CAGR |
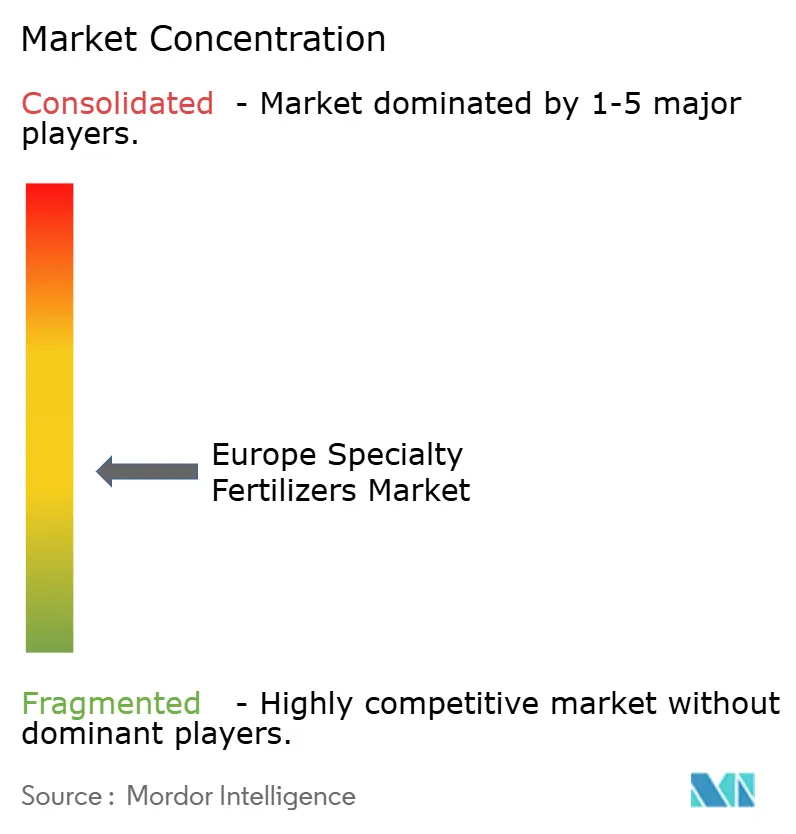
| Market Concentration | Medium |
Major Players*Disclaimer: Major Players sorted in no particular order Image © Mordor Intelligence. Reuse requires attribution under CC BY 4.0. |
|
Europe Specialty Fertilizers Market Analysis by Mordor Intelligence
The Europe specialty fertilizers market size is projected to grow from USD 5.59 billion in 2025 to USD 5.62 billion in 2026 and is forecast to reach USD 6.86 billion by 2031 at 4.07% CAGR over 2026 to 2031. Momentum comes from protected-cultivation expansion, rapid adoption of fertigation, and the Farm to Fork mandate, which targets a 50% cut in nutrient losses by 2030. Input-cost pressures and sustainability requirements are steering growers toward controlled-release, water-soluble, and carbon-verified formulations, while policy incentives in France and Germany are accelerating purchases of precision fertilization equipment. Manufacturers adapt by bundling digital advisory services with specialty products, creating value beyond the bag. Competitive focus, therefore, pivots to formulations compatible with fertigation, low-cadmium phosphate sourcing, and green-ammonia feedstocks. The market is experiencing a fundamental shift toward precision agriculture and sustainable farming, with advanced irrigation systems enabling more efficient fertilizer application. Manufacturers are increasingly developing balanced nutrient formulations that enhance crop yields while contributing to long-term soil health.
Key Report Takeaways
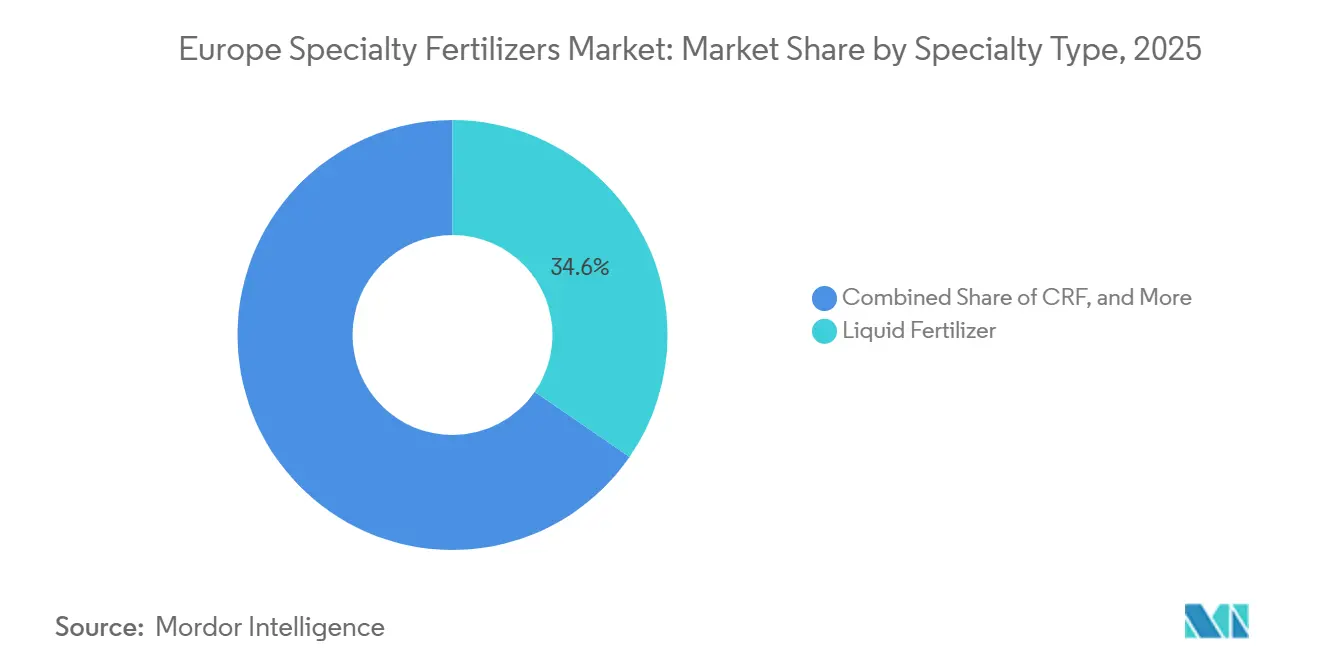
- By specialty type, liquid fertilizers accounted for the largest share at 34.6% in 2025, while controlled-release fertilizers are projected to grow fastest at a CAGR of 6.2% through 2031.
- By application mode, fertigation held the largest Europe specialty fertilizers market size in 2025 with a 43.8% share, whereas foliar application is forecast to expand fastest at a CAGR of 5.9% through 2031.
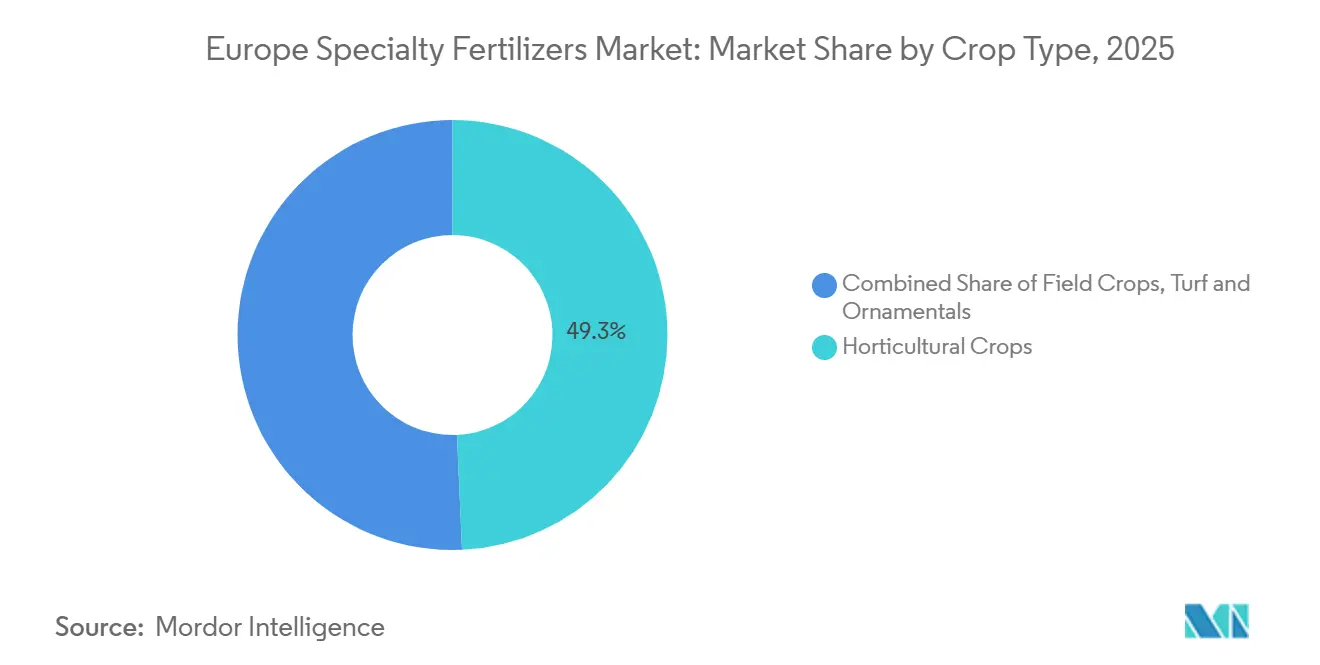
- By crop type, horticultural crops accounted for the largest share at 49.3% in 2025, while turf and ornamentals are anticipated to grow fastest at a CAGR of 6.4% through 2031.
- By geography, Germany held the largest Europe specialty fertilizers market share at 23.7% in 2025, while Spain is projected to expand fastest at a CAGR of 6.4% through 2031.
Note: Market size and forecast figures in this report are generated using Mordor Intelligence’s proprietary estimation framework, updated with the latest available data and insights as of 2026.
Europe Specialty Fertilizers Market Trends and Insights
Drivers Impact Analysis*
| Driver | (~) % Impact on CAGR Forecast | Geographic Relevance | Impact Timeline |
|---|---|---|---|
| Growth in protected-cultivation acreage | +1.2% | Netherlands, Spain, Italy, and Eastern Europe | Medium term (2–4 years) |
| Surge in fertigation system installations | +1.4% | Mediterranean zone, Netherlands, and Belgium | Short term (≤ 2 years) |
| EU (European Union) Farm to Fork sustainability targets | +0.9% | UK, Switzerland | Long term (≥ 4 years) |
| Recovery of horticulture exports post-Brexit | +0.6% | UK, Netherlands, Belgium | Medium term (2–4 years) |
| Scale-up of green-ammonia hubs | +0.7% | Spain, Netherlands, Germany, Nordics | Long term (≥ 4 years) |
| On-farm carbon-credit monetization pilots | +0.4% | France, Germany, Italy, Sweden | Medium term (2–4 years) |
| Source: Mordor Intelligence | |||


Growth in Protected-Cultivation Acreage
Protected growing sites now cover 10,500 hectares in the Netherlands and 64,000 hectares in Spain, advancing 15% in 2024 on export-oriented vegetable demand. Soilless systems dominate these expansions and require water-soluble or controlled-release blends that prevent nutrient lockup. Nordic countries add greenhouse capacity to improve food security, sustaining consumption of pH-balanced specialty fertilizers. Liquid products suit closed-loop recirculating systems, helping growers minimize discharge. The European specialty fertilizer market, therefore, captures volume as greenhouse operators standardize year-round nutrition programs.
Surge in Fertigation System Installations
Mediterranean farms installed fertigation at a 25% annual pace in 2024, led by Spanish olive groves and Italian vineyards facing water scarcity. Integrated sensors now trigger variable-rate dosing that can trim fertilizer use by 30-40% while maintaining yield. German and French field-crop producers also attach drip or pivot injectors to comply with nitrate-directive limits. Fertigation readiness steers buyers toward liquid and fully soluble powders, reinforcing the Europe specialty fertilizer market trajectory.
EU Farm to Fork Sustainability Targets
The Farm to Fork plan sets a 50% nutrient-loss reduction by 2030, pushing growers toward polymer-coated nitrogen, urease inhibitors, and bio-based phosphate sources[1].European Commission, “Farm to Fork Strategy,” europa.eu France offers 40% equipment subsidies, and Germany grants tax credits for carbon-verified inputs. Producers that certify cradle-to-gate emissions gain market access advantages. Consequently, controlled-release fertilizers record the fastest volume growth in the Europe specialty fertilizer market.
Recovery of Horticulture Exports Post-Brexit
EU vegetable shipments to the UK rebounded 18% in 2024 after customs workflows stabilized. Dutch and Belgian exporters now specify calcium-fortified programs to boost shelf life. Specialty blends addressing post-harvest firmness, therefore gain share. Logistics-driven quality demands help the Europe specialty fertilizer industry secure higher margins in premium produce channels. This growth highlights the importance of streamlined logistics and innovative solutions in meeting market demands. The European specialty fertilizer industry is well-positioned to capitalize on these trends, driving further advancements in premium produce quality.
Restraints Impact Analysis*
| Restraint | (~) % Impact on CAGR Forecast | Geographic Relevance | Impact Timeline |
|---|---|---|---|
| Shrinking arable land in Eastern Europe | -0.8% | Ukraine, Poland, and Romania | Long term (≥ 4 years) |
| Volatility in natural-gas derived feedstocks | -1.1% | Germany, Netherlands, and Poland | Short term (≤ 2 years) |
| Stringent cadmium limits in EU fertilizer law | -0.6% | EU-27 | Medium term (2–4 years) |
| Slow digital-ag adoption among smallholders | -0.4% | Southern & Eastern Europe | Long term (≥ 4 years) |
| Source: Mordor Intelligence | |||
Shrinking Arable Land in Eastern Europe
Poland removed 180,000 hectares from cultivation in 2024, while Ukrainian fields faced labor shortages and infrastructure damage[2]Polish Ministry of Agriculture, “Land Use Changes 2024,” gov.pl. Consolidation favors capital-intensive operations that adopt specialty inputs, yet total addressable hectares decline, trimming aggregate demand. Larger farms cushion the Europe specialty fertilizer market, but regional volume headwinds persist. Despite these challenges, the adoption of specialty inputs by larger farms may help stabilize the market.
Slow Digital-ag Adoption Among Smallholders
Farms below 15 hectares in Southern Europe show 20-30% lower GPS and sensor use than larger peers.[3]European Commission. "Market Observatories," europa.euWithout data, precision fertilizer ROI is hard to quantify, slowing specialty penetration. Cooperative equipment sharing and training programs are underway, but full benefits will unfold over a longer horizon. Addressing these challenges through enhanced data collection and targeted support programs could accelerate technology adoption. This would enable smaller farms to achieve greater efficiency and competitiveness in the long term.
*Our forecasts treat driver/restraint impacts as directional, not additive. The impact forecasts reflect baseline growth, mix effects, and variable interactions.
Segment Analysis
By Specialty Type: Liquid formulations drive market leadership
Liquid fertilizers commanded 34.6% of the Europe specialty fertilizers market share in 2025 due to drip-ready compatibility and uniform distribution. Growers value rapid plant uptake and lower labor needs, especially in greenhouse vegetables. Controlled-release lines post 6.2% CAGR to 2031, lifted by Farm to Fork rules that reward nutrient-use efficiency. The Europe specialty fertilizers market size for controlled-release options is forecast to widen as polymer-coated urea and sulfur-coated urea stretch feeding intervals to 120 days.
Water-soluble crystals dominate hydroponic basil, cucumber, and strawberry systems in the Netherlands and Belgium, while slow-release granules retain niche turf and ornamental users. Micronutrient blends with zinc, boron, and iron now bundle biostimulants for stress mitigation, a trend aligned with shifting climate patterns. Patent activity for novel encapsulation rose 15% in 2024, underscoring innovation depth. s


By Application Mode: Fertigation systems reshape delivery methods
Fertigation accounted for 43.8% of sales in 2025, making it the largest application mode in the Europe specialty fertilizers market. The expansion of drip irrigation networks for crops such as olives, vines, and greenhouse perennials, combined with the use of real-time flow meters, continues to enhance nutrient-use efficiency and drive adoption. Soil application also remains widely used in broad-acre cropping systems, supported by precision spreaders and variable-rate nutrient management technologies.
Foliar application is projected to be the fastest-growing segment, with a 5.9% CAGR through 2031. Foliar sprays are essential for rapidly correcting calcium and magnesium deficiencies in crops such as grapes and tomatoes. Trials conducted in Spain have demonstrated a 24–33% reduction in nutrient use through multispectral-guided foliar programs, validating investments in drone-enabled sprayers and driving demand for foliar application in high-value crops.
By Crop Type: Horticultural crops anchor demand
Horticultural crops accounted for the largest share in 2025, at 49.3%. This dominance is driven by demand for greenhouse vegetables, berries, leafy greens, and other high-value crops. Growers are increasingly adopting specialty fertilizer programs to enhance yield, improve quality, and meet traceability compliance requirements, thereby strengthening the Europe specialty fertilizers market. Field crops also represent a significant segment, supported by extensive cultivation of wheat, corn, and rapeseed in major agricultural economies.
Turf and ornamental crops are projected to exhibit the fastest growth, with a CAGR of 6.4% through 2031. This growth is fueled by demand from municipal landscaping, recreational facilities, and golf-course maintenance programs, which emphasize consistent nutrient delivery and maintaining visual quality. While horticultural producers benefit from favorable crop economics, turf and ornamental applications continue to expand as a niche segment within the market.
Geography Analysis
Germany accounted for the largest share of the Europe specialty fertilizers market, at 23.7% in 2025. This leadership is supported by high technology readiness and the widespread adoption of GPS-enabled farming equipment. France remains a significant market due to its extensive agricultural base and increasing emphasis on nutrient-use efficiency. The Netherlands, despite its limited land area, records some of the highest specialty fertilizer expenditure per hectare, driven by intensive year-round greenhouse cultivation.
Spain is projected to be the fastest-growing market, registering a CAGR of 6.4% through 2031. Growth is driven by its export-oriented fruit and vegetable industry, where liquid and water-soluble fertilizers play a critical role in maintaining crop quality and shelf life. Similarly, Italy benefits from intensive Mediterranean horticulture, sustaining demand for specialty fertilizers across high-value crop segments.
Russia remains an important market, supported by large-scale grain production and increasing adoption of enhanced-efficiency fertilizers and precision application technologies. Poland and the Czech Republic continue to benefit from investments in agricultural modernization, although fragmented land ownership structures constrain adoption rates in some areas. Ukraine continues to generate demand for specialty fertilizers through its export-oriented wheat sector despite infrastructure and logistical challenges, contributing to the broader development of the Europe specialty fertilizers market.
Competitive Landscape
The market is moderately fragmented. Yara International ASA, ICL Group Ltd, and EuroChem Group AG integrate mining, production, and distribution to secure feedstock and shorten lead times. Each now bundles satellite-derived nutrient maps within subscription packages, shifting revenue toward service-based models. Companies are increasingly investing in sustainability credentials and carbon footprint verification to capture premium pricing in environmentally conscious market segments.
Green-ammonia partnerships with utilities position frontrunners to deliver net-zero nitrogen at premium pricing. EuroChem Group AG’s Baltic terminals shorten logistics to Nordic buyers, while ICL’s Spanish assets target Mediterranean horticulture. Regional mid-tier players, such as Timac Agro and Haifa Group, differentiate themselves via crop-specific water-soluble lines.
Start-ups deploy nanotechnology carriers that raise nutrient-use efficiency above 90%. Patent filings across polymer science and microbial enhancers rose by double digits in 2024, signaling a steady pipeline. Buyers increasingly value verified emission reductions, so suppliers invest in blockchain traceability systems to capture price uplifts.
Europe Specialty Fertilizers Industry Leaders
-
ICL Group Ltd
-
Kingenta Ecological Engineering Group Co., Ltd.
-
Yara International ASA
-
EuroChem Group AG.
-
FERTIBERIA, S.A.
- *Disclaimer: Major Players sorted in no particular order

Recent Industry Developments
- November 2024: Haifa Group introduced new water-soluble fertilizer formulations specifically designed for greenhouse cucumber production, targeting the Netherlands and Belgian growers. This initiative is anticipated to strengthen the specialty fertilizers market in Europe by addressing the specific needs of greenhouse growers and enhancing crop productivity.
- August 2024: Timac Agro received ISO 14001 environmental management certification for its French production facilities, supporting sustainability positioning in European specialty fertilizer markets.
- July 2024: ICL Group Ltd completed the acquisition of specialty fertilizer assets from a regional competitor for USD 45 million, expanding its controlled-release fertilizer portfolio in Mediterranean markets. The transaction includes manufacturing facilities and distribution networks in Spain and Italy.


Europe Specialty Fertilizers Market Report Scope
CRF, Liquid Fertilizer, SRF, Water Soluble are covered as segments by Speciality Type. Fertigation, Foliar, Soil are covered as segments by Application Mode. Field Crops, Horticultural Crops, Turf & Ornamental are covered as segments by Crop Type. France, Germany, Italy, Netherlands, Russia, Spain, Ukraine, United Kingdom are covered as segments by Country.
Speciality Type
| CRF | Polymer Coated |
| Polymer-Sulfur Coated | |
| Others | |
| Liquid Fertilizer | |
| SRF | |
| Water Soluble |
Application Mode
| Fertigation |
| Foliar |
| Soil |
Crop Type
| Field Crops |
| Horticultural Crops |
| Turf & Ornamental |
Country
| France |
| Germany |
| Italy |
| Netherlands |
| Russia |
| Spain |
| Ukraine |
| United Kingdom |
| Rest of Europe |
| Speciality Type | CRF | Polymer Coated |
| Polymer-Sulfur Coated | ||
| Others | ||
| Liquid Fertilizer | ||
| SRF | ||
| Water Soluble | ||
| Application Mode | Fertigation | |
| Foliar | ||
| Soil | ||
| Crop Type | Field Crops | |
| Horticultural Crops | ||
| Turf & Ornamental | ||
| Country | France | |
| Germany | ||
| Italy | ||
| Netherlands | ||
| Russia | ||
| Spain | ||
| Ukraine | ||
| United Kingdom | ||
| Rest of Europe |


Market Definition
- MARKET ESTIMATION LEVEL - Market Estimations for various types of fertilizers has been done at the product-level and not at the nutrient-level.
- NUTRIENT TYPES COVERED - Primary Nutrients: N, P and K, Secondary Macronutrients: Ca, Mg and S, Micronutients: Zn, Mn, Cu, Fe, Mo, B, and Others
- AVERAGE NUTRIENT APPLICATION RATE - This refers to the average volume of nutrient consumed per hectare of farmland in each country.
- CROP TYPES COVERED - Field Crops: Cereals, Pulses, Oilseeds, and Fiber Crops Horticulture: Fruits, Vegetables, Plantation Crops and Spices, Turf Grass and Ornamentals
| Keyword | Definition |
|---|---|
| Fertilizer | Chemical substance applied to crops to ensure nutritional requirements, available in various forms such as granules, powders, liquid, water soluble, etc. |
| Specialty Fertilizer | Used for enhanced efficiency and nutrient availability applied through soil, foliar, and fertigation. Includes CRF, SRF, liquid fertilizer, and water soluble fertilizers. |
| Controlled-Release Fertilizers (CRF) | Coated with materials such as polymer, polymer-sulfur, and other materials such as resins to ensure nutrient availability to the crop for its entire life cycle. |
| Slow-Release Fertilizers (SRF) | Coated with materials such as sulfur, neem, etc., to ensure nutrient availability to the crop for a longer period. |
| Foliar Fertilizers | Consist of both liquid and water soluble fertilizers applied through foliar application. |
| Water-Soluble Fertilizers | Available in various forms including liquid, powder, etc., used in foliar and fertigation mode of fertilizer application. |
| Fertigation | Fertilizers applied through different irrigation systems such as drip irrigation, micro irrigation, sprinkler irrigation, etc. |
| Anhydrous Ammonia | Used as fertilizer, directly injected into the soil, available in gaseous liquid form. |
| Single Super Phosphate (SSP) | Phosphorus fertilizer containing only phosphorus which has lesser than or equal to 35%. |
| Triple Super Phosphate (TSP) | Phosphorus fertilizer containing only phosphorus greater than 35%. |
| Enhanced Efficiency Fertilizers | Fertilizers coated or treated with additional layers of various ingredients to make it more efficient compared to other fertilizers. |
| Conventional Fertilizer | Fertilizers applied to crops through traditional methods including broadcasting, row placement, ploughing soil placement, etc. |
| Chelated Micronutrients | Micronutrient fertilizers coated with chelating agents such as EDTA, EDDHA, DTPA, HEDTA, etc. |
| Liquid Fertilizers | Available in liquid form, majorly used for application of fertilizers to crops through foliar and fertigation. |


Research Methodology
Mordor Intelligence follows a four-step methodology in all our reports.
- Step-1: IDENTIFY KEY VARIABLES: In order to build a robust forecasting methodology, the variables and factors identified in Step-1 are tested against available historical market numbers. Through an iterative process, the variables required for market forecast are set and the model is built on the basis of these variables.
- Step-2: Build a Market Model: Market-size estimations for the forecast years are in nominal terms. Inflation is not a part of the pricing, and the average selling price (ASP) is kept constant throughout the forecast period for each country.
- Step-3: Validate and Finalize: In this important step, all market numbers, variables and analyst calls are validated through an extensive network of primary research experts from the market studied. The respondents are selected across levels and functions to generate a holistic picture of the market studied.
- Step-4: Research Outputs: Syndicated Reports, Custom Consulting Assignments, Databases & Subscription Platforms


