North America Non-dairy Cheese Market Size and Share
Market Overview
| Study Period | 2021 - 2031 |
|---|---|
| Forecast Data Period | 2026 - 2031 |
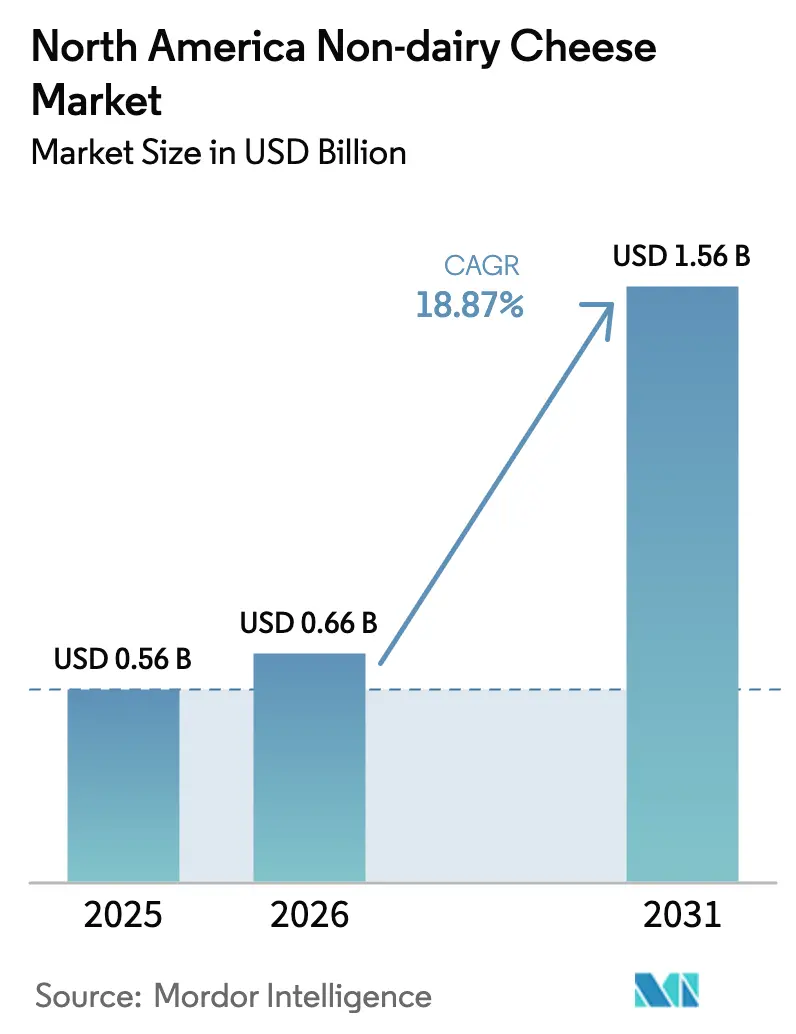
| Base Year Market Size (2025) | USD 0.56 Billion |
| Market Size (2026) | USD 0.66 Billion |
| Market Size (2031) | USD 1.56 Billion |
| Growth Rate (2026 - 2031) | 18.87% CAGR |
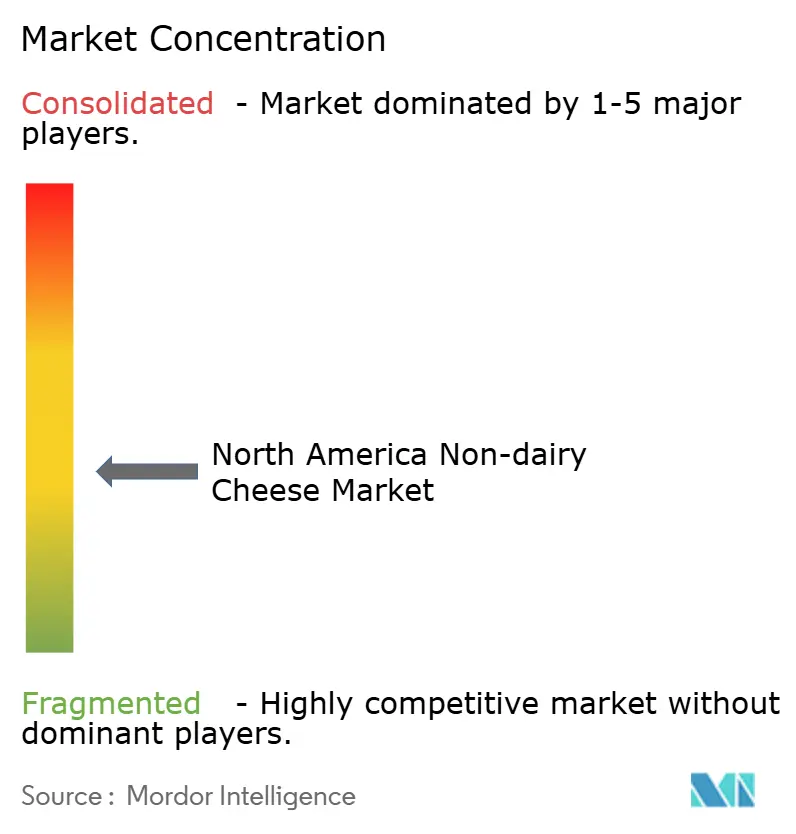
| Market Concentration | Medium |
Major Players *Disclaimer: Major Players sorted in no particular order Image © Mordor Intelligence. Reuse requires attribution under CC BY 4.0. | |
North America Non-dairy Cheese Market Analysis by Mordor Intelligence
The North America non-dairy cheese market size was valued at USD 0.56 billion in 2025 and is estimated to grow from USD 0.66 billion in 2026 to reach USD 1.56 billion by 2031, at a CAGR of 18.87% during the forecast period (2026-2031). The increasing demand is driven by advancements in precision fermentation technology that replicate the functionality of casein, along with nut-based formulations that successfully mimic the melting and stretching properties of mozzarella. Regulatory developments are also playing a key role in facilitating commercialization. Health Canada’s 2024 “no-objection” letter for Remilk’s animal-free milk protein has established a framework for introducing novel ingredients, while the United States Food and Drug Administration’s (FDA) 2025 draft labeling guidance has standardized nutrient disclosures, thereby reducing compliance costs for startups. Investors are increasingly directing capital toward fermentation infrastructure as startups achieve parity with traditional dairy cheese in taste tests. At the same time, large dairy companies are divesting their branded plant-based assets, creating opportunities for specialized firms to innovate in areas such as flavor development, allergen-friendly formulations, and omnichannel distribution strategies.
Key Report Takeaways
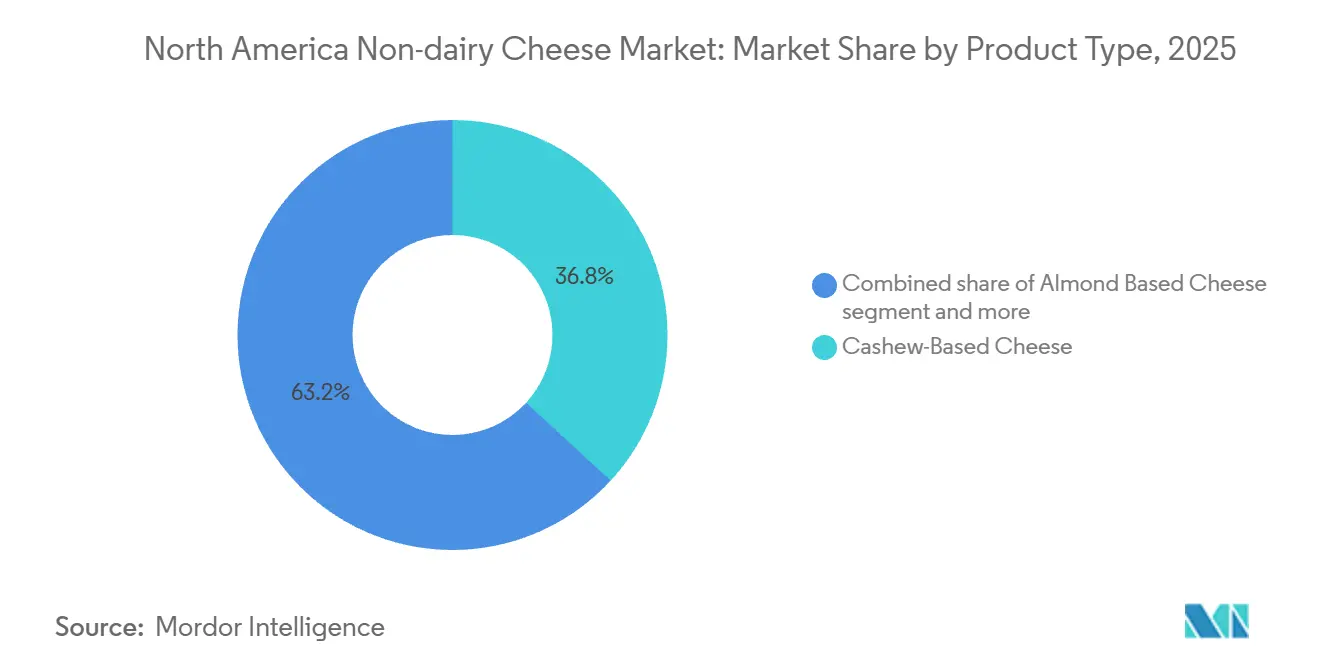
- By product type, cashew-based cheese led with 36.84% of the North America non-dairy cheese market share in 2025; almond-based variants are projected to expand at a 20.31% CAGR through 2031.
- By form, shredded cheese commanded 33.12% of 2025 revenue, whereas sliced cheese is forecast to post the fastest 20.33% CAGR to 2031.
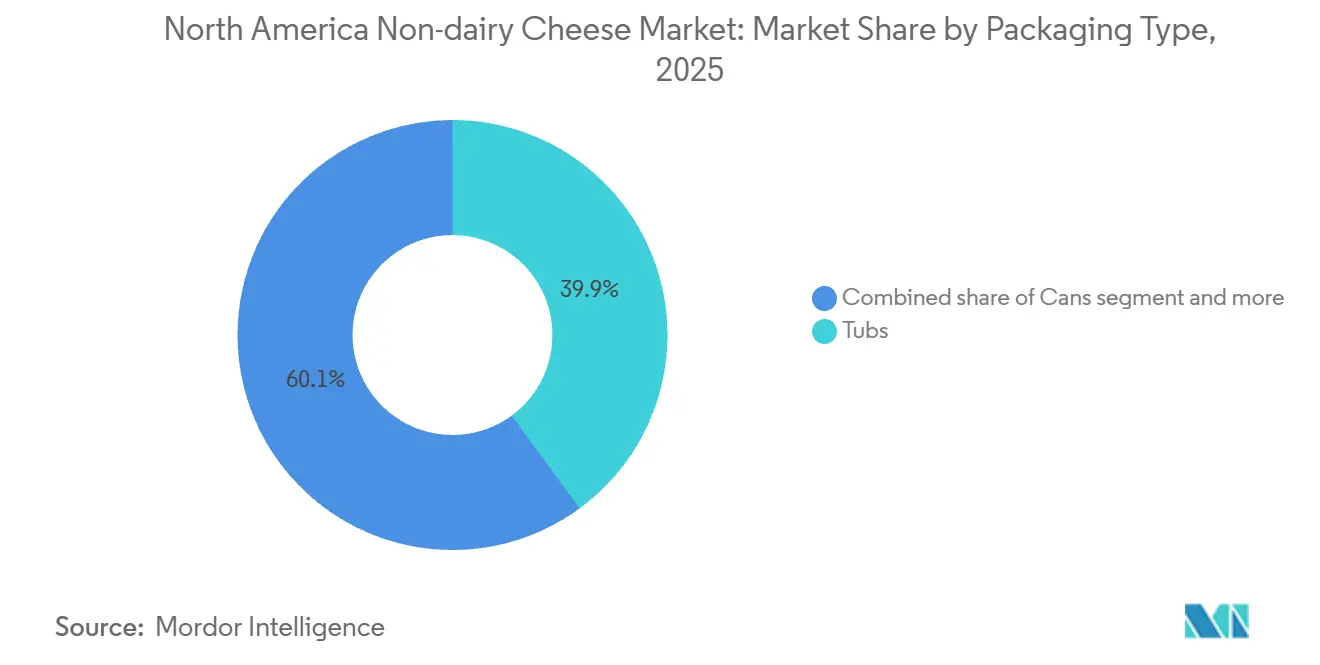
- By packaging, tubs captured 39.93% of 2025 sales, yet cans are set to rise at a 20.88% CAGR on the back of shelf-stable innovations.
- By distribution, off-trade channels secured 93.82% of value in 2025; on-trade is expected to climb at a 20.09% CAGR through 2031.
- By geography, the United States accounted for 78.21% of 2025 revenue, while Canada is poised for a 20.00% CAGR to 2031.
Note: Market size and forecast figures in this report are generated using Mordor Intelligence’s proprietary estimation framework, updated with the latest available data and insights as of 2026.
North America Non-dairy Cheese Market Trends and Insights
Drivers Impact Analysis*
| Driver | (~) % Impact on CAGR Forecast | Geographic Relevance | Impact Timeline |
|---|---|---|---|
| Rising prevalence of lactose intolerance | +3.2% | United States, Canada, with higher incidence in urban centers with diverse ethnic populations | Medium term (2-4 years) |
| Growing vegan and flexitarian populations | +4.1% | United States (coastal metros), Canada (Toronto, Vancouver), Mexico (urban centers) | Long term (≥ 4 years) |
| Increasing health consciousness for cholesterol-free, lower-fat alternatives | +3.5% | United States, Canada, with early adoption in health-focused retail channels | Medium term (2-4 years) |
| Heightened awareness of environmental sustainability and lower carbon footprints of plant-based foods | +2.8% | United States (West Coast), Canada (national), Mexico (limited to upper-middle class) | Long term (≥ 4 years) |
| Animal welfare concerns driving avoidance of dairy farming practices | +2.1% | United States, Canada, with stronger influence in millennial and Gen Z cohorts | Long term (≥ 4 years) |
| Product innovations improving flavor, texture, and meltability through precision fermentation and new bases like oat and pea | +4.5% | United States, Canada, with pilot launches in Mexico for HRI sector | Short term (≤ 2 years) |
| Source: Mordor Intelligence | |||


Rising prevalence of lactose intolerance
Lactose intolerance affects a significant portion of the United States population, with particularly high prevalence among ethnic groups such as individuals of East Asian, West African, Arab, Jewish, Greek, and Indigenous American descent. [1]Source: National Institute of Diabetes and Digestive and Kidney Diseases, “Lactose Intolerance,” niddk.nih.gov This creates a steady and reliable demand for dairy-free cheese, irrespective of changing dietary trends. The genetic predisposition to lactose intolerance encourages repeat purchases among consumers who experience gastrointestinal discomfort from traditional cheese, resulting in a reduced sensitivity to price and a greater willingness to invest in functional alternatives. Urban areas characterized by higher ethnic diversity, including cities like Los Angeles, New York, Toronto, and Vancouver, show notably higher consumption of plant-based cheese on a per-person basis due to the concentration of lactose-intolerant populations. In December of the year two thousand twenty-four, the United States Food and Drug Administration revised its definition of "healthy" nutrient content claims. This update allows plant-based cheese products to carry the "healthy" label if they comply with specific limits on saturated fat, sodium, and added sugars. This change positions lactose-free formulations as both a medically necessary option and a nutritionally beneficial choice. To meet the growing demand, retailers are increasing the space allocated to dairy-alternative products, with specialty chains dedicating a significant portion of refrigerated cheese sections to plant-based options in markets with high levels of ethnic diversity.
Growing vegan and flexitarian populations
Vegan and flexitarian dietary patterns are becoming increasingly popular across North America, with flexitarians representing a broader market opportunity compared to strict vegans. This is because flexitarians choose to substitute animal products on a meal-by-meal basis rather than completely eliminating them. Surveys conducted by Morning Consult and the Good Food Institute reveal that many North American consumers are open to trying animal-free dairy products after receiving brief educational information about production methods. This highlights the potential of awareness campaigns to drive adoption beyond the core vegan demographic [2]Source: The Good Food Institute, “Fermentation for meat, seafood, eggs, dairy, and ingredients,” gfi.org. Younger generations, particularly millennials and Generation Z, are leading this trend, motivated by health, environmental, and ethical considerations. In Canada, plant-based cheese sales are growing at a faster per-capita rate compared to the United States, supported by stronger government backing for plant-based food innovation and a higher baseline of vegetarian consumption. Social media platforms and micro-influencers are playing a significant role in promoting product discovery, especially for premium artisanal brands like Treeline Cheese and Parmela Creamery. These brands use platforms such as Instagram and TikTok to highlight features like melt performance and recipe versatility. Additionally, foodservice operators are increasingly incorporating plant-based cheese options into pizza, pasta, and sandwich menus. This trend helps normalize consumption and reduces the perception of plant-based cheese as a niche product.
Increasing health consciousness for cholesterol-free, lower-fat alternatives
Health-conscious consumers are increasingly choosing cholesterol-free and lower-saturated-fat alternatives to dairy cheese, driven by growing awareness of cardiovascular disease risks and dietary guidelines recommending that saturated fat intake should remain below ten percent of daily calories. Almond-based cheese, which contains no cholesterol and significantly less saturated fat than dairy mozzarella, serves as a practical alternative for individuals managing high cholesterol levels or following Mediterranean-style diets. The United States Food and Drug Administration's updated "healthy" claim criteria, finalized in December 2024, allow plant-based cheese products to feature front-of-package health messaging if they meet specific nutrient thresholds. This regulatory change improves shelf visibility and influences purchasing decisions. Fortification with calcium, vitamin D, and vitamin B12 has become a standard practice among leading brands, addressing nutrient deficiencies that previously discouraged health-conscious consumers from transitioning away from dairy products. A multicriteria analysis published in the Proceedings of the National Academy of Sciences in December 2024 demonstrated that replacing dairy with fortified soy-based products reduced diet-related mortality by approximately four point three percent per calorie, supporting the health benefits of plant-based cheese when adequately fortified with micronutrients. Retailers are now positioning plant-based cheese alongside organic and functional foods rather than in specialty vegan sections, increasing exposure to mainstream health-conscious shoppers.
Heightened awareness of environmental sustainability and lower carbon footprints of plant-based foods
Environmental sustainability is becoming a key factor in purchasing decisions, especially among younger consumers who value products with reduced greenhouse gas emissions, lower water usage, and minimal land-use changes. A peer-reviewed life cycle assessment published in November 2024 highlighted that plant-based milk alternatives produce significantly fewer greenhouse gas emissions compared to dairy milk on a per-kilogram basis. Among these, soy and oat formulations have the smallest carbon footprints. Almond-based cheese, while requiring higher water consumption due to irrigation-intensive almond cultivation in California, uses a fraction of the land area needed for dairy cheese production, which involves pasture for cattle and feed-crop cultivation. A literature review of ice cream life cycle assessments, published by the Royal Society of Chemistry in November 2025, indicated that dairy ice cream generates substantial greenhouse gas emissions at the farm gate. Raw milk production is responsible for a significant portion of these emissions, emphasizing the upstream carbon intensity of dairy ingredients [3]Source: Royal Society of Chemistry, “Sustainable Food Technology,” pubs.rsc.org. Brands are incorporating these findings into marketing strategies, with front-of-package carbon footprint labels now featured on products from companies such as Miyoko's Creamery and Kite Hill. Furthermore, the United States Environmental Protection Agency and Agriculture Canada are developing standardized methodologies for food carbon labeling. These standards aim to enable direct comparisons and influence procurement decisions by institutional buyers and corporate cafeterias.
Restraints Impact Analysis*
| Restraint | (~) % Impact on CAGR Forecast | Geographic Relevance | Impact Timeline |
|---|---|---|---|
| Inferior taste and texture compared to traditional dairy cheese, deterring repeat purchases | -2.8% | United States, Canada, Mexico, with higher impact in rural and price-sensitive segments | Medium term (2-4 years) |
| High allergen risks from nut-based varieties, excluding nut-allergic consumers | -1.5% | United States, Canada, with regulatory scrutiny from FDA on cross-contact prevention | Short term (≤ 2 years) |
| Regulatory hurdles on labeling and use of dairy-like terms causing compliance delays | -1.2% | United States (FDA jurisdiction), Canada (CFIA), Mexico (COFEPRIS) | Short term (≤ 2 years) |
| Supply chain disruptions and reliance on imported plant ingredients | -1.8% | United States, Canada, Mexico, with exposure to California almond supply and overseas cashew imports | Medium term (2-4 years) |
| Source: Mordor Intelligence | |||
Inferior taste and texture compared to traditional dairy cheese, deterring repeat purchases
Taste and texture deficiencies remain significant barriers to repeat purchases, with consumer surveys consistently identifying flavor and melt performance as key factors influencing satisfaction. Many first-generation plant-based cheeses utilize starch, gums, and coconut oil to mimic dairy cheese, resulting in a waxy texture and limited stretch when heated. Precision-fermented casein and whey proteins are addressing these challenges by replicating the molecular structure of dairy proteins, enabling micelle formation and gelation to deliver authentic stretch and browning. For example, New Culture's alpha-casein formulations achieved mozzarella-like melt at specific inclusion rates in 2024, demonstrating that functional parity can be achieved at commercially viable costs. However, the broader adoption of precision-fermented ingredients is hindered by limited fermentation capacity and high production costs, which currently result in retail prices being significantly higher than dairy cheese for processed plant-based alternatives. Brands that fail to meet consumer expectations during initial trials face high attrition rates, with repeat purchase rates for products with inferior taste falling below acceptable levels in certain categories. Sensory benchmarking against dairy cheese is increasingly becoming standard practice, with leading brands conducting blind taste tests and refining formulations to achieve parity prior to launch.
High allergen risks from nut-based varieties, excluding nut-allergic consumers
Tree nut allergies affect a small percentage of the North American population. In recent years, the United States Food and Drug Administration designated sesame as a major allergen under the Food Allergen Safety, Treatment, Education, and Research Act, increasing regulatory focus on allergen management in food manufacturing. Cashew-based and almond-based cheeses, which dominate the market, are not suitable for nut-allergic consumers and present cross-contact risks in shared manufacturing facilities. The United States Food and Drug Administration mandates clear allergen labeling under Title 21 of the Code of Federal Regulations (CFR) Part 101, and manufacturers are required to implement allergen control plans to prevent cross-contact during production. These measures increase compliance costs and restrict co-manufacturing opportunities. Oat-based and pea-protein-based formulations are gaining traction as allergen-friendly alternatives, offering reduced allergen risks and greater accessibility for consumers. Health Canada recently issued a Letter of No Objection for Remilk's animal-free milk protein, which included guidance on communicating allergenic risks to dairy-allergic consumers. This set a precedent, indicating that precision-fermented dairy proteins may still trigger reactions in individuals with dairy allergies, despite being produced without animals. Additionally, retailers are increasingly demanding dedicated allergen-free production lines or third-party certification for nut-free claims, creating higher entry barriers for small-scale producers.
*Our forecasts treat driver/restraint impacts as directional, not additive. The impact forecasts reflect baseline growth, mix effects, and variable interactions.
Segment Analysis
By Type: Precision Fermentation Elevates Almond Segment
Almond-based cheese is expected to grow at a significant compound annual growth rate from 2026 to 2031, marking the fastest growth rate among product types. This growth is driven by its cholesterol-free profile, lower saturated fat content, and vitamin E benefits, which appeal to consumers focused on cardiovascular health. Cashew-based cheese held a notable share of the market in 2025, driven by its superior creaminess and neutral flavor, which closely resembles dairy cheese in dips, spreads, and soft varieties. Soy-based cheese offers the highest protein content among plant-based options, providing higher protein per serving compared to nut-based varieties, making it an attractive choice for protein-conscious consumers.
Other varieties, such as oat-based, pea-protein-based, and coconut-based cheeses, are gaining popularity due to their lower allergen risks and regional sourcing advantages. Oat-based cheese, in particular, benefits from domestic cultivation in the United States and Canada. Additionally, precision-fermented casein and whey proteins are being incorporated into almond-based and cashew-based formulations to improve melt and stretch properties. For instance, New Culture achieved mozzarella-like functionality with specific inclusion rates in 2024. However, almond cultivation in California faced drought-related yield reductions in 2024, leading to increased input costs. This prompted manufacturers to explore alternative nut sources or hybrid formulations, blending almonds with oats or peas to mitigate cost volatility. Despite its strong nutritional profile, soy-based cheese remains underutilized due to persistent consumer concerns about genetically modified soybeans and phytoestrogen content. This is despite scientific consensus affirming that moderate soy consumption is both safe and beneficial for cardiovascular health.


By Form: Foodservice Drives Slices Adoption
Slices are expected to grow at a compound annual growth rate (CAGR) of 20.33% from 2026 to 2031, marking the fastest growth rate among cheese formats. This growth is primarily driven by the foodservice industry's demand for pre-portioned, labor-saving options that ensure consistent portion control and reduce preparation time in high-volume kitchens. Shredded cheese held 33.12% of the market share in 2025, showcasing its versatility in various applications such as pizza, tacos, pasta, and salads, along with its ability to melt evenly when heated. Blocks continue to appeal to home cooks and artisanal users who prefer to grate or slice cheese fresh. These formats also offer a premium positioning with higher profit margins compared to pre-shredded options. Cubes address the growing demand in the snacking and charcuterie segments, as consumers increasingly seek convenient, protein-rich snack choices. Other formats, including spreads, dips, and cream-cheese-style products, cater to breakfast and appetizer occasions.
Demand from the hotel, restaurant, and institutional (HRI) sector is recovering ahead of the FIFA World Cup 2026, with tourism-driven consumption increasing in major cities and border regions. This trend supports the growth of sliced formats, which integrate seamlessly into sandwich, burger, and breakfast menus. However, shredded cheese is facing competition from precision-fermented mozzarella alternatives that provide superior melting and stretching properties. Companies such as Perfect Day and Remilk are supplying whey and casein proteins to cheese manufacturers targeting pizza and Italian foodservice applications.
By Packaging Type: Cans Extend Shelf Life
Cans are expected to grow at a compound annual growth rate (CAGR) of 20.88% from 2026 to 2031, representing the fastest growth rate among packaging formats. This growth is driven by their ability to extend shelf-life, reduce refrigeration requirements, and their suitability for convenience stores and vending channels where cold-chain infrastructure is limited. In 2025, tubs accounted for 39.93% of the market share, showcasing their dominance in packaging cream-cheese-style spreads, dips, and soft cheese varieties that are typically consumed within days of opening. Tins are used for niche applications such as gift sets, specialty imports, and long-shelf-life products designed for camping and emergency preparedness. Sustainability is playing an increasingly important role in packaging decisions, with brands adopting recyclable aluminum cans and post-consumer recycled plastic tubs to reduce environmental impact and appeal to environmentally conscious consumers.
Cans provide the added benefit of eliminating the need for continuous refrigeration until they are opened, which helps reduce energy consumption across the supply chain and lowers logistics costs for distributors serving remote or rural areas. Tubs remain the preferred option for products that require resealability and multiple servings, such as cream cheese, ricotta-style cheese, and dips. Additionally, tubs offer superior barrier properties to prevent oxidation and moisture loss, ensuring product freshness over time.
By Distribution Channel: On-Trade Rebounds Post-Pandemic
On-trade channels are projected to grow at a compound annual growth rate (CAGR) of 20.09% from 2026 to 2031, recovering from pandemic-related closures as demand from hotel, restaurant, and institutional sectors rebounds and tourism-driven consumption rises, particularly in anticipation of the FIFA World Cup 2026. Off-trade channels accounted for 93.82% of the market share in 2025, highlighting the dominance of supermarkets, hypermarkets, convenience stores, specialist retailers, and online retail in catering to home consumption needs. Within the off-trade segment, online retail is growing at a faster pace than traditional brick-and-mortar outlets, driven by direct-to-consumer brands, subscription models, and e-commerce platforms offering wider product assortments and home delivery convenience.
Foodservice operators are increasingly incorporating plant-based cheese options into their menus to meet consumer demand and accommodate dietary restrictions. Pizza chains, fast-casual restaurants, and university dining halls are now offering dairy-free mozzarella and cheddar as standard menu items. Supermarkets and hypermarkets are expanding dedicated plant-based sections and integrating non-dairy cheese products into mainstream dairy aisles to enhance visibility and encourage trial among non-vegan consumers. Convenience stores are adopting shelf-stable canned formats and single-serve portions to target on-the-go snacking occasions, particularly in urban areas with high foot traffic.
Geography Analysis
In 2025, the United States captured 78.21% of the regional market share, driven by high per-capita consumption, extensive retail distribution networks, and the presence of leading plant-based cheese brands such as Miyoko's Creamery, Kite Hill, Follow Your Heart, and Tofutti Brands. Coastal metropolitan areas like Los Angeles, San Francisco, New York, and Seattle showed significantly higher adoption rates due to concentrated vegan and flexitarian populations, higher income levels, and greater retail availability of specialty plant-based products. The release of draft labeling guidance for plant-based dairy alternatives by the United States Food and Drug Administration (FDA) in January 2025 established standardized compliance pathways and reduced regulatory uncertainty, which is expected to boost new product launches and retail expansion. Additionally, precision-fermented dairy proteins from companies such as Perfect Day, Remilk, New Culture, and ImaginDairy received Generally Recognized as Safe (GRAS) affirmations or "no questions" letters in 2024 and 2025, enabling ingredient supply to cheese manufacturers and positioning the United States as a global leader in fermentation-derived cheese innovation.
Canada is anticipated to grow at a compound annual growth rate (CAGR) of 20.00% from 2026 to 2031, making it the fastest-growing market in the region. This growth is fueled by higher per-capita adoption of plant-based products, provincial retail mandates requiring shelf space for dairy alternatives, and government initiatives supporting plant-based food innovation. In January 2024, Health Canada issued a Letter of No Objection to Remilk for its animal-free milk protein, setting a regulatory precedent that facilitates market entry for precision-fermented cheese ingredients and signals openness to novel food technologies.
Mexico, while smaller in size, remains a strategically important market. Plant-based cheese is positioned as a premium, health-oriented product targeting urban upper-middle-class consumers in cities such as Mexico City, Guadalajara, and Monterrey. According to the United States Department of Agriculture (USDA) Foreign Agricultural Service, Mexico imported USD 1.1 billion worth of cheese and curd in 2024, with the majority sourced from the United States. This underscores the integration of cross-border supply chains and highlights the addressable market for plant-based cheese exports under the United States-Mexico-Canada Agreement (USMCA).
Competitive Landscape
The North America non-dairy cheese market is highly fragmented, with numerous specialized startups, regional artisanal producers, and limited participation from established dairy processors. In 2024, Danone divested its WhiteWave and Silk plant-based portfolio, while Maple Leaf Foods sold Field Roast to Greenleaf Foods. These developments highlight a shift by large-scale dairy and meat conglomerates away from direct plant-based cheese operations, focusing instead on ingredient supply or contract manufacturing. This shift has created opportunities for specialized players such as Miyoko's Creamery, Kite Hill, Treeline Cheese, Follow Your Heart, Parmela Creamery, and Dr-Cow Tree Nut Cheese. These companies are utilizing precision-fermented casein fractions, cultured fermentation processes, and artisanal positioning to stand out from mass-market offerings.
In August 2025, Good Planet Foods and Schuman Cheese announced a joint venture, combining Schuman's Vevan foodservice line with Good Planet's retail distribution network. This collaboration aims to expand production capacity, streamline distribution, and accelerate formulation innovation. Precision fermentation is becoming a key technological advantage, with companies like Perfect Day, Remilk, New Culture, and ImaginDairy receiving Generally Recognized as Safe (GRAS) affirmations or "no questions" letters from the United States Food and Drug Administration (FDA) in 2024 and 2025. These approvals enable ingredient supply to cheese manufacturers and position early adopters to achieve functional parity with dairy cheese in terms of melt, stretch, and browning capabilities.
New Culture has developed low-inclusion formulations using alpha-casein at 9-15 percent concentration in mozzarella analogs. This approach reduces cost-in-use while maintaining functional performance, addressing the primary challenge of high ingredient costs. Contract manufacturing and retrofitting of brewery or biomanufacturing facilities are helping startups scale production without the need for capital-intensive greenfield investments. However, access to fermentation capacity remains a significant bottleneck. Direct-to-consumer channels and subscription models are allowing brands to bypass traditional distribution networks, capture higher margins, and build direct relationships with consumers. These strategies improve demand predictability and enable rapid product iteration based on customer feedback. Additionally, retailers are increasingly requiring dedicated allergen-free production lines or third-party certification for nut-free claims. This trend raises barriers to entry for small-scale producers and benefits vertically integrated manufacturers with proprietary facilities.
North America Non-dairy Cheese Industry Leaders
Danone SA
Good Planet Foods LLC
Maple Leaf Foods Inc.
GreenSpace Brands
Miyoko's Creamery
- *Disclaimer: Major Players sorted in no particular order

Recent Industry Developments
- May 2025: Daiya launched a dairy-free cream cheese in convenient 1oz packets tailored specifically for foodservice operators. These provided the rich, creamy texture consumers craved, in a portable, perfectly portioned format ideal for grab-and-go meals, breakfast bars, and food service applications.
- January 2025: RIND introduced ALPINE SVVISS, a new addition to its range of cashew-based vegan cheeses. Staying true to RIND's artisanal standards, ALPINE SVVISS was gluten-free, cholesterol-free, and certified Kosher Pareve.
- November 2024: The Laughing Cow, a Bel Brands USA company, launched its plant-based spreadable cheese product nationwide. The Laughing Cow’s vegan-certified, non-GMO product was initially available in a garlic and herb flavor, and the company planned to explore spicy additions for 2025.


North America Non-dairy Cheese Market Report Scope
The North America non-dairy cheese market comprises plant-based cheese alternatives made from ingredients such as soy, nuts, seeds, and oats. These products are distributed through retail and foodservice channels, targeting consumers seeking dairy-free, vegan, or lactose-intolerant options. The market is segmented by type, including cashew-based cheese, soy-based cheese, almond-based cheese, and other varieties. It is further divided by form, such as shredded, blocks, cubes, slices, and others, as well as by packaging type, including tubs, tins, and cans. Distribution channels are categorized into on-trade and off-trade, with off-trade further segmented into convenience stores, specialist retailers, supermarkets and hypermarkets, online retail, and others. Geographically, the market encompasses the United States, Canada, Mexico, and the rest of North America. The market sizing has been done in value terms in USD and volume in Tons for all the abovementioned segments.
| Cashew-Based Cheese |
| Soy-Based Cheese |
| Almond-Based Cheese |
| Others |
| Shredded |
| Blocks |
| Cubes |
| Slices |
| Others |
| Tubs |
| Tins |
| Cans |
| On-trade | |
| Off-trade | Convenience Stores |
| Specialist Retailers | |
| Supermarkets and Hypermarkets | |
| Online Retail | |
| Others |
| United States |
| Canada |
| Mexico |
| Rest of North America |
| By Type | Cashew-Based Cheese | |
| Soy-Based Cheese | ||
| Almond-Based Cheese | ||
| Others | ||
| By Form | Shredded | |
| Blocks | ||
| Cubes | ||
| Slices | ||
| Others | ||
| By Packaging Type | Tubs | |
| Tins | ||
| Cans | ||
| By Distribution Channel | On-trade | |
| Off-trade | Convenience Stores | |
| Specialist Retailers | ||
| Supermarkets and Hypermarkets | ||
| Online Retail | ||
| Others | ||
| By Geography | United States | |
| Canada | ||
| Mexico | ||
| Rest of North America | ||


Market Definition
- Dairy Alternatives - Dairy alternatives are foods that are made from plant-based milk/oils instead of their usual animal products, such as cheese, butter, milk, ice cream, yogurt, etc. Plant-based or non-dairy milk alternative is the fast-growing segment in the newer food product development category of functional and specialty beverage across the globe.
- Non-Dairy Butter - Non dairy butter is a vegan butter alternative that is made from a mixture of plant oils. With an increase in alternative diets like vegetarianism, veganism, and gluten intolerance, plant butter is a healthy non-dairy substitute for normal butter.
- Non-Dairy Ice Cream - Plant based ice cream is a growing category. Non-dairy ice cream is a type of dessert made without any animal ingredients. This is typically considered a substitute for regular ice cream for those who cannot or do not eat animal or animal-derived products, including eggs, milk, cream, or honey.
- Plant-Based Milk - Plant based milks are milk substitutes that are made from nuts (e.g., hazelnuts, hemp seeds), seeds (e.g., sesame, walnuts, coconuts, cashews, almonds, rice, oats, etc.) or legumes (e.g., soy). Plant-based milk such as soy milk and almond milk have been popular in East Asia and the Middle East for centuries.
| Keyword | Definition |
|---|---|
| Cultured Butter | Cultured butter is prepared by having the raw butter go through chemical processing and has been added with certain emulsifiers and foreign ingredients. |
| Uncultured Butter | This type of butter is one which has not been processed in any way |
| Natural Cheese | The type of cheese in its most natural form. It is made from natural and simple products and ingredients, including fresh and natural salts, natural colors, enzymes, and high-quality milk. |
| Processed Cheese | Processed cheese undergoes the same processes as natural cheese; however, it requires more steps and many different forms of ingredients. Making processed cheese involves melting natural cheese, emulsifying it, and adding preservatives and other artificial ingredients or colorings. |
| Single Cream | Single cream contains around 18% fat. It’s a single layer of cream that appears over boiled milk. |
| Double Cream | Double cream contains 48% fat, more than double the amount of fat of single cream. It’s heavier and thicker than single cream |
| Whipping Cream | This has a much higher fat percentage than single cream (36%). Used to top cakes, pies, and puddings and as a thickener for sauces, soups, and fillings. |
| Frozen Desserts | Desserts that are meant to be eaten in frozen condition. E.g., sherbets, sorbets, frozen yogurts |
| UHT Milk (Ultra-high temperature milk) | Milk heated at a very high temperature. Ultra-high-temperature processing (UHT) of milk involves heating for 1–8 sec at 135–154°C. which kills the spore-forming pathogenic microorganism, resulting in a product with a shelf-life of several months. |
| Non-dairy butter/Plant-based butter | Butter made from plant-derived oil such as coconut, palm, etc. |
| Non-dairy Yogurt | Yogurt made from typically made from nuts, like almonds, cashews, coconuts, and even other foods like soybeans, plantains, oats, and peas |
| On-trade | It refers to restaurants, QSRs, and bars. |
| Off-trade | It refers to supermarkets, hypermarkets, on-line channels, etc. |
| Neufchatel cheese | One of the oldest kinds of cheese in France. It is a soft, slightly crumbly, mold-ripened, bloomy-rind cheese made in the Neufchâtel-en-Bray region of Normandy. |
| Flexitarian | It refers to a consumer preferring a semi-vegetarian diet, that is centered on plant foods with limited or occasional inclusion of meat. |
| Lactose Intolerance | Lactose intolerance is a reaction in digestive system to lactose, the sugar in milk. It causes uncomfortable symptoms in response to the consumption of dairy products. |
| Cream Cheese | Cream cheese is a soft and creamy fresh cheese with a tangy taste made from milk and cream. |
| Sorbets | Sorbet is a frozen dessert made using ice combined with fruit juice, fruit purée, or other ingredients, such as wine, liqueur, or honey. |
| Sherbet | Sherbet is a sweetened frozen dessert made with fruit and some sort of dairy product such as milk or cream. |
| Shelf stable | Foods that can be safely stored at room temperature, or "on the shelf," for at least one year and do not have to be cooked or refrigerated to eat safely. |
| DSD | Direct Store Delivery is the process in supply chain management wherein the product is delivered from manufacturing plant directly to the retailer. |
| OU Kosher | Orthodox Union Kosher is a kosher certification agency based in New York City. |
| Gelato | Gelato is a frozen creamy dessert made with milk, heavy cream and sugar. |
| Grass-fed Cows | Grass-fed cows are allowed to graze in pastures, where they eat a variety of grasses and clover. |


Research Methodology
Mordor Intelligence follows a four-step methodology in all our reports.
- Step-1: Identify Key Variables: In order to build a robust forecasting methodology, the variables and factors identified in Step 1 are tested against available historical market numbers. Through an iterative process, the variables required for market forecast are set, and the model is built on the basis of these variables.
- Step-2: Build a Market Model: Market-size estimations for the forecast years are in nominal terms. Inflation is not a part of the pricing, and the average selling price (ASP) is kept constant throughout the forecast period for each country.
- Step-3: Validate and Finalize: In this important step, all market numbers, variables, and analyst calls are validated through an extensive network of primary research experts from the market studied. The respondents are selected across levels and functions to generate a holistic picture of the market studied.
- Step-4: Research Outputs: Syndicated Reports, Custom Consulting Assignments, Databases & Subscription Platforms


