Market Overview
| Study Period | 2021 - 2031 |
|---|---|
| Forecast Data Period | 2026 - 2031 |
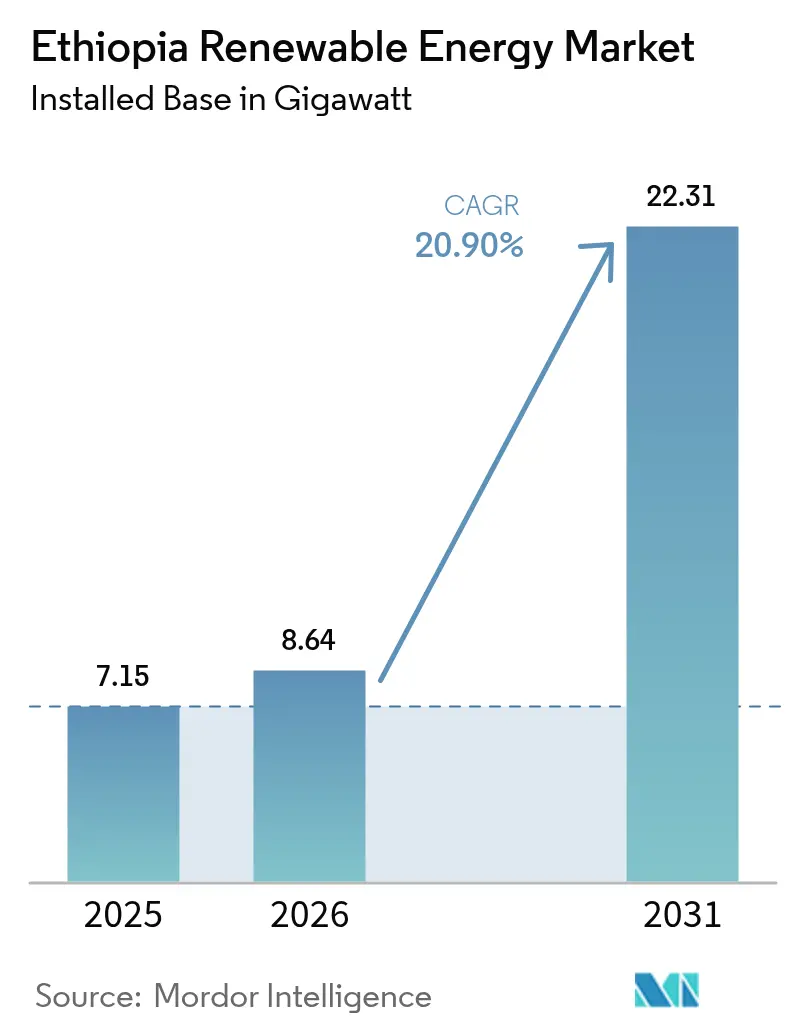
| Base Year Market Size (2025) | 7.15 gigawatt |
| Market Volume (2026) | 8.64 gigawatt |
| Market Volume (2031) | 22.31 gigawatt |
| Growth Rate (2026 - 2031) | 20.90% CAGR |
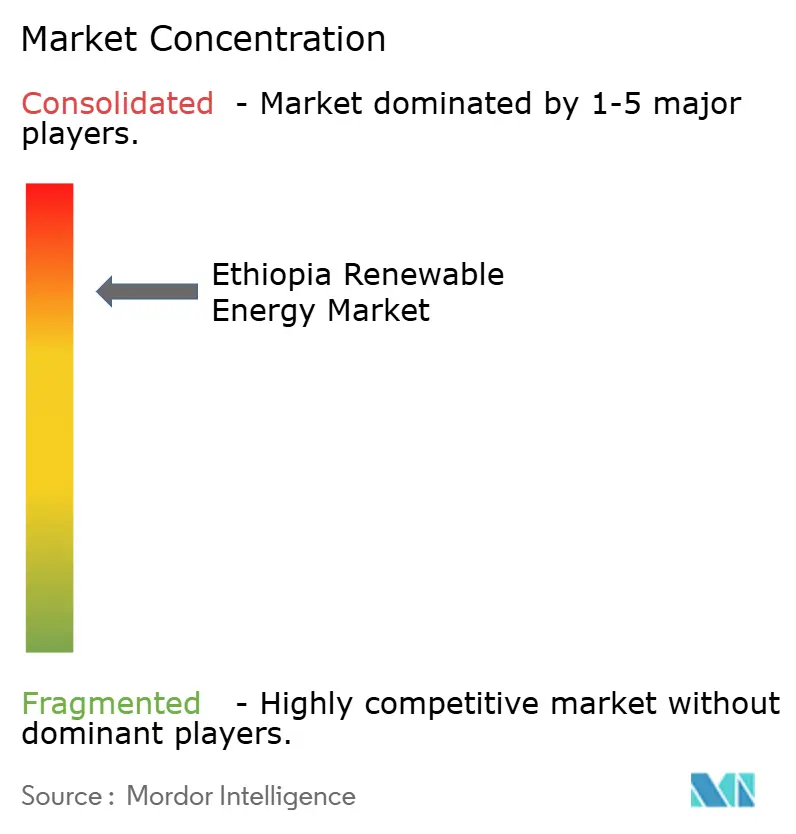
| Market Concentration | High |
Major Players *Disclaimer: Major Players sorted in no particular order Image © Mordor Intelligence. Reuse requires attribution under CC BY 4.0. | |
Ethiopia Renewable Energy Market Analysis by Mordor Intelligence
Ethiopia Renewable Energy Market size in 2026 is estimated at 8.64 gigawatt, growing from 2025 value of 7.15 gigawatt with 2031 projections showing 22.31 gigawatt, growing at 20.90% CAGR over 2026-2031.
Robust policy support, sustained multilateral finance, and July 2024 foreign-exchange reforms that allow exporters to retain 50% of hard-currency proceeds are steering capital toward non-hydro technologies, while cementing the country’s role as a regional power exporter. Hydropower still supplies most capacity, yet drought risks and the commissioning of Africa’s largest onshore wind farm in June 2025 signal a decisive portfolio shift. The Ethiopia-Kenya 2,000 MW HVDC interconnector, which moved 977 GWh in fiscal 2023/24, has converted surplus generation into USD 200 million in export revenue and validated Ethiopia’s hub strategy. Geothermal drilling, wind-turbine localization, and a nascent solar manufacturing base now benefit from easier currency repatriation and a liberalized public-private-partnership (PPP) framework, which together shorten project lead times.
Key Report Takeaways
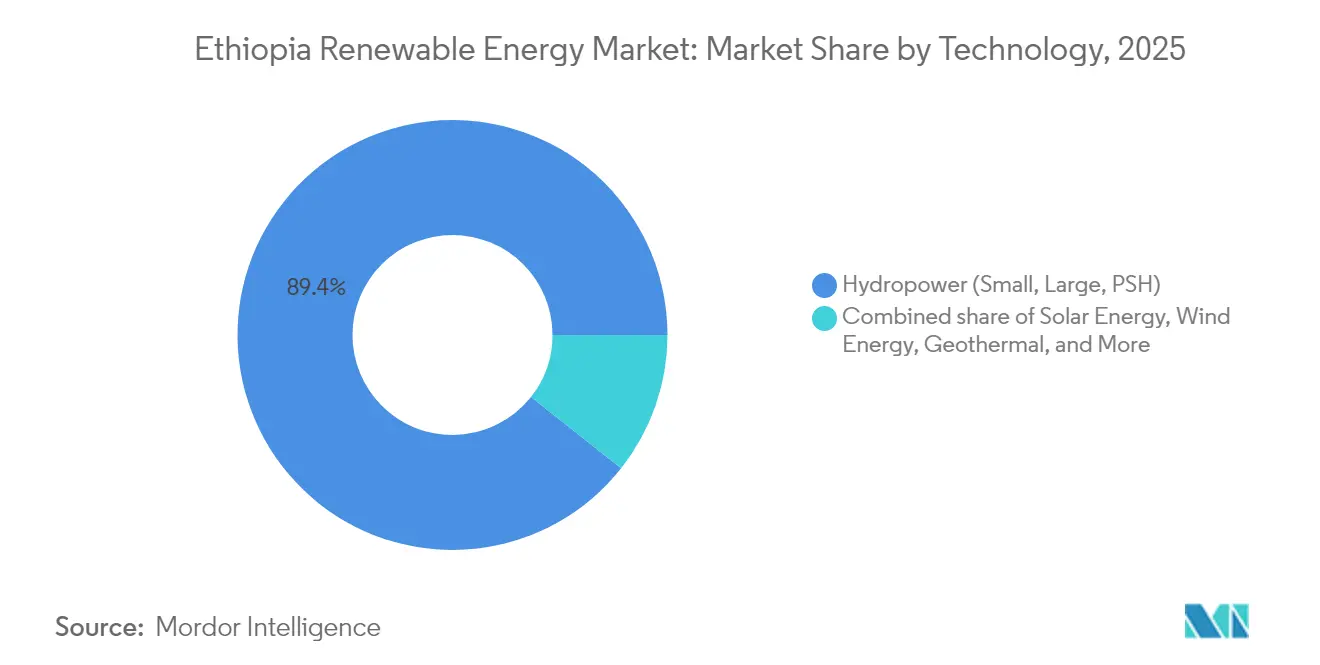
- By technology, hydropower retained 89.35% of the Ethiopian renewable energy market share in 2025, while solar generation is projected to expand at a 87.60% CAGR through 2031.
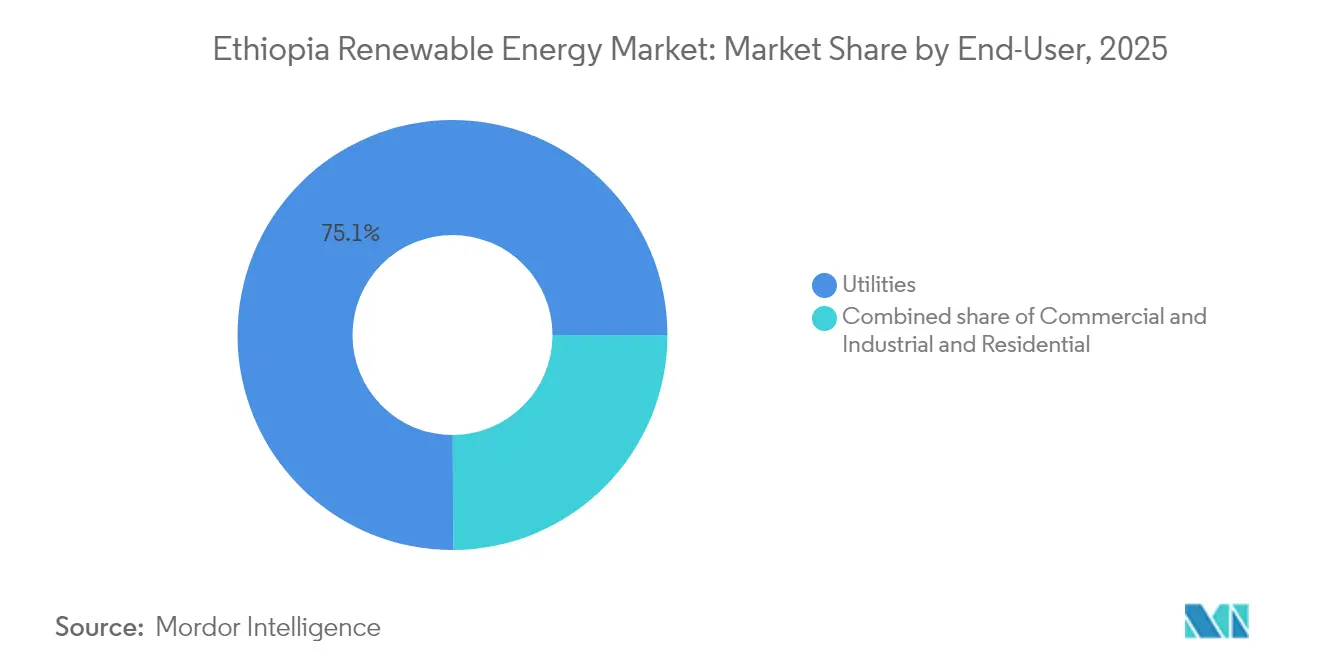
- By end-user, utilities accounted for 75.05% of installations in 2025; the same segment is forecast to lead growth at a 23.30% CAGR through 2031.
- By geography, Oromia hosted 59.40% of the installed capacity in 2025, whereas Tigray–Afar wind assets are poised for the fastest expansion once the 230 kV evacuation upgrades are completed in 2027.
- Three EPC groups, PowerChina, Gezhouba, and Dongfang Electric, have collectively executed projects representing 85% of the hydropower and wind capacity financed since 2019.
- GERD’s ultimate 5,150 MW output and the Ethiopia-Kenya interconnector together could earn USD 71 million–USD 498 million in annual power-export revenue by 2030.
Note: Market size and forecast figures in this report are generated using Mordor Intelligence’s proprietary estimation framework, updated with the latest available data and insights as of 2026.
Ethiopia Renewable Energy Market Trends and Insights
Drivers Impact Analysis*
| Driver | (~) % Impact on CAGR Forecast | Geographic Relevance | Impact Timeline |
|---|---|---|---|
| National Electrification Program 2.0 targets universal access | +6.20% | Oromia, Amhara, SNNPR rural zones | Medium term (2–4 years) |
| Abundant hydro, wind, solar & geothermal resources | +5.80% | Rift Valley, Tigray/Afar, southern highlands | Long term (≥ 4 years) |
| Multilateral green-finance inflows | +4.70% | National, routed via EEP and IPPs | Short term (≤ 2 years) |
| Industrial and population-driven demand surge | +3.90% | Addis Ababa data-center belt, industrial parks | Medium term (2–4 years) |
| Eastern Africa Power Pool exports | +3.10% | Kenya, Djibouti, Sudan corridors | Medium term (2–4 years) |
| Mini-grid liberalization | +2.60% | Gambella, Benishangul-Gumuz, Somali Region | Short term (≤ 2 years) |
| Source: Mordor Intelligence | |||
National Electrification Program 2.0 Drives Universal Access Mandate
The second phase of Ethiopia's electrification strategy blends grid extensions with off-grid solutions to reach 100% access by 2030. The World Bank's USD 500 million financing under the ADELE project supports the establishment of 5 million new rural connections and prioritizes the development of 25 additional solar mini-grids.(1)World Bank Staff, “Access to Distributed Electricity and Lighting in Ethiopia (ADELE),” World Bank Group, worldbank.org Electrification climbed from 44% to 54% between 2024 and 2025, but 46% of rural households still lack power, justifying a hybrid model that combines 65% grid supply and 35% distributed systems.(2)Ethiopian News Agency, “Electrification Rate Reaches 54%,” ena.et Institutional reforms embed gender parity by mandating that Ethiopian Electric Utility raise female employment to 30% by 2025, a move expected to expand the national talent pool.
Multilateral Green-Finance Inflows Accelerate Infrastructure Development
Concessional and blended finance remain pivotal. The African Development Bank has committed USD 348 million to the Ethiopia-Kenya electricity highway and USD 10 million to the Tulu Moye geothermal field. China pledged USD 1.7 billion in 2025 for solar cell manufacturing and mineral processing, including USD 360 million for Hanergy's plant and a planned 2 GW cell facility by Toyo. The World Bank's USD 200 million Renewable Energy Guarantees Program de-risks up to 1,000 MW of private wind and solar projects, while BRICS membership opens lines of credit with the New Development Bank, easing dependence on Western lenders.
Eastern Africa Power Pool Exports Create Regional Revenue Streams
Since its commercial start-up in 2023, the 1,045 km Ethiopia-Kenya HVDC link has shifted near-baseload hydropower into foreign-exchange earnings. Kenya saved USD 500 million by importing electricity from Ethiopia instead of operating its thermal plants. Planned extensions to Tanzania and Uganda could increase Ethiopia’s exportable surplus from 878 MW in 2025 to 3,430 MW by 2027, leveraging the complementarity of the wet season across the Nile Basin.
Industrial and Population-Driven Electricity Demand Surge
Industrial parks specializing in textiles, agro-processing, and mining now drive significant demand, resulting in a 30% year-on-year increase in national electricity consumption. Ethiopia’s January 2024 ban on internal-combustion-engine vehicle imports aims for 148,000 EVs by 2032, requiring 2,226 public chargers that intensify distributed load growth.
Restraints Impact Analysis*
| Restraint | (~) % Impact on CAGR Forecast | Geographic Relevance | Impact Timeline |
|---|---|---|---|
| High capital costs and limited domestic financing | -3.80% | National, acute for geothermal and high-voltage lines | Medium term (2–4 years) |
| Transmission bottlenecks and curtailment risk | -2.90% | Gondar-Metema corridor, Tigray wind belt, Omo-Gibe cascade | Short term (≤ 2 years) |
| Political instability delaying projects | -2.10% | Tigray, Afar, Oromia | Short term (≤ 2 years) |
| Forex shortages and repatriation hurdles | -1.70% | National | Medium term (2–4 years) |
| Source: Mordor Intelligence | |||
High Capital Costs and Limited Domestic Financing
Local banks rarely offer the 15-20 year tenures that utility-scale projects require. Although the July 2024 currency reforms allowed exporters to retain half of their foreign earnings, IPPs still hesitate due to convertibility risk. None of the solar projects awarded under Ethiopia’s inaugural auction has reached financial close, and the USD 100 billion estimated to meet the 37 GW 2037 target will rely heavily on multilateral guarantees.(3)UK Foreign, Commonwealth & Development Office, “Ethiopia Energy Investment Needs,” gov.uk
Transmission Bottlenecks and Curtailment Risk
Wind curtailment could escalate from 0.2% to 9.8% as penetration grows and minimum hydropower releases for irrigation constrain flexibility. The grid recorded 49 major blackouts between 2013 and 2024, underscoring the urgency of smart-grid upgrades and dynamic line ratings. Pumped-hydro storage, despite its high technical potential, remains absent from the current energy policy framework.
*Our forecasts treat driver/restraint impacts as directional, not additive. The impact forecasts reflect baseline growth, mix effects, and variable interactions.
Segment Analysis
By Technology: Hydropower Anchors, Solar Surges
Hydropower supplied 89.35% of the generation capacity in 2025, underpinned by GERD's 2,350 MW already online and Koysha's 2,160 MW, slated for commissioning in 2026. That dominance means hydro contributes the largest slice of Ethiopia's renewable energy market share at present, but its share will gradually decline as new solar gigawatt-scale projecSolar'sconnected. Solar's 87.60% CAGR from 2026 to 2031 reflects the February 2025 IPP auction, progressive minTOYO's rules, and TOYO's domestic module line, which reduces capital outlay per MW. Wind, with 404 MW installed, is reviving after AMEA Power signed a 300 MW PPA in 2024, although grid congestion must ease to realize its resource potential. Geothermal is the long-run baseload hedge: Tulu Moye and Corbetti each target 150 MW, and early wells indicate steam temperatures above 280 °C supporting sub-USD 0.07 / kWh tariffs. Bioenergy remains limited to the 25 MW Reppie waste-to-energy plant, while ocean energy is irrelevant for landlocked Ethiopia.
With GERD, hydro's share could still command 58.70% of Ethiopia's renewable energy market size in 2031; yet, solar will account for the steepest absolute increase in wind capacity. Wind's competitiveness hinges on a timely 400 kV backbone and improved foreign exchange liquidiGeothermal's turbines. Geothermal's drilling-intensive profile implies slower near-term additions but offers critical baseload stability, reducing evening diesel dispatch that runs upwards of USD 0.25 / kWh. The evolving mix underscores an intentional shift toward diversified generation to moderate rainfall variability risk and accommodate rising evening peaks tied to urban lifestyles.


By End-User: Utilities Dominate, C&I Awakens
Utilities commanded 75.05% of the capacity in 2025 and are forecast to grow at a 23.30% CAGR through 2031, as Ethiopian Electric Power continues its single-buyer role. This bloc’s purchasing power anchors nearly all current IPPs, which sign 20- to 25-year PPAs denominated in birr but indexed to forex, a structure exposed during the 115% devaluation in July 2024. Commercial and industrial (C&I) loads, notably data centers and textile exporters, represent approximately 15% of 2024 demand, yet they have limited self-generation due to the absence of net metering and wheeling rights. Once the Ethiopian Investment Commission finalizes guidelines for behind-the-meter solar and storage, the C&I slice could capture a higher share of the Ethiopian renewable energy market in late-decade installations.
Residential users currently make up roughly 10% of capacity; growth is expected to accelerate as ADELE-funded mini-grids bring 500,000 households online by 2027, with productive-use components such as cold storage enhancing tariff affordability. The policy environment has begun to shift toward small-scale private participation, exemplified by Green Scene Energy’s 685 kWp mini-grid cluster, which serves 20,000 rural residents. In all, utilities remain the near-term volume driver, but C&I and rural electrification deployments will diversify demand, reducing concentration risk for future investors in the Ethiopian renewable energy industry.
Geography Analysis
Oromia dominates the generation sector, accounting for 59.40% of the installed capacity, and hosts GERD's cascading turbines and rift-floor geothermal prospects, which together secure the region's leadership in the Ethiopian renewable energy market. Addis Ababa, although grid-supplied from Oromia plants, consumes roughly 40% of the national electricity; data-center clusters alone are set to draw more than 8 TWh in 2025, spurring the need for localized peak management solutions, such as battery-backed solar rooftops. Southern Nations, Nationalities, and Peoples' Region contributes to the Omo-Gibe cascade, adding 2,600 MW of hydro that underpins rural irrigation schemes and emerging agro-processing zones along the Gibe riverbank.
The Tigray-Afar belt hosts the bulk of 404 MW in wind facilities but suffered 18 months of transmission isolation during the 2020-2022 conflict. The restoration of the Alamata-Kombolcha-Legetafo 230 kV loop in 2024 reduced Ashegoda curtailment from 30% to 18%, yet full relief awaits a 400 kV upgrade planned under PRIME Phase II. Gambella, Benishangul-Gumuz, and Somali regions record the lowest electrification levels at 32%, positioning them as target zones for ADELE mini-grids, many of which will be solar-plus-storage hybrids that bypass backlog in transmission spending. The Djibouti and Sudan interconnectors extend geographic relevance beyond Ethiopia's borders, collectively absorbing 350 MW in 2024 exports and forecasted to reach 700 MW by 2027 as more GERD units synchronize.
Progress on the 150 MW Djibouti link has catalyzed desalination projects, while Sudan buys hydroelectric surplus during its dry spell, allowing Ethiopia to time-slice generation and stabilize its domestic grid frequency. Voltage stability remains the Achilles' heel of the northwest Gondar-Metema corridor; the installation of static VAR compensators and a planned synchronous condenser near Bahir Dar are vital to unlocking future wind pipelines there. Collectively, regional contrasts shape deployment priorities, capital allocation, and risk-adjusted returns for investors evaluating entries into the Ethiopian renewable energy market.
Competitive Landscape
A de facto duopoly—Ethiopian Electric Power (generation and transmission) and Ethiopian Electric Utility (retail)—dominates system planning, tariff decisions, and offtake negotiations. Chinese EPC majors PowerChina, Gezhouba, and Dongfang Electric have established themselves through tied financing, which has covered 85% of wind and hydro projects since 2019. Their turnkey model compresses construction schedules but constrains local content growth and technology transfer. European turbine OEMs, such as Siemens Gamesa, Vestas, and GE, have more than 420 MW installed but face shrinking bill liquidity and elevated hedging costs following the 2024 devaluation.
TOYO Corporation’s 2 GW solar-cell factory, inaugurated in April 2025, marks Ethiopia’s first sizable equipment localisation, likely shifting photovoltaic procurement in upcoming IPP rounds towards domestic sourcing, curbing logistics risk, and shaving 20% off delivered module costs. Local IPPs remain nascent, with Green Scene Energy, Solar Tech, and BTE Renewables collectively controlling less than 1 MW of grid-connected capacity. However, they hope to scale through the ADELE and DREAM programs, which aim to carve out uncrowded rural markets. ACWA Power’s 2024 exit from two Scaling Solar sites highlights lingering forex-repatriation risks, although the July 2024 directive FXD/01/2024 now allows offshore escrow accounts for dividend flow, a reform that helped AMEA Power ink a 300 MW wind PPA two months later.
Competitive intensity is expected to rise once the PPP Amendment Proclamation No. 1283/2023 enables direct negotiations for repeat sponsors with at least three successful projects, a provision that favors veterans, such as Mainstream Renewable Power and Globeleq. Native engineering firms are slowly climbing the value chain, handling civil works and balance-of-plant contracts, but still lack balance-sheet heft to self-develop IPPs. Battery storage, green hydrogen, and smart-grid software remain white-space niches, open to new entrants as multilateral lenders move to finance flexibility assets critical for a diversified Ethiopian renewable energy market.
Ethiopia Renewable Energy Industry Leaders
Ethiopian Electric Power (EEP)
PowerChina / China Gezhouba Group
Siemens Gamesa Renewable Energy SA
Tulu Moye Geothermal Operations PLC
Enel Green Power S.p.A.
- *Disclaimer: Major Players sorted in no particular order

Recent Industry Developments
- May 2025: Ethiopia signed USD 1.7 billion in energy and mineral investment deals, including a USD 360 million solar-cell factory from Hanergy.
- April 2025: TOYO Corporation commissioned a 2 GW solar-cell factory in Ethiopia, with output exceeding 80 MW by the end of April 2025 and ramping to 150–200 MW per month, targeting a 4 GW ultimate capacity that positions the facility as Africa's largest photovoltaic manufacturing hub and reduces module import costs by an estimated 20%
- February 2025: Ethiopian Electric Power launched 225 MW utility-scale solar IPP auctions for the Gad and Weransso sites, with prequalification closing in April 2025, representing the first competitive procurement since the termination of ACWA Power's Scaling Solar projects in 2024
- August 2024: AMEA Power signed a power purchase agreement for the 300 MW Aysha-1 wind project, marking the first utility-scale wind PPA since 2021 and signaling renewed developer confidence following the July 2024 forex directive permitting offshore accounts and dividend repatriation


Ethiopia Renewable Energy Market Report Scope
Renewable energy is derived from natural sources that replenish faster than they are consumed, such as sunlight, wind, water, geothermal heat, and biomass. These resources are considered inexhaustible and are used to generate electricity, heat, and fuel, typically resulting in a lower carbon footprint and reduced environmental impact compared to fossil fuels.
The Ethiopian Renewable Energy Market is segmented by technology and end-user. By technology, the market is segmented into Solar Energy (PV and CSP), Wind Energy (Onshore and Offshore), Hydropower (Small, Large, and PSH), Bioenergy, Geothermal, and Ocean Energy (Tidal and Wave). By end user, the market is segmented into Utilities, Commercial and Industrial, and Residential. The report also covers the market size and forecasts for Ethiopia.
For each segment, market sizing and forecasts have been conducted based on installed capacity (GW).
By Technology
| Solar Energy (PV and CSP) |
| Wind Energy (Onshore and Offshore) |
| Hydropower (Small, Large, PSH) |
| Bioenergy |
| Geothermal |
| Ocean Energy (Tidal and Wave) |
By End-User
| Utilities |
| Commercial and Industrial |
| Residential |
| By Technology | Solar Energy (PV and CSP) |
| Wind Energy (Onshore and Offshore) | |
| Hydropower (Small, Large, PSH) | |
| Bioenergy | |
| Geothermal | |
| Ocean Energy (Tidal and Wave) | |
| By End-User | Utilities |
| Commercial and Industrial | |
| Residential |


Key Questions Answered in the Report
What is Ethiopia's installed renewable generation capacity today and where is it headed by 2031?
Capacity stands at 8.64 GW in 2026 and is forecast to reach 22.31 GW by 2031, implying a 20.90% CAGR.
How large is the Grand Ethiopian Renaissance Dam and why is it pivotal?
GERD will deliver 5,150 MW at full build-out, anchoring hydropower dominance and underpinning future electricity exports.
Which technology is expanding the fastest in Ethiopia’s renewable mix?
Utility-scale and mini-grid solar is growing the quickest, projected to post a 87.60% CAGR between 2026 and 2031.
What multilateral funding mechanisms are backing new Ethiopian projects?
The World Bank’s USD 1.4 billion PRIME program, AfDB’s SEFA loans, and Chinese policy-bank tied financing collectively supply most concessional capital.
How does the Ethiopia–Kenya HVDC line improve Ethiopia’s energy outlook?
The 2,000 MW link already moves 400 MW to Kenya and could generate USD 71 million–USD 498 million in annual export revenue as volumes rise.
What key hurdles still impede renewable roll-outs in Ethiopia?
High capital costs, foreign-exchange shortages, and grid bottlenecks—especially in the Gondar-Metema and Tigray corridors—continue to delay or curtail projects.
Page last updated on:


