
ETF Market Size and Share
Market Overview
| Study Period | 2020 - 2031 |
|---|---|
| Market Size (2026) | USD 20.90 Trillion |
| Market Size (2031) | USD 37.70 Trillion |
| Growth Rate (2026 - 2031) | 12.50 % |
| Fastest Growing Market | Asia-Pacific |
| Largest Market | North America |
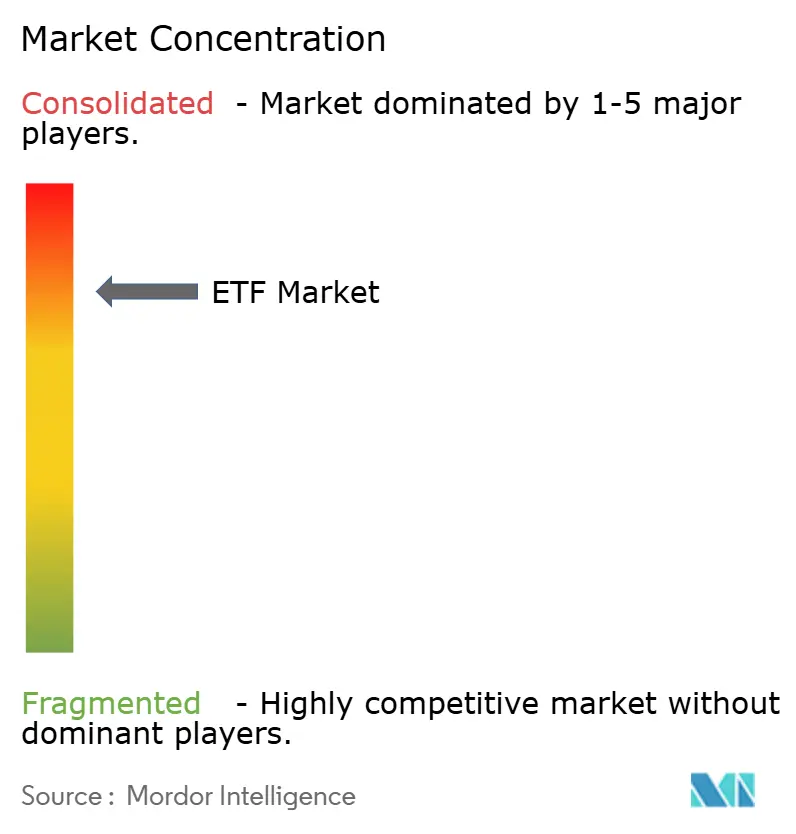
| Market Concentration | High |
Major Players *Disclaimer: Major Players sorted in no particular order Image © Mordor Intelligence. Reuse requires attribution under CC BY 4.0. | |
ETF Market Analysis by Mordor Intelligence
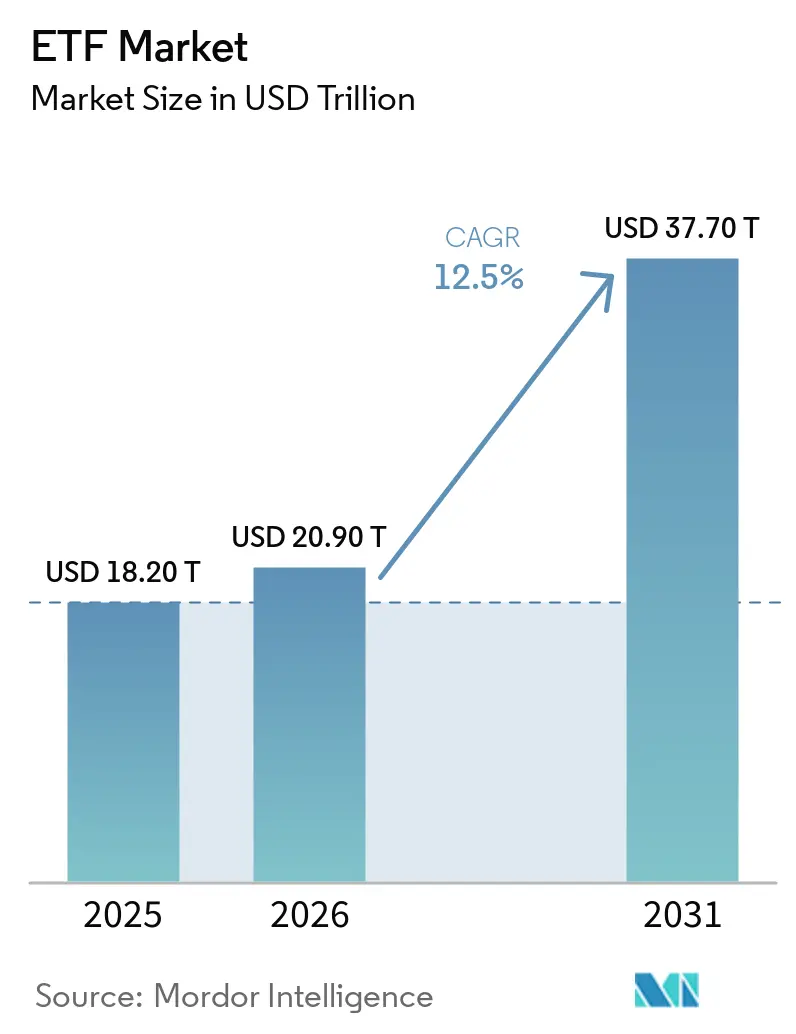
The global ETF market size was valued at USD 18.2 trillion in 2025 and is projected to expand from USD 20.9 trillion in 2026 to USD 37.7 trillion by 2031, registering a CAGR of 12.5% between 2026 and 2031. The exchange-traded structure is increasingly used across retail and institutional portfolios because it combines transparent pricing with intraday trading. Lower costs, easier digital access, and investor preference for liquid instruments continue to support adoption. Fixed income ETFs have added another source of demand because treasury teams and insurers use them for liquidity management. Mutual fund conversions, dual share-class structures, and tokenized ETF pilots could broaden distribution while requiring closer regulatory review. Fee pressure and uneven rules across jurisdictions may limit the ability of smaller issuers to compete.
Key Report Takeaways
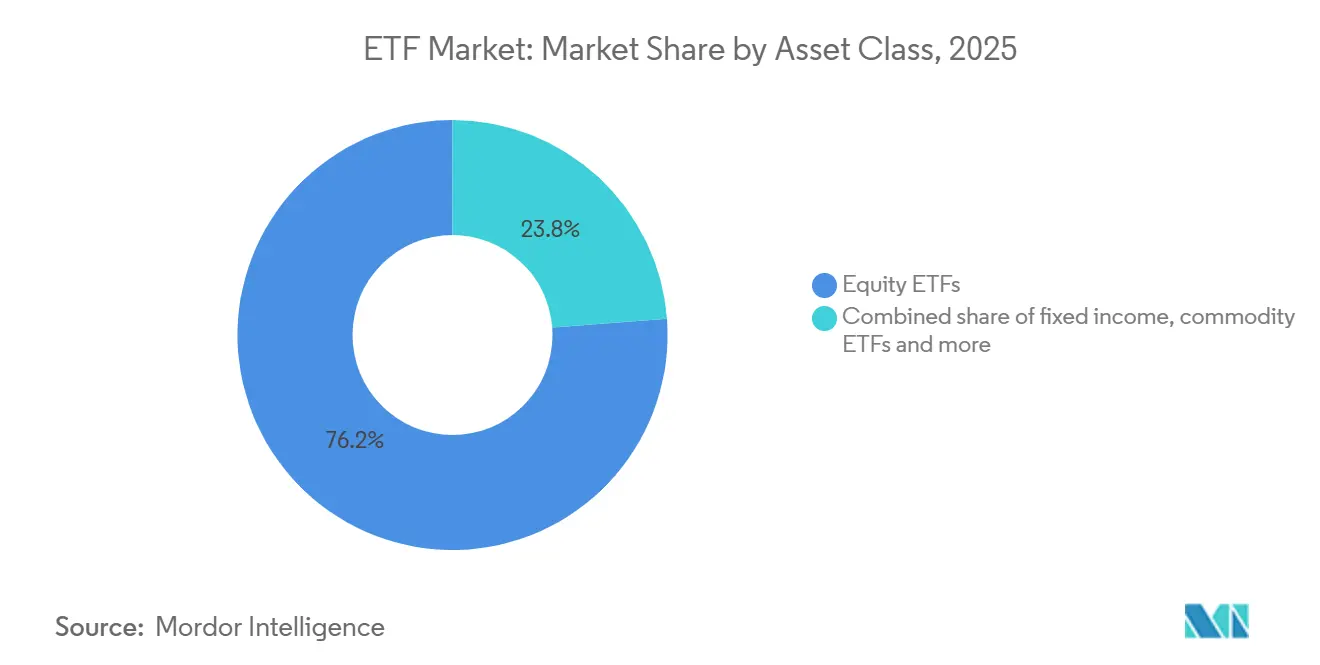
- By asset class, equity ETFs held 76.2% of the global ETF market share in 2025, while digital-asset ETFs are forecast to grow at a 22.5% CAGR through 2031.
- By investment strategy, index and passive products held 90.6% of the global ETF market share in 2025, while active strategies are forecast to grow at a 16.5% CAGR through 2031.
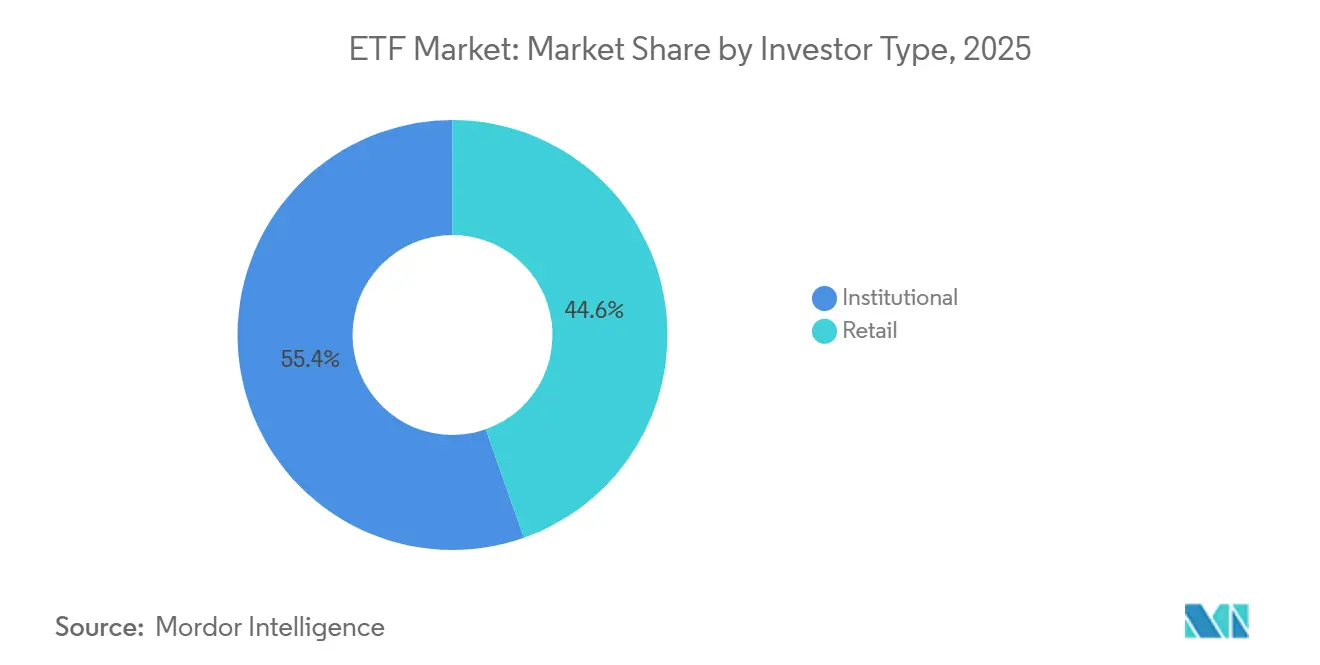
- By investor type, institutional investors held 55.4% of the global ETF market share in 2025, while retail investors are forecast to grow at a 13.7% CAGR through 2031.
- By distribution channel, advised wealth platforms held 36.5% of the global ETF market share in 2025, while workplace and retirement platforms are forecast to grow at a 15.5% CAGR through 2031.
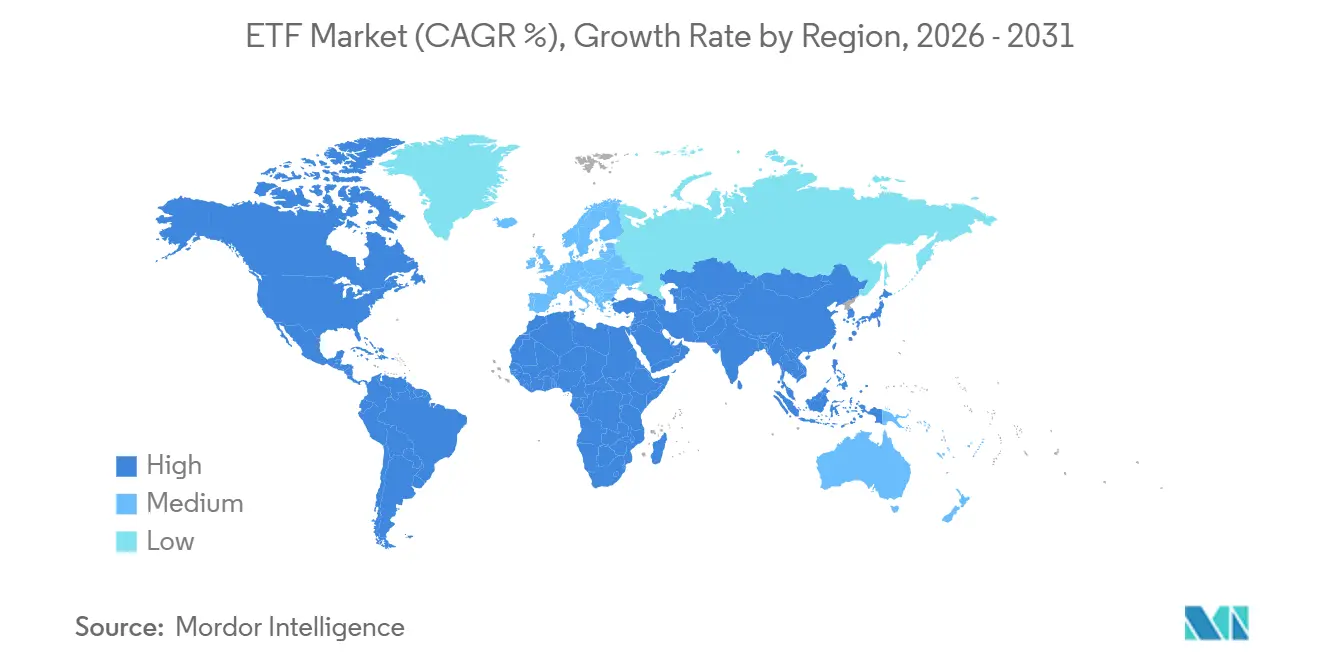
- By geography, North America held 69.4% of the global ETF market share in 2025, while Asia-Pacific is forecast to grow at a 14.5% CAGR through 2031.
Note: Market size and forecast figures in this report are generated using Mordor Intelligence’s proprietary estimation framework, updated with the latest available data and insights as of January 2026.
Global ETF Market Trends and Insights
Drivers Impact Analysis*
| Driver | (~) % Impact on CAGR Forecast | Geographic Relevance | Impact Timeline |
|---|---|---|---|
| Low-Cost, Transparent Exchange-Traded Exposure | +2.0% | Global | Short term (≤ 2 years) |
| Digital Brokerage and Self-Directed Distribution | +1.8% | North America, Europe, APAC | Short term (≤ 2 years) |
| Bond ETFs for Liquidity, Income, and Allocation | +1.5% | North America, Europe | Medium term (2-4 years) |
| Active, Thematic, and Alternative Strategies | +1.7% | North America, Europe, South Korea | Medium term (2-4 years) |
| Savings Plans and Fractional Retail Investing | +1.2% | Continental Europe, APAC | Short term (≤ 2 years) |
| Digital-Asset ETFs and New Asset-Class Access | +2.2% | North America, APAC | Long term (≥ 4 years) |
| Source: Mordor Intelligence | |||
Low-Cost, Transparent Portfolio Exposure Compressing the Mutual Fund Share
The global ETF market benefits when investors can compare fund charges more clearly across similar products. Vanguard cut fees on 84 share classes across 53 funds in February 2026. The program provides USD 250 million in annualized savings after USD 350 million in savings from 2025 changes[1]Vanguard, “Vanguard Delivers Landmark Cost Savings,” Vanguard, corporate.vanguard.com.. The Investment Company Institute reported that index mutual funds and index ETFs represented 52% of long-term fund assets at the end of 2025. Lower fees can bring new investors into the ETF market, but they also reduce revenue per managed dollar. This leaves smaller providers exposed when they lack the scale to support administration, compliance, and distribution.
Digital Brokerage Platforms Structurally Repositioning Retail Distribution
Digital brokerage platforms have made self-directed ETF investing easier for smaller investors across several regions. European ETF savings plans reached 15.1 million monthly plans in 2025, while annual savings-plan volume reached USD 26.7 billion (EUR 22.7 billion)[2]J.P. Morgan Asset Management, “UCITS ETFs Mid-Year 2026 Update: Wider Participation, Growing Demand for Active Strategies,” J.P. Morgan Asset Management, am.jpmorgan.com.. Scheduled contributions can reduce dependence on occasional lump-sum purchases and make fund flows more consistent. Fractional investing further lowers entry barriers for investors who cannot purchase a full ETF share. European cost-disclosure rules have made fund charges more visible at the point of sale. Those conditions support recurring retail demand for the global ETF market across savings, retirement, and general investment accounts.
Bond ETFs Becoming Portfolio Infrastructure Rather Than a Tactical Overlay
Bond ETFs are becoming more important for liquidity, income, and portfolio allocation within the global ETF market. United States bond ETFs gathered USD 407 billion in inflows through August 2026. Short-term government bond ETFs received USD 82 billion during the same period as investors sought yield and shorter duration[3]State Street Global Advisors, “ETF Inflows Set Records in First Half,” State Street Global Advisors, ssga.com.. Institutions can use these products to gain diversified exposure while retaining the ability to trade throughout the day. ETFs also provide visible prices for bond exposures that may otherwise trade in fragmented cash markets. This operational role can make bond ETF allocations harder to replace once they are incorporated into liquidity processes.
Proliferation of Active, Thematic and Alternative ETF Strategies
Active, thematic, and alternative offerings are widening the product range available through the global ETF market. Active ETF assets reached USD 2.59 trillion globally by July 2026, with USD 590 billion in year-to-date net inflows. In the United States, active strategies captured 33% to 38% of first-half flows despite holding 12.5% of ETF assets. Product conversions from mutual funds also brought existing active strategies into the ETF wrapper. More than 60 funds converted across 31 firms in 2025, with converted assets exceeding USD 260 billion. Supervisory expectations for active and semi-transparent products remain important for issuers expanding their lineups.
Restraints Impact Analysis*
| Restraint | (~) % Impact on CAGR Forecast | Geographic Relevance | Impact Timeline |
|---|---|---|---|
| Fee Compression and Scale Pressure in Commodity Products | -0.8% | Global, most acute in North America | Long term (≥ 4 years) |
| Underlying-Asset Liquidity and Replication Challenges | -0.6% | Global commodity, alternative, and niche asset-class ETFs | Medium term (2-4 years) |
| Limited Authorized-Participant and Market-Maker Capacity | -0.5% | North America and Europe for illiquid-underlying ETFs | Short term (≤ 2 years) |
| Cross-Border Regulatory, Tax, Listing, and Settlement Fragmentation | -0.7% | EU, APAC excluding Japan, MEA | Long term (≥ 4 years) |
| Source: Mordor Intelligence | |||
Fee Compression Eroding Smaller Sponsor Economics in Commoditized Categories
Fee compression can support investor adoption while weakening the economics of smaller global ETF market providers. The average expense ratio for index equity ETFs was 0.14% in 2025. The average expense ratio for index bond ETFs fell to 0.09% during the same year. Commodity products face added costs from storage, insurance, and contract rolls, which can affect net returns. Limited authorized-participant and market-maker capacity can also make pricing and creation activity harder for niche funds. These pressures can encourage consolidation among sponsors that focus on smaller or specialized categories.
Cross-Border Regulatory Fragmentation Structurally Elevating Distribution Costs
The global ETF market remains divided by national rules covering registration, listing, tax, disclosure, and settlement. UCITS, MiFID II, and SFDR require European products to meet a specific regulatory architecture. Japan, China, Australia, and India also apply separate requirements for product registration and cross-border distribution. ETF Connect between Hong Kong and mainland China provides access but continues to limit eligible products and investors. Different settlement conventions can create friction for market participants that support arbitrage across jurisdictions. These requirements raise legal and compliance costs and can slow new fund launches in Asia-Pacific, Europe, and the Middle East and Africa.
*Our forecasts treat driver/restraint impacts as directional, not additive. The impact forecasts reflect baseline growth, mix effects, and variable interactions.
Segment Analysis
By Asset Class: Equity Scale and Digital-Asset Growth
Equity ETFs held 76.2% of the global ETF market share in 2025, supported by established index benchmarks and broad distribution. Broad-market and large-cap products continue to draw demand because they serve as core portfolio holdings. Vanguard's VOO became the first ETF to surpass USD 1 trillion in assets under management in 2026. Fixed income ETFs form the second-largest asset class and continue to gain relevance in institutional portfolios. United States fixed income ETF assets reached USD 2.59 trillion by July 2026. Commodity ETFs received focused interest in gold and silver exposure, particularly in India. Currency, multi-asset, and money-market products support hedging, allocation, and cash-management needs. Alternative ETFs also offer defined-outcome, derivative-income, and hedging strategies for investors with more specific objectives.
Digital-asset ETFs are forecast to grow at a 22.5% CAGR through 2031, the strongest rate among asset classes in the global ETF market. Generic listing standards have expanded product availability in the global ETF market, although they require continued regulatory review. United States spot Bitcoin ETFs received more than USD 42 billion in net inflows during 2025. BlackRock's IBIT represented 62% of USD 101.3 billion in United States Bitcoin ETF assets in early September 2026. Digital-asset growth therefore depends on both product availability and sustained confidence in underlying trading markets. Their faster growth rate does not change the scale advantage held by equity products.



By Investment Strategy: Passive Scale and Active Momentum
Index and passive products held 90.6% of the global ETF market assets in 2025, reflecting their low costs and role in portfolio construction. These funds usually track recognized benchmarks and allow investors to implement diversified allocations efficiently. The Investment Company Institute reported that index mutual funds and index ETFs represented 52% of long-term fund assets at the end of 2025. Passive ETFs retain the largest asset base because advisors, institutions, and retail investors can use them as straightforward building blocks. Their scale also supports lower fund expenses in highly competitive categories. This makes broad passive products difficult for smaller issuers to challenge on price alone. The ETF structure is therefore reinforcing the position of established benchmark-linked funds. Passive scale remains central to the global ETF market even as newer strategies attract more flows.
Active ETFs are forecast to grow at a 16.5% CAGR through 2031 and are taking a larger share of net new flows. In the United States, active ETF assets grew more than 65% year over year in the first half of 2026. The 5-year CAGR for active ETF assets was 45%, compared with 17% for passive ETF assets within the global ETF market. SEC Rule 6c-11 enabled launches of active products that do not need to disclose holdings daily. Active mutual funds lost USD 572 billion in 2025 while active ETFs attracted USD 470 billion. Semi-transparent funds and mutual fund conversions remain smaller in absolute assets but are expanding quickly. Active fixed income products are also drawing investors seeking differentiated bond management. This pattern leaves passive products dominant by assets while active strategies provide a larger share of product innovation.
By Investor Type: Institutional Base and Retail Growth
Institutional investors held 55.4% of the global ETF market assets in 2025, providing a stable base through pensions, insurers, treasury operations, and hedge funds. Institutions use ETFs for core equity exposure, tactical positioning, and fixed income liquidity. Corporate bond ETF flows reached their second-highest monthly level in 2025. Short-to-intermediate maturity products held 55% of that corporate bond ETF capital. Large institutional counterparties also support the creation and redemption process that helps ETF prices remain close to net asset value. This role makes the institutional base important to the operation of the global ETF market. It also supports liquidity across major equity and fixed income categories. Institutional adoption has widened as bond ETFs moved beyond a tactical portfolio role.
Retail investors held 44.6% of global assets in 2025 and are forecast to grow at a 13.7% CAGR through 2031. Commission-free trading, fractional shares, and automated savings plans are making ETF access simpler for smaller accounts. Europe is important because retail ETF participation there remains less mature than in the United States. Monthly ETF savings plans in continental Europe reached 15.1 million in 2025. Germany was the largest single market for these plans in the source material. India's passive fund assets grew at a 5-year CAGR of 34.7% through March 2026. The PRIIPS Key Information Document supports standardized product information for retail buyers across the global ETF market. Continued retail growth depends on clear disclosures, practical digital tools, and sustained investor confidence.
By Distribution Channel: Advised Wealth Leadership and Retirement Expansion
Advised wealth platforms held 36.5% of global ETF distribution assets in 2025, giving them the largest channel position. Advisors commonly use ETF model portfolios to construct diversified allocations for clients. This process can create recurring flows when portfolios are rebalanced against agreed investment objectives. Merrill Lynch, Raymond James, and European private banks were identified in the source material as examples of model-portfolio users. Advised platforms also help investors select among a growing number of asset classes and strategies. Their role is especially important when active, fixed income, or outcome-oriented products need explanation. The channel therefore combines ETF access with professional portfolio implementation. It remains a principal distribution route within the global ETF market.
Workplace and retirement platforms are forecast to grow at a 15.5% CAGR through 2031, supported by their link to long-term savings. United StatesA retirement assets reached USD 49.1 trillion at the end of 2025, including USD 14.2 trillion in employer-based defined contribution plans. Target-date fund assets reached USD 4.8 trillion in 2025. Dual share-class structures could allow mutual fund and ETF access through the same pool of assets. This could reduce operational barriers that have limited ETF use in 401(k) lineups. Self-directed platforms support retail access through low-cost trading, fractional shares, automated rebalancing, and goal-based savings tools. Institutional direct distribution remains important for large investors that use creation and redemption mechanisms directly.
Geography Analysis
North America held 69.4% of the global ETF market share in 2025 and remained the largest source of product development and flows. United States ETF flows exceeded USD 1 trillion during the first half of 2026. The region benefits from a broad exchange network and established authorized participants. Generic listing standards also support a faster product review process for eligible products. Canada has a mature domestic ETF environment, while Mexico remains smaller and earlier in development. North American scale continues to give leading issuers a substantial distribution advantage.
Europe was the second-largest region, with ETF assets reaching USD 3.97 trillion at the end of August 2026. The region recorded 47 consecutive months of net inflows by that date. UCITS ETF flows exceeded USD 245 billion in the first half of 2026, up 51% from the same period in 2025. Savings plans, fractional investing, and MiFID II cost transparency support retail participation. SFDR-related demand gives Europe a distinct role in ESG-focused ETF development. Separate regulatory requirements continue to shape product design and cross-border distribution.
Asia-Pacific is forecast to grow at a 14.5% CAGR through 2031, making it the fastest-growing major region in the global ETF market. Indo-Pacific ETF assets reached USD 2.7 trillion in the first half of 2026. Japan held USD 845 billion and retained the largest single-country position by the first half of 2026. South Korea received USD 56.4 billion in first-half inflows, while Taiwan received USD 33.4 billion[4]London Stock Exchange Group, “Indo-Pacific ETF Industry Review: H1 2026,” Lipper Alpha Insight, lipperalpha.refinitiv.com.. India reached USD 168 billion (INR 14.11 lakh crore) in passive fund assets by March 2026. MEA and South America remain smaller, with domestic ETF infrastructure developing in Saudi Arabia, the UAE, South Africa, and Brazil. Fragmented registration and settlement rules remain an obstacle to wider regional integration.

Competitive Landscape
The global ETF market is concentrated, although specialist issuers are taking a larger share of new flows. BlackRock iShares, Vanguard, and State Street SPDR held 59% of global ETF assets in July 2026. It also reported 1,025 providers operating across 85 exchanges in 66 countries. Large providers retain advantages in brand recognition, operating scale, market-making relationships, and distribution. Smaller managers compete through active, thematic, digital-asset, defined-outcome, and derivative-income products.
Goldman Sachs completed its acquisition of Innovator Capital Management in April 2026. It then agreed to acquire NEOS Investments for up to USD 2.25 billion in August 2026. These moves expand its exposure to defined-outcome and options-based income strategies. Vanguard, Wellington Management, and Blackstone launched 2 investment solutions in July 2026. The collaboration combines public and private market access for eligible advisory-channel investors. Such initiatives show how providers are widening product delivery beyond traditional index exposure.
Active fixed income is a notable opportunity because it received 38% of fixed income ETF flows while holding 23% of fixed income ETF assets. Tokenization and fractional shares may also change how investors access ETF exposures. Franklin Templeton and Ondo Finance tokenized 5 ETFs on Solana in March 2026. New global ETF launches reached 2,141 through July 2026. The pace of launches increases competition for profitable specialist categories. Issuers with custody capabilities, retirement plan relationships, regulatory resources, and reliable trading support may be better positioned in these areas. Established firms still have strong advantages, but specific product expertise can attract flows at smaller asset bases.
ETF Industry Leaders
BlackRock, Inc. (iShares)
The Vanguard Group, Inc.
State Street Corporation (SPDR ETFs)
Invesco Ltd.
Charles Schwab Investment Management, Inc.
- *Disclaimer: Major Players sorted in no particular order

Recent Industry Developments
- August 2026: Goldman Sachs agreed to acquire NEOS Investments, a provider of 19 options-based income ETFs managing USD 30 billion in assets, for up to USD 2.25 billion in cash and equity. The combined Goldman Sachs Asset Management ETF platform will reach USD 130 billion in AUM and rank as the eighth-largest active ETF manager globally per Morningstar.
- July 2026: Wellington Management, Vanguard, and Blackstone launched 2 new investment solutions designed to provide eligible investors access to combined public and private market portfolios, with initial availability through Merrill Lynch and Bank of America Private Bank platforms.
- July 2026: J.P. Morgan Asset Management launched the JPMorgan United States Large Cap Value Plus ETF (JLVP) on Nasdaq. It was the firm's first actively managed extension strategy in an ETF wrapper.
- April 2026: Goldman Sachs completed the acquisition of Innovator Capital Management. Innovator managed USD 31 billion across 171 ETFs, and the transaction gave Goldman Sachs Asset Management USD 90 billion in ETF assets across 240 ETFs globally.


Global ETF Market Report Scope
The global ETF market comprises investment funds listed and traded on stock exchanges that pool investors’ money to provide diversified exposure to assets such as equities, bonds, commodities, currencies, and thematic or alternative investments. ETFs typically track an underlying index or investment strategy and offer investors liquidity, diversification, transparency, and relatively low costs, making them widely used by both retail and institutional investors for portfolio allocation, hedging, and long-term investment.
The Global ETF Market is Segmented by Asset Class (Equity, Fixed Income, Commodity, Currency, Multi-Asset, and More), Investment Strategy (Active, Index/Passive), Investor Type (Retail, Institutional), Distribution Channel (Self-directed, Advised Wealth, Workplace/Retirement, Institutional Direct), and Geography (North America, South America, Europe, Asia-Pacific, Middle East and Africa). The Market Forecasts are Provided in Terms of Value (USD).
| Equity ETFs |
| Fixed Income ETFs |
| Commodity ETFs |
| Currency ETFs |
| Multi-Asset / Hybrid ETFs |
| Digital-Asset ETFs |
| Money-Market / Cash ETFs |
| Alternative and Other ETFs |
| Active |
| Index / Passive |
| Retail |
| Institutional |
| Self-directed Brokerage and Digital Platforms |
| Advised Wealth |
| Workplace / Retirement Platforms |
| Institutional Direct |
| North America | United States |
| Canada | |
| Mexico | |
| South America | Brazil |
| Argentina | |
| Rest of South America | |
| Europe | United Kingdom |
| Germany | |
| France | |
| Italy | |
| Spain | |
| Rest of Europe | |
| Asia-Pacific | China |
| Japan | |
| India | |
| South Korea | |
| Australia | |
| Indonesia | |
| Thailand | |
| Malaysia | |
| Singapore | |
| Vietnam | |
| Rest of Asia-Pacific | |
| Middle East and Africa | Saudi Arabia |
| United Arab Emirates | |
| Turkey | |
| South Africa | |
| Egypt | |
| Rest of Middle East and Africa |
| By Asset Class | Equity ETFs | |
| Fixed Income ETFs | ||
| Commodity ETFs | ||
| Currency ETFs | ||
| Multi-Asset / Hybrid ETFs | ||
| Digital-Asset ETFs | ||
| Money-Market / Cash ETFs | ||
| Alternative and Other ETFs | ||
| By Investment Strategy | Active | |
| Index / Passive | ||
| By Investor Type | Retail | |
| Institutional | ||
| By Distribution Channel | Self-directed Brokerage and Digital Platforms | |
| Advised Wealth | ||
| Workplace / Retirement Platforms | ||
| Institutional Direct | ||
| By Geography | North America | United States |
| Canada | ||
| Mexico | ||
| South America | Brazil | |
| Argentina | ||
| Rest of South America | ||
| Europe | United Kingdom | |
| Germany | ||
| France | ||
| Italy | ||
| Spain | ||
| Rest of Europe | ||
| Asia-Pacific | China | |
| Japan | ||
| India | ||
| South Korea | ||
| Australia | ||
| Indonesia | ||
| Thailand | ||
| Malaysia | ||
| Singapore | ||
| Vietnam | ||
| Rest of Asia-Pacific | ||
| Middle East and Africa | Saudi Arabia | |
| United Arab Emirates | ||
| Turkey | ||
| South Africa | ||
| Egypt | ||
| Rest of Middle East and Africa | ||


Key Questions Answered in the Report
What is the projected value of the global ETF market by 2031?
The global ETF market is projected to reach USD 37.7 trillion by 2031 after growing at a 12.5% CAGR from 2026. Lower costs, digital distribution, and liquidity needs support this expansion.
Which ETF asset class is growing fastest?
Digital-asset ETFs are forecast to grow at a 22.5% CAGR through 2031. Their progress depends on product listings, trading liquidity, investor safeguards, and continuing regulatory acceptance.
Why are active ETFs gaining investor interest?
Active strategies are forecast to grow at a 16.5% CAGR as investors move selected active mandates into ETF wrappers. Product conversions and stronger active fixed income flows also support this shift.
Which region is expected to grow fastest for ETF adoption?
Asia-Pacific is forecast to grow at a 14.5% CAGR through 2031. Japan, South Korea, Taiwan, and India provide important sources of regional asset growth and investor participation.
What is driving retail use of exchange-traded funds?
Commission-free trading, fractional shares, regular savings plans, and digital portfolio tools are increasing retail access. These features can turn occasional purchases into recurring contributions over time.
Which ETF distribution channel is growing most quickly?
Workplace and retirement platforms are forecast to grow at a 15.5% CAGR through 2031. Their connection with employer plans and long-term savings gives issuers a larger potential distribution base.
Page last updated on:


 Your data is secure and never sold or shared.


