
Engineering Insurance Market Size and Share
Market Overview
| Study Period | 2020 - 2031 |
|---|---|
| Market Size (2026) | USD 31.90 Billion |
| Market Size (2031) | USD 41.20 Billion |
| Growth Rate (2026 - 2031) | 5.20 % |
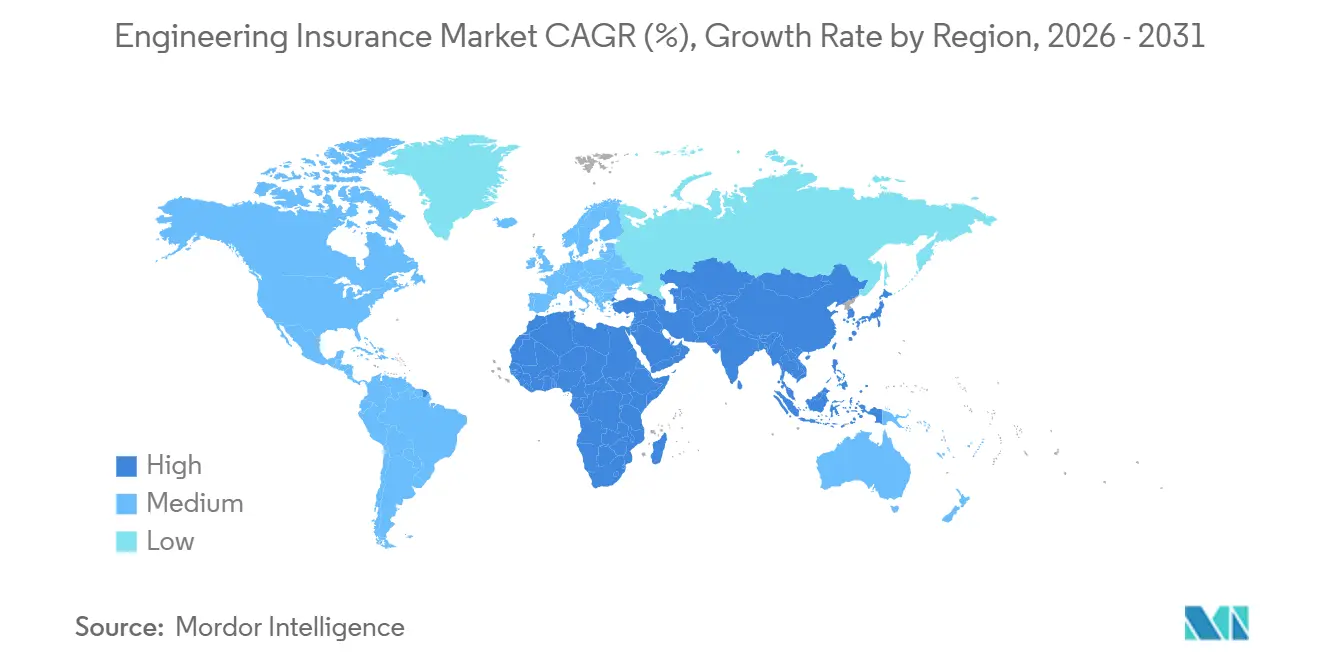
| Fastest Growing Market | Asia-Pacific |
| Largest Market | Europe |
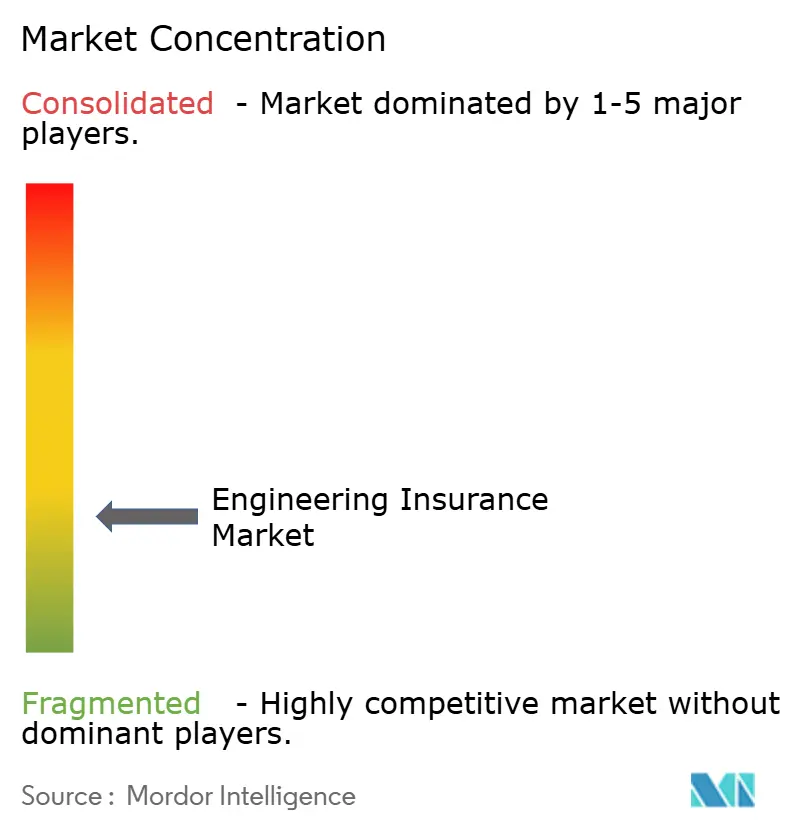
| Market Concentration | Low |
Major Players *Disclaimer: Major Players sorted in no particular order Image © Mordor Intelligence. Reuse requires attribution under CC BY 4.0. | |
Engineering Insurance Market Analysis by Mordor Intelligence
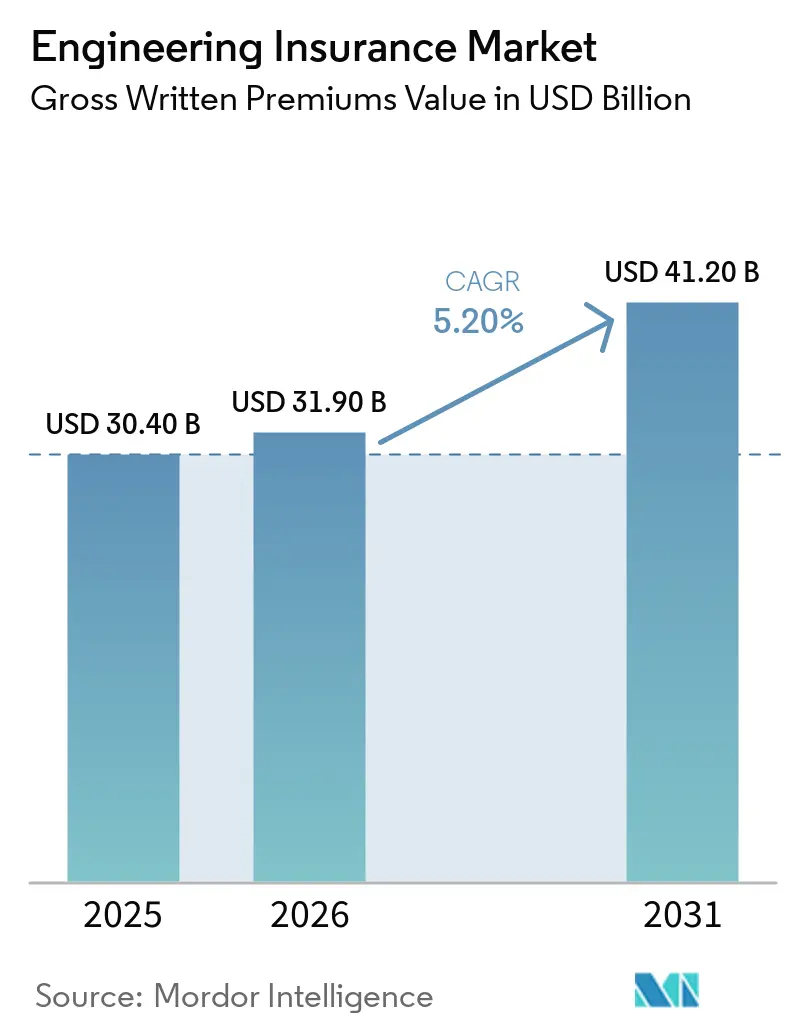
The engineering insurance market size is projected to expand from USD 30.4 billion in 2025 and USD 31.9 billion in 2026 to USD 41.2 billion by 2031, registering a CAGR of 5.2% between 2026 and 2031. Infrastructure investment is increasing demand for cover across transport, power, industrial facilities, and digital assets. Large projects carry higher insured values, which raises the need for technical underwriting and risk engineering. Private capital is also moving into energy-transition and digital infrastructure projects, which places insurance requirements earlier in project planning. Standard construction risks face broader capacity and softer conditions, while complex risks retain firmer pricing because fewer carriers can lead them. Data centers, tunneling projects, and floating offshore wind facilities are therefore important areas for specialist capacity and product development.
Key Report Takeaways
- By product type, Operational and Completed-Asset Insurance captured 45.3% of the engineering insurance market share in 2025, while Project Works Insurance is projected to grow at a 6.2% CAGR through 2031.
- By application, Buildings captured 30.7% of the engineering insurance market share in 2025, while Digital Infrastructure is projected to grow at a 10.2% CAGR through 2031.
- By end user, Contractors and EPC/OEM Erectors captured 33.5% of the engineering insurance market share in 2025, while Private Principals, Developers, and Project SPVs are projected to grow at a 6.7% CAGR through 2031.
- By distribution channel, Brokers captured 60.8% of the engineering insurance market share in 2025, while Direct distribution is projected to grow at a 7.4% CAGR through 2031.
- By geography, Europe captured 40.7% of the engineering insurance market share in 2025, while Asia-Pacific is projected to grow at a 7.7% CAGR through 2031.
Note: Market size and forecast figures in this report are generated using Mordor Intelligence’s proprietary estimation framework, updated with the latest available data and insights as of January 2026.
Global Engineering Insurance Market Trends and Insights
Drivers Impact Analysis*
| Driver | (~) % Impact on CAGR Forecast | Geographic Relevance | |
|---|---|---|---|
| Complex Engineering and Construction Projects | +1.2% | Global, concentrated in Asia-Pacific, North America, and the Middle East | Medium term (2-4 years) |
| Machinery and Equipment Replacement Values | +0.7% | Global, with the highest asset-value escalation in North America and Europe | Medium term (2-4 years) |
| Project Contractual and Financing Compliance Requirements | +0.8% | Global, with strong enforcement in Europe, North America, and Asia-Pacific project-finance markets | Short term (≤ 2 years) |
| High-Value Energy, Power, and Industrial Assets | +0.7% | Asia-Pacific, with spillover to the Middle East, Africa, and Latin America | Long term (≥ 4 years) |
| Digital and Mission-Critical Infrastructure Concentration | +1.3% | North America and Europe, with rapid growth in Asia-Pacific | Medium term (2-4 years) |
| Risk-Management and Condition-Monitoring Technology | +0.5% | Global, with faster adoption in North America and Northern Europe | Long term (≥ 4 years) |
| Source: Mordor Intelligence | |||
Expansion of Complex Engineering and Construction Projects
The engineering insurance market benefits as transport, power, and digital projects become larger and more complex. Large public and private investment programs are supporting transport, power, and digital asset construction. Complex projects often involve cross-border supply chains, modular assembly, and multiple specialist subcontractors. These structures increase the potential severity of delay and defect claims when one part of the work does not perform as planned. Larger project values also require carriers to coordinate capacity and apply a more detailed technical review. This creates demand for insurers that can assess construction risks before the policy is issued.
Increasing Concentration of High-Value Digital and Mission-Critical Infrastructure
Digital infrastructure is changing the risk profile of the engineering insurance market because individual projects now carry very high values. Hyperscaler capital spending is expected to exceed USD 600 billion in 2026, with 75% tied to physical artificial intelligence data center infrastructure[1]https://www.swissre.com/institute/research/sigma-research/sigma-insights-07-2026-insuring-ai-data-centre-risks.html. Individual artificial intelligence campuses can have unusually large construction and equipment values, which creates material accumulation exposure. Comprehensive engineering insurance is increasingly required in financing documents for large-scale data center projects[2]https://commercial.allianz.com/news-and-insights/reports/data-center-construction-risks.html. The concentration of value increases the importance of accumulation controls, power-density assessment, and fire protection requirements. These needs favor underwriters who combine technical engineering support with project-specific coverage design.
Growing Insurance Requirements for Project Contractual and Financing Compliance
Contractual and financing requirements make engineering cover a necessary project cost rather than a discretionary purchase. The United States Bipartisan Infrastructure Law directs USD 550 billion in new spending through 2026, and public construction contracts carry minimum insurance obligations that extend through subcontractor chains. Project financiers and export credit agencies increasingly specify insurance conditions in loan covenants and EPC contracts. Contractors must show that policy limits, deductibles, and insurers meet the stated requirements before work can proceed. In emerging economies, financing conditions linked to international safety standards formalize insurance arrangements that had previously relied on retained risk. The engineering insurance market, therefore, gains demand from compliance obligations as well as from project construction activity.
Adoption of Engineering Risk-Management and Condition-Monitoring Technologies
Risk-management technology supports a more detailed assessment of assets in the engineering insurance market. IoT sensors, artificial intelligence underwriting, satellite imaging, and parametric triggers can provide earlier warning of physical risks. Munich Re's construction weather solutions use condition-trigger data to provide structured payments for delay costs that standard builders' risk policies may not address. Real-time data can also help contractors demonstrate risk controls during construction. Better evidence on site conditions may support more appropriate terms for contractors with stronger risk practices. The wider use of these tools depends on insurers maintaining governance over data quality, pricing, and policy decisions.
Restraints Impact Analysis*
| Restraint | (~) % Impact on CAGR Forecast | Geographic Relevance | Impact Timeline |
|---|---|---|---|
| High Premiums, Deductibles, and Retentions | -0.8% | Global, with sharp pressure in North America and Asia-Pacific natural catastrophe zones | Short term (≤ 2 years) |
| Limited Loss Data for Emerging Technologies | -0.5% | Global, concentrated in digital infrastructure, floating offshore wind, and battery storage | Long term (≥ 4 years) |
| Mega-Project Loss Severity and Accumulation Exposure | -0.5% | Global, with greater exposure in the Gulf Coast, Asia-Pacific seismic zones, and European wind corridors | Medium term (2-4 years) |
| Specialized Technical Underwriting Skills Shortage | -0.4% | Global, especially in Lloyd's and specialty underwriting hubs | Medium term (2-4 years) |
| Source: Mordor Intelligence | |||
High Premiums, Deductibles, and Retentions for High-Risk Engineering Projects
High premiums and larger deductibles can limit uptake within the engineering insurance market, particularly among mid-sized contractors. Contractors faced higher premiums, stricter terms, and greater underwriting scrutiny in 2026, increasing budget pressure across project types. Construction umbrella and excess rates rose 5% to 30% in 2026 as social inflation and large verdicts affected North American capacity. Higher retentions can cause firms to keep more loss exposure on their balance sheets. This can reduce premiums written in the commercial market even when total project activity is rising. Coverage design must therefore balance the cost of insurance with protection against severe property damage and delay losses.
Limited Historical Loss Data for Emerging Engineering Technologies
Limited loss data slows capacity deployment for new technologies within the engineering insurance market. Artificial intelligence data centers, floating offshore wind, battery energy storage, and green hydrogen projects have limited operating histories at commercial scale. Next-generation data center loss assumptions often draw on earlier facilities with lower density and different equipment configurations. AXIS Capital found that larger turbines and deeper-water construction created new design and logistics risks in offshore wind claims data through September 2025[3]https://investor.axiscapital.com/investors/press-releases/news-details/2026/AXIS-Offshore-Wind-Report-Highlights-Technical-Risks-and-Evolving-Challenges-2026-yWZF4CzKrj/default.aspx. Insurers may respond with higher risk charges, lower limits, or more restrictive terms when evidence is limited. The same gap creates an opening for carriers that build credible engineering data and specialist underwriting capability.
*Our forecasts treat driver/restraint impacts as directional, not additive. The impact forecasts reflect baseline growth, mix effects, and variable interactions.
Segment Analysis
By Product Type: Operational Assets Anchor Revenue While Project Works Accelerates
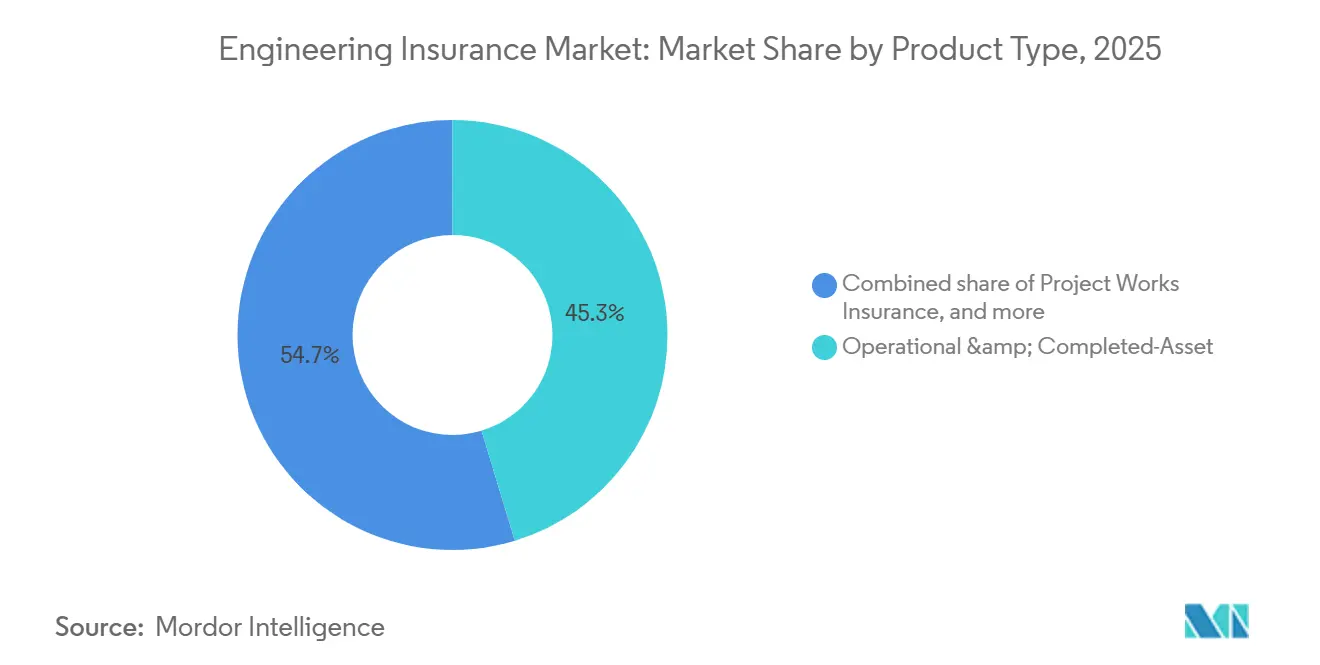
Operational and Completed-Asset Insurance held 45.3% of the premium in 2025. Its position reflects the broad installed base of industrial plants, power stations, and transport networks that need recurring protection. Operational cover supports a stable premium because the exposure remains after construction activity ends. Contractors' Plant and Machinery Insurance adds cover for equipment fleets used across multiple sites. Rising replacement values make this equipment exposure more important to contractors and insurers.
Project Works Insurance is projected to expand at a 6.2% CAGR through 2031. Greenfield data centers, offshore wind facilities, and transport construction support this growth. Delay-in-Start-Up indemnity has risen to USD 500,000 per day on major projects, while extreme claims have reached USD 2 billion. Lenders commonly require delay cover and third-party liability protection in financing documents. Zurich's Global Specialty construction premiums increased 18% in the first half of 2026 as data center and artificial intelligence infrastructure demand rose. Lifecycle arrangements that connect construction and operational cover can help carriers retain clients as projects move into service.


By Application: Buildings Lead as Digital Infrastructure Defines the Growth Narrative
Buildings accounted for 30.7% of the engineering insurance market size in 2025. Commercial and residential construction provided consistent demand for project and equipment cover. Civil and transport infrastructure remained a major application because public programs support long-lived assets. Energy, water, and waste utilities also require tailored protection for solar, wind, battery storage, and hydrogen facilities. Industrial and process manufacturing adds recurring exposure from machinery breakdown at petrochemical, pharmaceutical, and advanced manufacturing sites.
Digital Infrastructure is projected to grow at a 10.2% CAGR through 2031. Data center construction introduces power, cooling, battery, and equipment risks that differ from traditional commercial buildings. Data center insurance premiums are forecast to rise from USD 10.6 billion to USD 24.2 billion by 2030. Updated fire-resistance and sprinkler guidance reflects the growing focus on battery-related incidents. Aon expanded its Data Center Lifecycle Insurance Program to USD 5 billion in July 2026, combining placement with engineering and risk intelligence through development and operations. The application is strengthening demand for early underwriter involvement and coordinated capacity.
By End User: EPC Contractors Anchor Demand While SPVs Drive the Next Growth Wave
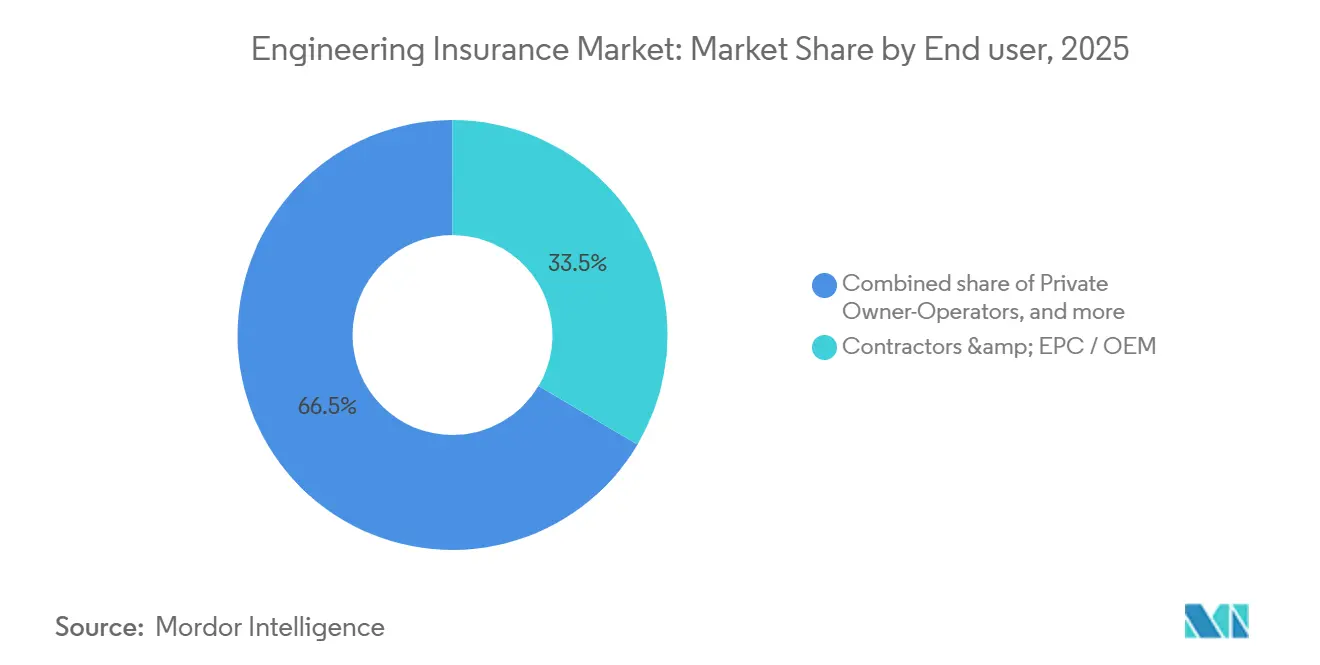
Contractors and EPC/OEM Erectors held 33.5% of end-user demand in 2025. Contractual obligations create consistent insurance demand across power, chemical, transportation, and building projects. EPC contractors on fixed-price contracts use cover to manage losses from equipment damage and project delays. Government entities and statutory boards provide a stable demand because public assets require ongoing protection after construction. Private owner-operators add demand from operating industrial and utility portfolios.
Private Principals, Developers, and Project SPVs are projected to grow at a 6.7% CAGR through 2031. Renewable energy, digital infrastructure, and real estate projects increasingly use project-level financing vehicles. Private capital is moving into project structures that concentrate insurance responsibilities at the special-purpose vehicle level. Insurance requirements placed on SPVs also extend risk-management expectations through the EPC supply chain. Subcontractors may need to meet program requirements to remain eligible for the work. This expands the insured population linked to a single financed project.
By Distribution Channel: Brokers Dominate While Direct Models Scale
Brokers held 60.8% of premium placement in 2025. Their role reflects the layered and cross-border nature of many engineering programs. Specialist brokers help clients access international capacity, structure policy layers, and manage claims. Marsh, Aon, and WTW have expanded their role from placement into risk-engineering support. WTW's Digital Infrastructure Protector provides more than USD 3 billion in integrated lifecycle capacity developed with Zurich for data center owners and operators.
Direct distribution is projected to grow at a 7.4% CAGR through 2031. Technology-enabled platforms can digitize underwriting for standard construction and equipment exposures. This model is better suited to risks that have repeatable information and lower placement complexity. Direct tools can provide faster appetite signals and reduce administrative work for eligible policies. The engineering insurance market will still require broker expertise for large, complex, or multinational projects. The balance between direct and broker-led channels will depend on the technical complexity of each risk.
Geography Analysis
Europe held 40.7% of the global premium in 2025. A dense industrial asset base and mature regulatory system support demand across transport, energy, and commercial construction. Commission Delegated Regulation (EU) 2026/269 entered into force in March 2026 and applies from January 2027. The regulation changes Solvency II capital requirements and directs released insurer capital toward productive infrastructure investment. This supports engineering capacity during Europe's infrastructure renewal cycle.
Asia-Pacific is projected to grow at a 7.7% CAGR through 2031. India's INR 12.2 trillion (USD 140.6 billion) public capital expenditure for fiscal year 2026-27 supports a large pipeline of concurrent projects. Data centers, battery plants, and semiconductor facilities in China and Southeast Asia are high-value growth areas. These assets need coverage for power density and precision manufacturing risks that standard construction policies may not fully address. Japan is more constrained in 2026 because of pricing, regulatory changes, and higher natural catastrophe exposure.
North America has high insured values, active litigation, and social inflation affecting casualty lines. Contractor backlogs extend into 2027 across infrastructure, manufacturing, and technology, while data centers are the fastest-growing individual segment. The Middle East and Africa gain demand from Saudi Arabia's Vision 2030 projects and the United Arab Emirates' industrial expansion. South America benefits from Brazil's infrastructure program and Argentina's energy pipeline, although currency volatility and political risk constrain depth.

Competitive Landscape
The engineering insurance market is fragmented around Allianz Commercial, Zurich Insurance Group, AXA XL, Munich Re, Swiss Re, and Chubb. These carriers combine global project capacity with specialist underwriting and risk-engineering teams. Competition differs sharply between standard construction risks and technically demanding specialty lines. New capacity has softened standard construction conditions in some areas. Data center construction, tunneling rescue, and floating offshore wind still require specialist knowledge and retain firmer pricing.
Zurich reported 18% growth in Global Specialty construction premiums in the first half of 2026. It also expanded Data Center Project Guard into Europe and Latin America and secured a USD 1 billion data center construction quota share reinsurance arrangement. Marsh launched Stratus in August 2026, a USD 10 billion property insurance exchange for operational digital infrastructure supported by 30 capital providers. The exchange extends the construction-phase Nimbus facility across the data center asset lifecycle. These moves show insurers and brokers using specialist data and engineering expertise to develop more distinct product categories.
Floating offshore wind, green hydrogen, and advanced battery storage also need lifecycle solutions because reliable loss data remains limited. Accessible cover for small and medium-sized contractors and project owners in emerging economies remains another opportunity. Hannover Re reported an 83.2% property and casualty combined ratio in the first half of 2026 and maintained guidance for net income of at least EUR 2.7 billion (USD 2.94 billion). The company expected slightly lower January 2027 renewal prices, indicating more competition at the reinsurance layer.
Engineering Insurance Industry Leaders
Allianz SE
AXA XL
Zurich Insurance Group
Munich Re
Swiss Re
- *Disclaimer: Major Players sorted in no particular order

Recent Industry Developments
- August 2026: Marsh launched Stratus, a USD 10 billion property insurance exchange for operational digital infrastructure drawing on 30 capital providers, designed to extend the construction-phase Nimbus facility across the full data center asset lifecycle and expand into inland marine, cyber, and casualty lines.
- August 2026: Zurich reported 18% Global Specialty construction premium growth in H1 2026, expanded Data Center Project Guard into Europe and Latin America, and secured a USD 1 billion data center construction quota share reinsurance arrangement.
- July 2026: Aon expanded its Data Center Lifecycle Insurance Program to USD 5 billion in capacity, integrating insurance placement with engineering expertise and risk intelligence from the development phase through long-term operations.
- April 2026: WTW's Willis launched Digital Infrastructure Protector in partnership with Zurich, providing over USD 3 billion in integrated lifecycle capacity combining building, operational property, marine, and cargo coverage for data center owners, operators, and hyperscalers.


Global Engineering Insurance Market Report Scope
| Project Works Insurance |
| Operational and Completed-Asset Insurance |
| Contractors’ Plant and Machinery Insurance |
| Buildings |
| Civil and Transport Infrastructure |
| Energy, Water, and Waste Utilities |
| Industrial and Process Manufacturing |
| Digital Infrastructure |
| Contractors and EPC / OEM Erectors |
| Private Principals, Developers and Project SPVs |
| Private Owner-Operators |
| Government, SOEs as Principals, and Statutory Boards |
| Brokers |
| Agents |
| Direct |
| Bancassurance / Affinity / Other |
| North America | United States |
| Canada | |
| Mexico | |
| South America | Brazil |
| Argentina | |
| Rest of South America | |
| Europe | United Kingdom |
| Germany | |
| France | |
| Italy | |
| Spain | |
| Rest of Europe | |
| Asia-Pacific | China |
| Japan | |
| India | |
| South Korea | |
| Australia | |
| Indonesia | |
| Thailand | |
| Malaysia | |
| Singapore | |
| Vietnam | |
| Rest of Asia-Pacific | |
| Middle East and Africa | Saudi Arabia |
| United Arab Emirates | |
| Turkey | |
| South Africa | |
| Egypt | |
| Rest of Middle East and Africa |
| By Product Type | Project Works Insurance | |
| Operational and Completed-Asset Insurance | ||
| Contractors’ Plant and Machinery Insurance | ||
| By Application | Buildings | |
| Civil and Transport Infrastructure | ||
| Energy, Water, and Waste Utilities | ||
| Industrial and Process Manufacturing | ||
| Digital Infrastructure | ||
| By End User | Contractors and EPC / OEM Erectors | |
| Private Principals, Developers and Project SPVs | ||
| Private Owner-Operators | ||
| Government, SOEs as Principals, and Statutory Boards | ||
| By distribution channel | Brokers | |
| Agents | ||
| Direct | ||
| Bancassurance / Affinity / Other | ||
| By Geography | North America | United States |
| Canada | ||
| Mexico | ||
| South America | Brazil | |
| Argentina | ||
| Rest of South America | ||
| Europe | United Kingdom | |
| Germany | ||
| France | ||
| Italy | ||
| Spain | ||
| Rest of Europe | ||
| Asia-Pacific | China | |
| Japan | ||
| India | ||
| South Korea | ||
| Australia | ||
| Indonesia | ||
| Thailand | ||
| Malaysia | ||
| Singapore | ||
| Vietnam | ||
| Rest of Asia-Pacific | ||
| Middle East and Africa | Saudi Arabia | |
| United Arab Emirates | ||
| Turkey | ||
| South Africa | ||
| Egypt | ||
| Rest of Middle East and Africa | ||


Key Questions Answered in the Report
What is the projected value of the engineering insurance market by 2031?
The engineering insurance market is projected to reach USD 41.2 billion by 2031, growing at a 5.2% CAGR from 2026. Growth is supported by higher insured values in infrastructure, renewable energy, industrial projects, and digital assets. Large and complex projects also require greater technical underwriting capacity, especially where delays can create major financial losses. Policy demand also rises when lenders require formal protection for property damage, delay, and third-party liability before releasing project funds.
Which product type held the largest share in 2025?
Operational and Completed-Asset Insurance held 45.3% of revenue in 2025, supported by industrial plants, power stations, and transport assets that require recurring cover after construction is complete. The product benefits from stable operational exposures, even when construction activity varies between project cycles.
Which application is growing fastest through 2031?
Digital Infrastructure is projected to expand at a 10.2% CAGR through 2031 as data center construction increases. Specialized needs include cover for power systems, cooling systems, batteries, and high-value equipment. These risks are increasing the importance of early risk engineering and coordinated lifecycle protection.
Why is data center insurance becoming more important?
Data center projects have high construction and equipment values, and financing increasingly requires comprehensive engineering cover. Insurers must also assess fire controls, power density, accumulation exposure, and the continuity of critical systems. Such requirements favor insurers that can support project governance before construction begins and throughout the operational phase.
Which region led engineering insurance demand in 2025?
Europe held 40.7% in 2025, supported by industrial assets, infrastructure renewal, and mature insurance regulation. The European Union’s 2026 Solvency II reform applies from 2027 and supports capital allocation toward productive infrastructure. This framework can strengthen available capacity for infrastructure-related underwriting as renewal projects move forward.
What is the fastest-growing distribution channel?
Direct distribution is projected to grow at a 7.4% CAGR through 2031 as platforms digitize underwriting for standardized risks. Broker-led distribution remains important for complex projects that need layered capacity and specialist risk assessment. Larger clients continue to rely on brokers to arrange international placement and support complex claims management.
Page last updated on:


 Your data is secure and never sold or shared.


