Emergency And Disaster Response Market Size and Share
Market Overview
| Study Period | 2019 - 2031 |
|---|---|
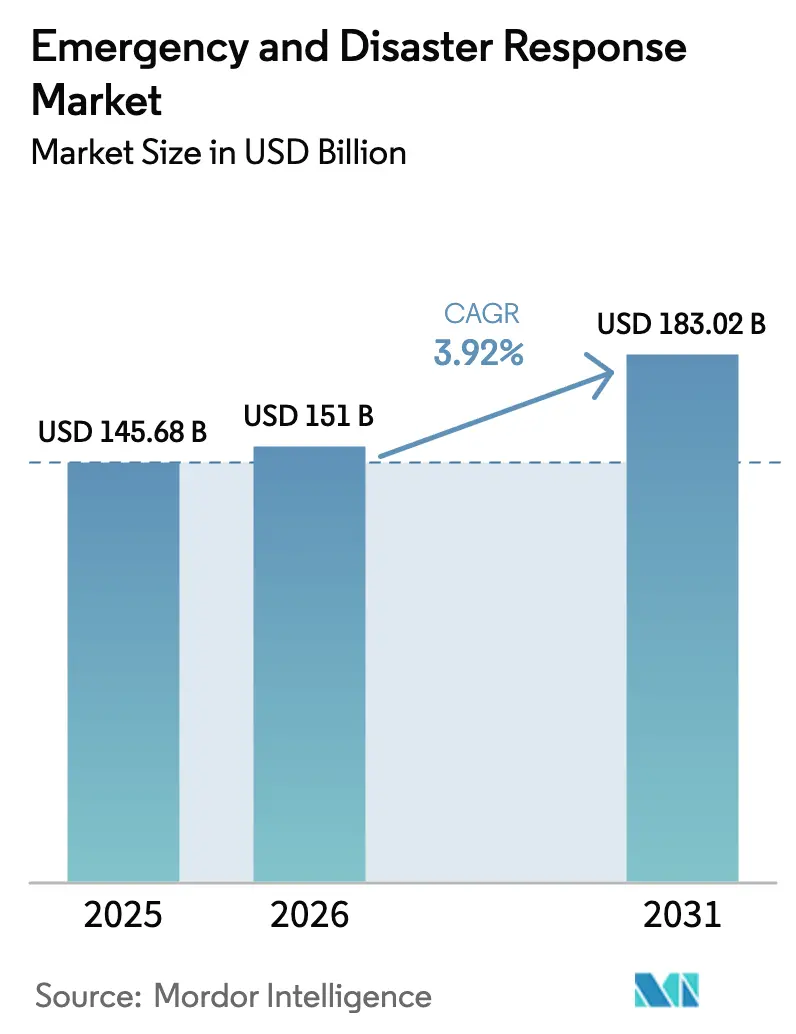
| Market Size (2026) | USD 151 Billion |
| Market Size (2031) | USD 183.02 Billion |
| Growth Rate (2026 - 2031) | 3.92% CAGR |
| Fastest Growing Market | Asia Pacific |
| Largest Market | North America |
| Market Concentration | Medium |
Major Players *Disclaimer: Major Players sorted in no particular order Image © Mordor Intelligence. Reuse requires attribution under CC BY 4.0. | |
Emergency And Disaster Response Market Analysis by Mordor Intelligence
The emergency and disaster response market size is expected to grow from USD 145.68 billion in 2025 to USD 151.01 billion in 2026 and is forecasted to reach USD 183.02 billion by 2031 at a 3.92% CAGR over 2026-2031. The market is shifting from one-off hardware purchases to software-orchestrated ecosystems that join real-time data, AI analytics, and autonomous deployment. Climate-driven event severity is rising even as public budgets tighten, so procurement teams are prioritizing interoperable platforms that stretch limited capital. Agencies are integrating drones, mesh radios, and predictive software into their asset fleets to expedite decision-making and reduce the lifetime costs of their operations. Vendors able to deliver over-the-air updates, zero-trust cyber designs, and multi-jurisdiction certifications are gaining a durable edge as the emergency and disaster response market professionalizes worldwide.
Key Report Takeaways
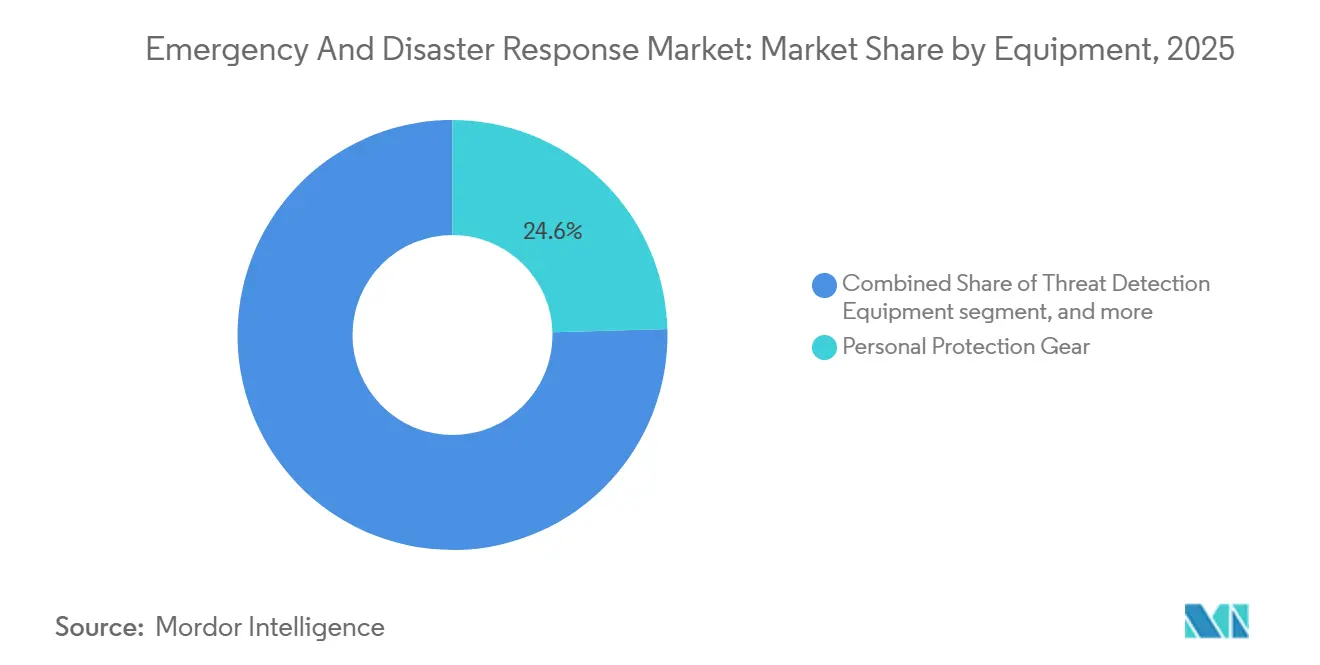
- By equipment category, personal protection gear led with a 24.56% revenue share in 2025, while threat detection equipment is expected to advance at a 5.65% CAGR through 2031.
- By platform, land assets held 70.45% of the emergency and disaster response market share in 2025; airborne solutions posted the fastest 6.10% CAGR through 2031.
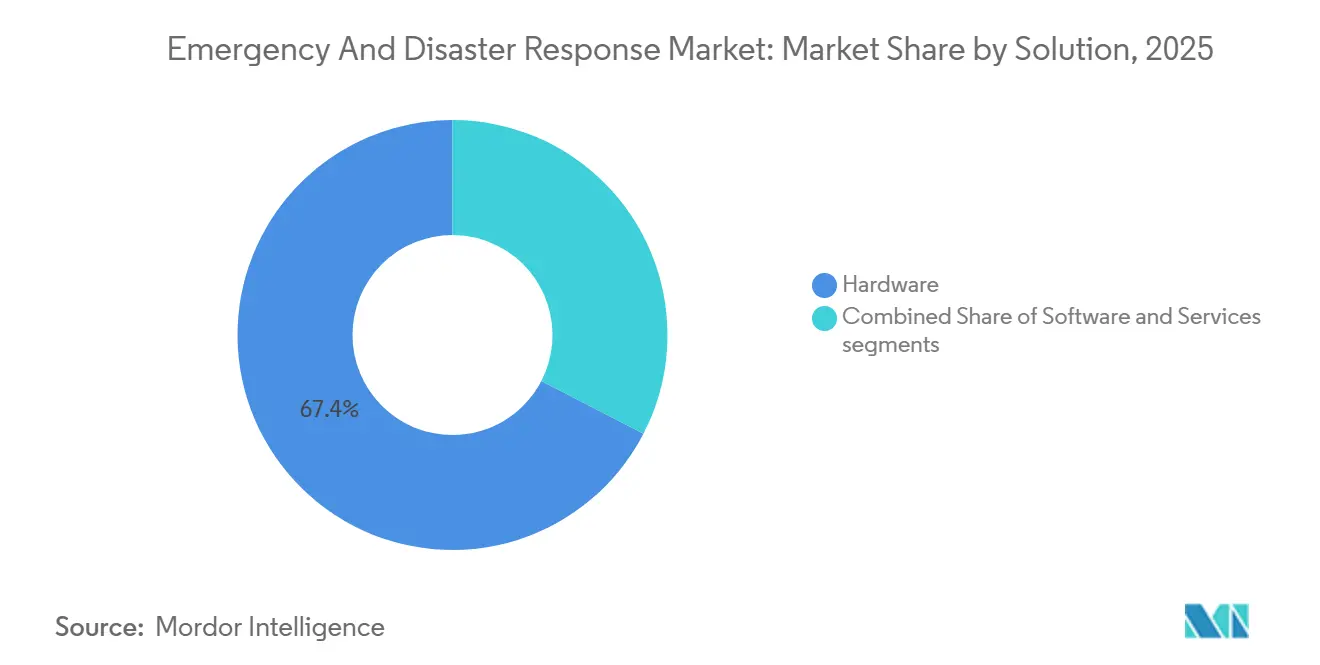
- By solution, hardware accounted for 67.40% of the emergency and disaster response market size in 2025, and software is projected to expand at a 6.47% CAGR over the same horizon.
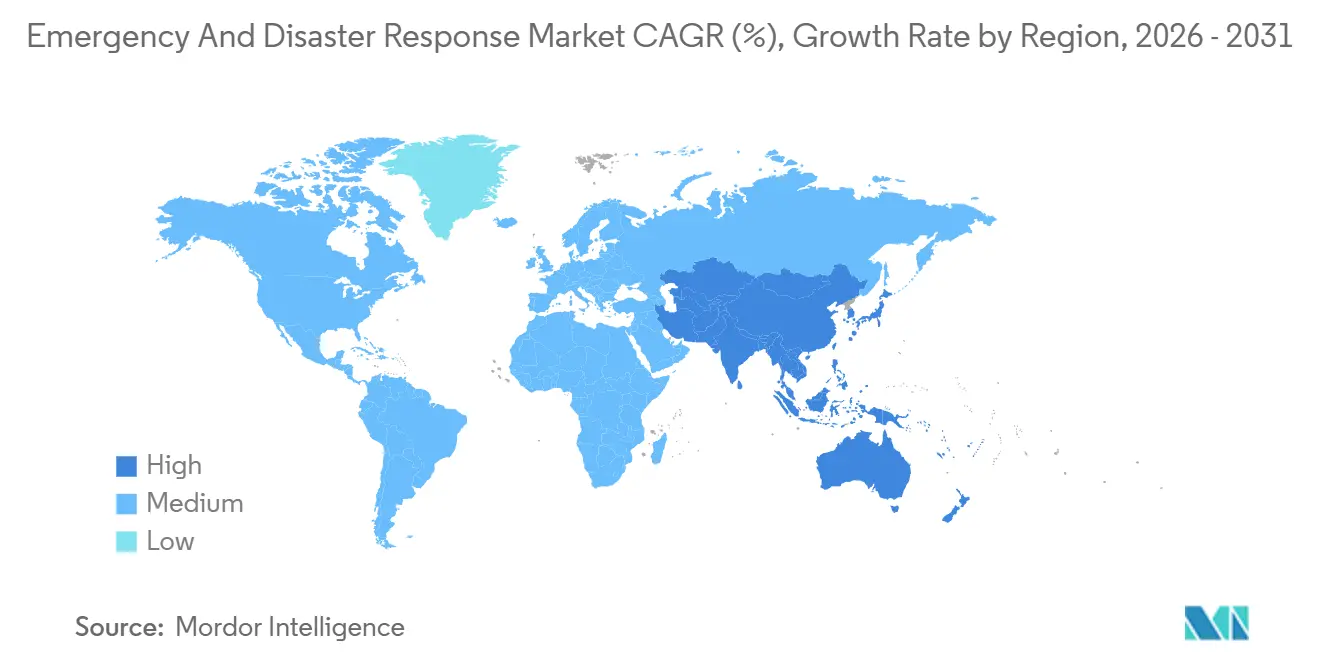
- By geography, North America accounted for 37.15% of revenue in 2025, while the Asia-Pacific region recorded the strongest 5.20% CAGR from 2026 to 2031.
Note: Market size and forecast figures in this report are generated using Mordor Intelligence’s proprietary estimation framework, updated with the latest available data and insights as of January 2026.
Global Emergency And Disaster Response Market Trends and Insights
Drivers Impact Analysis*
| Driver | (~) % Impact on CAGR Forecast | Geographic Relevance | Impact Timeline |
|---|---|---|---|
| Rising frequency and severity of natural disasters | +0.9% | Global, acute in Asia-Pacific typhoon corridors and North American wildfire zones | Long term (≥ 4 years) |
| Government funding and regulatory mandates | +0.7% | North America and EU core, emerging in Middle East | Medium term (2-4 years) |
| Technological advances in AI, IoT, GIS and drones | +0.8% | Global, led by North America and Asia-Pacific innovation hubs | Medium term (2-4 years) |
| Satellite-independent mesh networking adoption | +0.5% | Asia-Pacific rural regions, Africa, South America | Long term (≥ 4 years) |
| Hybrid/e-powertrain shift in response vehicles | +0.4% | Europe and North America | Medium term (2-4 years) |
| Cross-border mutual-aid procurement pools | +0.3% | European Union rescEU, ASEAN regional frameworks | Short term (≤ 2 years) |
| Source: Mordor Intelligence | |||
Rising Frequency and Severity of Natural Disasters
Natural disasters resulted in USD 280 billion in global economic losses in 2024, a 19% surge over the annual average for 2019-2023. Almost half of the impacted provinces, states, or districts subsequently endured another major event within an 18-month window, compressing recovery periods and exhausting inventories of critical gear. Procurement officers are therefore prioritizing fly-ready containerized water-purification plants, inflatable surgical theaters, and flat-pack housing units that can be airlifted and operational within three days. Simultaneously, predictive analytics platforms now integrate high-resolution climate models with vulnerability datasets for bridges, levees, and hospitals to guide pre-disaster planning. Reflecting this mindset, Japan earmarked JPY 42 billion (approximately USD 285 million) in 2025 for AI forecasting systems that integrate directly into evacuation-routing software.[1]Source: Cabinet Office Japan, “Disaster Management in Japan 2025 Budget,” Government of Japan, cao.go.jp
Government Funding and Regulatory Mandates
Government outlays and statutory directives are now the twin accelerants steering modernization budgets toward digital architectures. The US increased state and local preparedness grants by 14% to USD 3.2 billion for 2025. It allocated 35% of the total for technology upgrades, indicating that software subscriptions, sensor fusion, and drone fleets are now allowable grant expenses. In Europe, the 2024 Critical Entities Resilience Directive requires each member state to conduct biennial stress tests and migrate to interoperable broadband networks by December 2026, effectively phasing out legacy narrowband radios. Gulf buyers prefer turnkey command centers. Saudi Arabia allocated SAR 1.8 billion (approximately USD 480 million) in 2024 for an integrated national system, underscoring the growing demand for vendor-managed, sovereign-hosted solutions that ensure data residency and meet multilevel cyber certification standards.[2]Source: Saudi Press Agency Editors, “Crisis and Disaster Management Procurement Program,” SPA, spa.gov.sa
Technological Advances in AI, IoT, GIS and Drones
Rapid maturation of AI, IoT sensors, geospatial analytics, and unmanned aircraft is redefining on-scene situational awareness. Motorola's cloud-native CommandCentral Aware ingests body-camera streams from 180 US cities and autonomously grades incident severity, cutting median dispatch time by 11% during 2025 pilots. Hexagon's HxGN OnCall aggregates feeds from 14 sensor types and refreshes probabilistic risk maps every 90 seconds, providing commanders with near-real-time snapshots of infrastructure exposure. DJI's Matrice 350 RTK, certified for emergency operations in 22 countries, can transport 6 kg of medical supplies to GPS coordinates within 15 minutes, broadening the drone's roles beyond reconnaissance. Further reach arrived when the FAA's 2024 BVLOS rule authorized 50-mile autonomous flights, enabling wildfire perimeter mapping in previously inaccessible terrain and facilitating nocturnal search-and-rescue sorties.
Satellite-Independent Mesh Networking Adoption
Reliance on orbital links is waning as ruggedized terrestrial mesh radios prove cheaper, faster, and more resilient during infrastructure outages. Rajant’s Kinetic Mesh kept Australian Rural Fire Service crews connected after cell towers collapsed in 2024 bushfires, streaming helmet-mounted video to incident command without packet loss. India installed 1,200 mesh-capable handsets across Bihar and Assam in 2025, reducing the average duration of flood-related communication blackouts from 14 hours to 90 minutes. Financial calculus favors mesh: capital expenditure averages USD 2,800 per node, compared with USD 18,000 for an equivalent-bandwidth satellite terminal. Standards convergence is looming because proprietary waveforms hinder cross-agency communication; the IETF’s draft RFC 9524 may establish an open emergency mesh protocol that underpins seamless multinational responses during wildfire, flood, and earthquake operations worldwide.
Restraints Impact Analysis*
| Restraint | (~) % Impact on CAGR Forecast | Geographic Relevance | Impact Timeline |
|---|---|---|---|
| Budget constraints in developing economies | -0.5% | Sub-Saharan Africa, South Asia, South America | Medium term (2-4 years) |
| Complex and fragmented interoperability standards | -0.3% | Global, acute in multi-agency jurisdictions | Long term (≥ 4 years) |
| Cyber-attack risk on connected response systems | -0.2% | North America, Europe, advanced Asia-Pacific markets | Short term (≤ 2 years) |
| Skilled-operator shortage for advanced assets | -0.4% | Global, severity inversely tied to GDP per capita | Medium term (2-4 years) |
| Source: Mordor Intelligence | |||
Budget Constraints in Developing Economies
As hazard exposure intensifies, limited fiscal headroom is stalling equipment modernization in lower-middle-income regions. The World Bank highlighted that in 2024, 18 governments across Sub-Saharan Africa reduced non-debt public investments by an average of 1.2% of GDP, with disaster preparedness facing the brunt of these cuts.[3]Source: World Bank Research Group, “Global Economic Prospects June 2025,” World Bank, worldbank.org In response, Kenya abandoned a USD 12 million tender for a mobile command unit and opted instead for refurbished vehicles provided by European agencies.
Adding to the woes, currency depreciation poses a significant hurdle: NGN has plummeted by 129% since January 2024, effectively more than doubling the price of essential imports, such as thermal cameras, satellite phones, and power generators. While multilateral lenders have rolled out concessional facilities, data from the Asian Development Bank reveal a concerning lag: loan disbursements stretch over 18-24 months. This delay creates capability gaps during back-to-back cyclone or flood seasons, forcing agencies to push aging hardware well beyond its intended service life.
Complex and Fragmented Interoperability Standards
Patchwork radio and broadband standards hamper multi-agency coordination and inflate lifecycle costs. During the 2024 California Park Fire, mutual-aid crews from neighboring states were unable to connect to incident command because their radios used incompatible trunking architectures, forcing a fallback to analog simplex channels with a 40% shorter range. The US FirstNet roadmap anticipates that legacy land-mobile radio migration will last until 2032, preserving at least seven years of hybrid operation that requires dual-mode devices and duplicate maintenance budgets. The International Association of Fire Chiefs estimates that managing two parallel communication systems inflates the total cost of ownership by 22% for cash-strapped municipalities. Global convergence may be achieved through the 3GPP Mission-Critical Push-to-Talk over LTE; however, wholesale infrastructure swap-outs remain financially daunting for agencies.
*Our forecasts treat driver/restraint impacts as directional, not additive. The impact forecasts reflect baseline growth, mix effects, and variable interactions.
Segment Analysis
By Equipment: Threat Detection Leads Innovation Velocity
Personal protection gear accounted for 24.56% of 2025 revenue, underscoring its non-discretionary status in the emergency and disaster response market. Threat detection equipment is the fastest-growing segment, with a 5.65% CAGR, as chemical, biological, radiological, and nuclear sensors shrink and incorporate AI analytic layers. Miniaturized Raman spectrometers that can identify a chemical compound from a database of 14,000 in just 30 seconds are being rapidly adopted by agencies. This swift adoption is driving significant growth in the market for threat-detection equipment used in emergency and disaster response. Firefighting equipment ranks second in revenue but faces margin pressure as municipalities extend ladder truck lifespans to 18 years. Temporary shelter equipment remains concentrated in hurricane belts, whereas mountaineering equipment serves alpine rescue teams. A residual “other” balancer of decontamination units and portable generators tracks overall growth in the emergency and disaster response market.
Improving sensor accuracy, utilizing heads-up displays, and implementing over-the-air firmware upgrades make threat detection equipment a magnet for innovation. 3M’s M7 SCBA overlays thermal detail on the visor, lightening cognitive load in smoky interiors. Smiths Detection’s handheld Raman device, honored with a Queen’s Award in 2025, migrated aviation-security algorithms into field detection tasks, demonstrating cross-sector tech transfer. As climate events increase the risk of hazardous-materials spills, procurement officers view high-fidelity threat detectors as force multipliers. Vendors that bundle analytics subscriptions with hardware are capturing sticky software margins, reinforcing the broader shift from hardware to software in the emergency and disaster response market.


By Platform: Airborne Segment Disrupts Land Dominance
Land vehicles accounted for 70.45% of 2025 revenue, while airborne assets notched the swiftest 6.10% CAGR as loosened rules and lighter sensors expanded mission sets. The emergency and disaster response market share held by land fleets remains substantial, but replacement cycles are lengthening as electric drivetrains offer 20-year warranties. Airborne growth accelerates due to drones mapping wildfires beyond the visual line of sight and long-endurance unmanned aircraft gathering cyclone data at a fraction of the cost of manned flights. Marine craft are driven by autonomous surface vessels that perform swift-water rescues with an 89% retrieval success rate during trials in Mississippi.
Platform convergence boosts utilization: Leonardo’s AW169 helicopter can switch from hoist to medical to firefighting modules in 90 minutes, doubling asset utilization rates. Electric pumper warranties extend service life, slowing land-segment volume but heightening after-sales parts and software revenue. For airborne suppliers, certifying both the platform and mission-specific autopilots is crucial for winning multi-role contracts, an essential edge in the emergency and disaster response market, which prizes versatility over single-purpose craft.
By Solution: Software Gains as Agencies Digitize Workflows
Hardware supplied 67.40% of the 2025 solution revenue, while software grew at a 6.47% CAGR, the fastest among the three pillars. Everbridge's machine-learning platform cuts evacuation planning from four hours to 18 minutes by synthesizing weather, traffic, and population data. The software emergency and disaster response market is set to expand as agencies redirect capital toward digital twin modeling and ML dispatch.
Predictive maintenance software reduces unplanned downtime and defers hardware replacement, thereby compressing hardware shipments while increasing the lifetime value of assets. IBM's Intelligent Operations Center in Rio de Janeiro monitors 4,200 field sensors to forecast equipment failure 72 hours in advance, extending asset life by 11%. Subscription pricing, such as Motorola's per-incident CommandCentral fees, democratizes access for smaller towns previously blocked by large upfront outlays. Regulatory shifts, such as the US DHS Software Acquisition Pathway, allow grant funds to be used to purchase cloud software, further entrenching the software's ascent in the emergency and disaster response market.
Geography Analysis
North America accounted for 37.15% of 2025 revenue, driven by robust FEMA grant streams and mandatory technology refresh cycles. Growth moderates to a 3.5% CAGR through 2031 as the installed base saturates and the spending mix skews toward software. Canada funneled CAD 1.1 billion (USD 810 million) into Indigenous community infrastructure, expanding previously underserved sub-markets. Mexico is modernizing its seismic alert grid with 2,100 accelerometers to cut warning latency below 10 seconds.
The Asia-Pacific region leads expansion with a 5.20% CAGR, proving to be the most dynamic emergency and disaster response market. China has invested approximately USD 6.5 billion in provincial AI-enabled command centers and aims to achieve 90% digital workflow adoption by 2027. India’s mesh-radio rollout and Japan’s AI forecasting pilots exemplify leapfrogging directly to advanced architectures. South Korea’s 5G public safety network already covers 98% of the population, enabling live video feeds from incident scenes. Indonesia procured 85 amphibious rescue vehicles following the 2024 floods, whereas Australia is standardizing communications following the 2024 review.
Europe continues to strengthen its emergency response landscape, driven by the rescEU pooling model and a continent-wide directive that hardens critical entities across provincial and municipal agencies. Germany is upgrading its geofenced alert network, while France has commissioned multi-role Airbus helicopters to bolster aerial medical evacuation and firefighting capacity, as well as early warning data fusion systems. The UK is approaching full coverage on its new broadband emergency services network, although device certification remains a hurdle. Russian agencies are focusing on domestically produced platforms amid ongoing sanctions. Sovereign capability programs are also rising in the Gulf, and new funding mechanisms are emerging in Brazil and South Africa to offset fiscal constraints.

Competitive Landscape
The emergency and disaster response market is moderately concentrated, with numerous players catering to diverse applications, and top vendors such as Honeywell, Leonardo S.p.A., Everbridge, Hexagon AB, and Rosenbauer leading the way. These incumbents are increasingly leaning into software-as-a-service (SaaS) models, a strategy underscored by Motorola's USD 180 million acquisition of Noggin. This move not only bolsters Motorola's offerings but also seamlessly integrates incident management into its existing radio network. Meanwhile, specialists are carving out niches, focusing on quantum-secure communications and modular shelters powered by renewable microgrids. By adopting open architectures, they effectively sidestep vendor lock-in.
In 2024, patent filings surged by 67% for AI-driven dispatch optimization, underscoring the technology's pivotal role in the competitive landscape. Honeywell, leveraging its prowess, secured a patent for vibration analytics. This tool can predict fire-pump bearing failures up to 90 days in advance, effectively transforming IoT data into robust intellectual property. Additionally, firms like Juvare, benefiting from liability protections under the US SAFETY Act, have successfully clinched accounts with hospitals wary of legal repercussions. In a strategic move, 11 out of 18 monitored companies established units or joint ventures in the Middle East between 2024 and 2025, targeting the region's sovereign spending.
Non-traditional players are intensifying the competition. For instance, IBM and the Red Cross are harnessing AI to allocate resources across 48 nations, seamlessly integrating smart-city solutions into emergency management. Cloud giants are fortifying their positions: Everbridge's transition to AWS GovCloud, coupled with securing FedRAMP High status, has opened doors to a lucrative USD 400 million federal market in the US. As the emergency and disaster response landscape evolves, success increasingly hinges on the ability to meld open-standard hardware with agile, cloud-native orchestration, meeting agencies' demands for both interoperability and swift feature updates.
Emergency And Disaster Response Industry Leaders
Honeywell International Inc.
Everbridge, Inc.
Hexagon AB
Rosenbauer International AG
Leonardo S.p.A.
- *Disclaimer: Major Players sorted in no particular order

Recent Industry Developments
- December 2025: Everbridge, ServiceNow, and Ekatra unveiled the Emergency Event Management (EEM) solution, designed to enhance the efficiency of emergency response for critical infrastructure organizations. By combining predictive intelligence, AI-driven workflows, and field coordination, EEM addresses operational challenges, enabling faster decision-making and improved service continuity. This development reflects a strategic response to increasing climate-related disruptions, positioning the companies as key players in advancing infrastructure resilience and supporting utilities in mitigating risks and maintaining service reliability during emergencies.
- January 2025: Smiths Detection was awarded the contract by the Japanese MoD for its LCD 4 personal chemical detectors, reflecting a strategic move to enhance chemical threat detection within the Japan Ground Self-Defence Force. This development underscores the increasing reliance on advanced detection technologies in defense operations. With phased deliveries through 2026, the contract highlights the importance of localized customization and integration, presenting growth opportunities for chemical detection solutions and reinforcing the critical role of technology in national defense strategies.


Global Emergency And Disaster Response Market Report Scope
The emergence of this market is a response to the growing frequency and severity of emergencies and disasters worldwide. The need for a comprehensive and coordinated response has become evident, from devastating earthquakes and hurricanes to industrial accidents and public health crises. The market encompasses a wide range of products and services to mitigate, manage, and recover from various crises. Equipment considered includes medical supplies and equipment, search-and-rescue (SAR) technologies, communication systems, emergency vehicles, and training services.
The emergency and disaster response market is segmented by equipment, platform, solution, and geography. By equipment type, the market is segmented into threat detection equipment, personal protection gear, firefighting equipment, medical equipment, temporary shelter equipment, mountaineering equipment, and other specialized equipment. By platform, the market is segmented into land, marine, and airborne. By solution, the market is segmented into hardware, software, and services. The report also covers the market sizes and forecasts for the emergency and disaster response market in major countries across different regions. For each segment, the market size is provided in terms of value (USD).
| Threat Detection Equipment |
| Personal Protection Gear |
| Medical Equipment |
| Temporary Shelter Equipment |
| Mountaineering Equipment |
| Fire-Fighting Equipment |
| Other Equipment |
| Land |
| Marine |
| Airborne |
| Hardware |
| Software |
| Services |
| North America | United States | |
| Canada | ||
| Mexico | ||
| Europe | United Kingdom | |
| France | ||
| Germany | ||
| Russia | ||
| Rest of Europe | ||
| Asia-Pacific | China | |
| India | ||
| Japan | ||
| South Korea | ||
| Rest of Asia-Pacific | ||
| South America | Brazil | |
| Rest of South America | ||
| Middle East and Africa | Middle East | Saudi Arabia |
| United Arab Emirates | ||
| Israel | ||
| Rest of Middle East | ||
| Africa | South Africa | |
| Rest of Africa | ||
| By Equipment | Threat Detection Equipment | ||
| Personal Protection Gear | |||
| Medical Equipment | |||
| Temporary Shelter Equipment | |||
| Mountaineering Equipment | |||
| Fire-Fighting Equipment | |||
| Other Equipment | |||
| By Platform | Land | ||
| Marine | |||
| Airborne | |||
| By Solution | Hardware | ||
| Software | |||
| Services | |||
| By Geography | North America | United States | |
| Canada | |||
| Mexico | |||
| Europe | United Kingdom | ||
| France | |||
| Germany | |||
| Russia | |||
| Rest of Europe | |||
| Asia-Pacific | China | ||
| India | |||
| Japan | |||
| South Korea | |||
| Rest of Asia-Pacific | |||
| South America | Brazil | ||
| Rest of South America | |||
| Middle East and Africa | Middle East | Saudi Arabia | |
| United Arab Emirates | |||
| Israel | |||
| Rest of Middle East | |||
| Africa | South Africa | ||
| Rest of Africa | |||


Key Questions Answered in the Report
What is the projected value of the emergency and disaster response market in 2031?
The emergency and disaster response market is expected to reach USD 183.02 billion by 2031 based on a 3.92% CAGR.
Which region is expanding fastest in Emergency And Disaster Response solutions?
Asia-Pacific posts the strongest 5.20% CAGR through 2031, driven by mesh networking and command-center digitization.
Which equipment category is growing quickest?
Threat detection equipment leads with a 5.65% CAGR because of AI-enabled CBRN sensors.
Why are software platforms gaining share across emergency services?
Agencies are shifting budgets to predictive analytics and digital twins that cut planning time and extend hardware life, pushing Software to a 6.47% CAGR.
What new vehicle technologies are influencing procurement?
Electric and hybrid powertrains now meet zero-emission mandates, offering lower lifetime cost and reduced on-scene emissions for fire departments.
Page last updated on:


