Solid Electrolyte Market Size and Share
Market Overview
| Study Period | 2021 - 2031 |
|---|---|
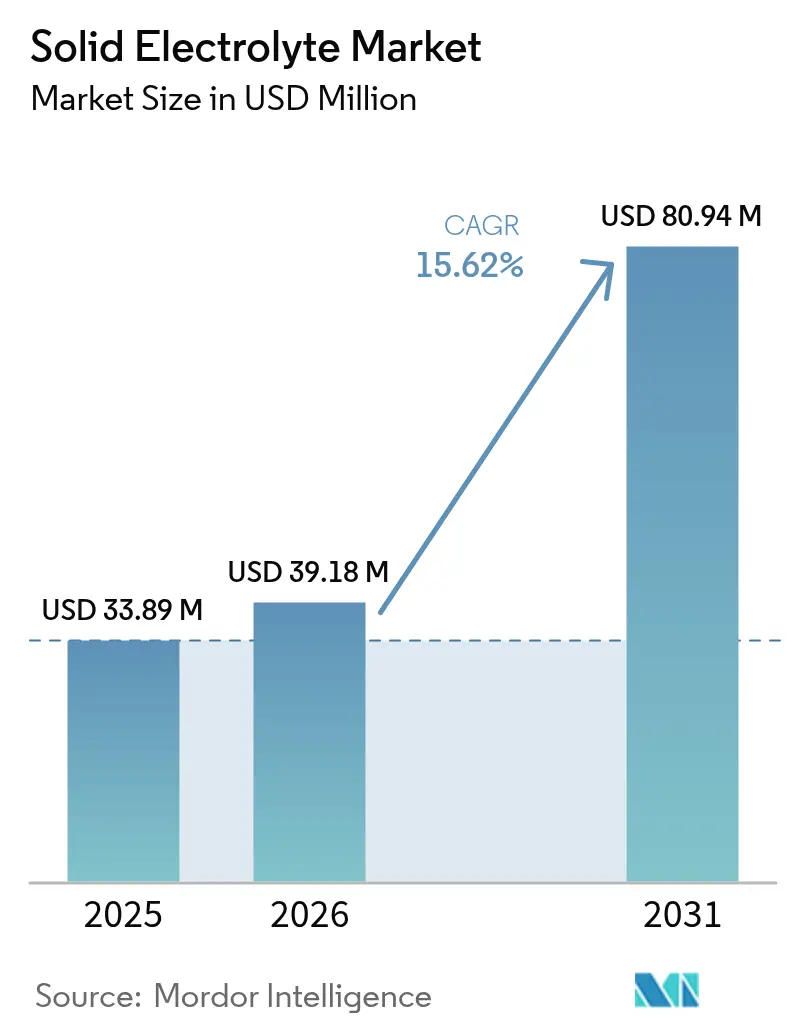
| Market Size (2026) | USD 39.18 Million |
| Market Size (2031) | USD 80.94 Million |
| Growth Rate (2026 - 2031) | 15.62% CAGR |
| Fastest Growing Market | Asia Pacific |
| Largest Market | Asia Pacific |
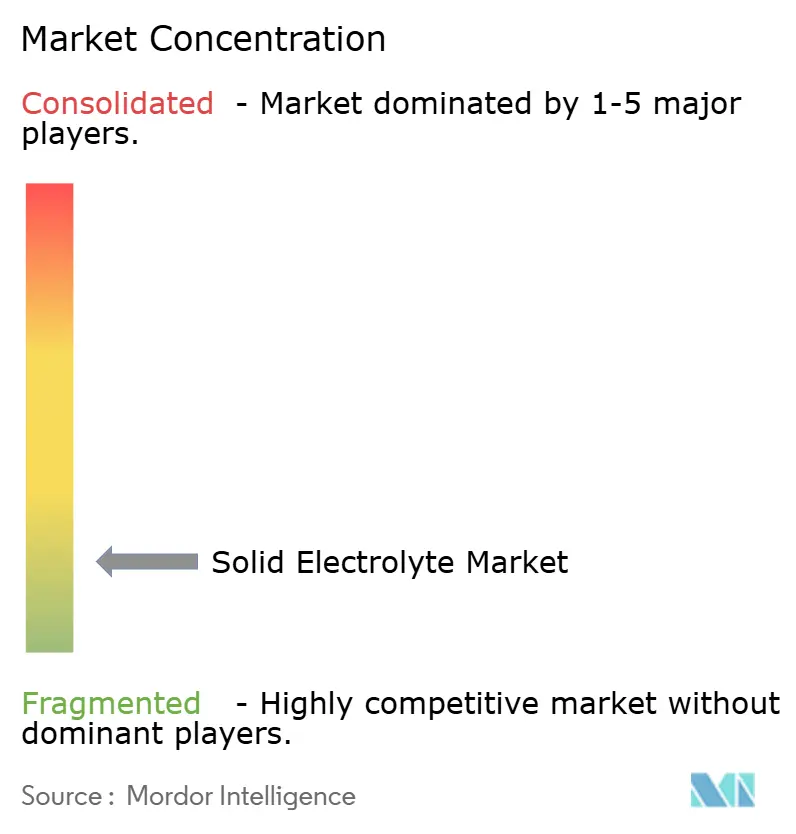
| Market Concentration | Low |
Major Players *Disclaimer: Major Players sorted in no particular order Image © Mordor Intelligence. Reuse requires attribution under CC BY 4.0. | |
Solid Electrolyte Market Analysis by Mordor Intelligence
The Solid Electrolyte market size is expected to grow from USD 33.89 million in 2025 to USD 39.18 million in 2026 and is forecast to reach USD 80.94 million by 2031 at 15.62% CAGR over 2026-2031.
Demand accelerates as automotive OEMs pivot toward solid-state batteries to meet stringent global safety rules, compete for energy densities above 500 Wh/kg, and shorten charging times. Material breakthroughs, manufacturing scale-ups, and public funding align with corporate roadmaps, signaling that the solid electrolyte market is moving rapidly from pilot lines to early commercial production. Fragmented competition, coupled with multiple viable chemistries, keeps entry barriers modest but drives an intense patent race. Regional dominance remains with the Asia-Pacific, yet North American and European capacity build-outs suggest a more balanced global footprint by the end of the decade.
Key Report Takeaways
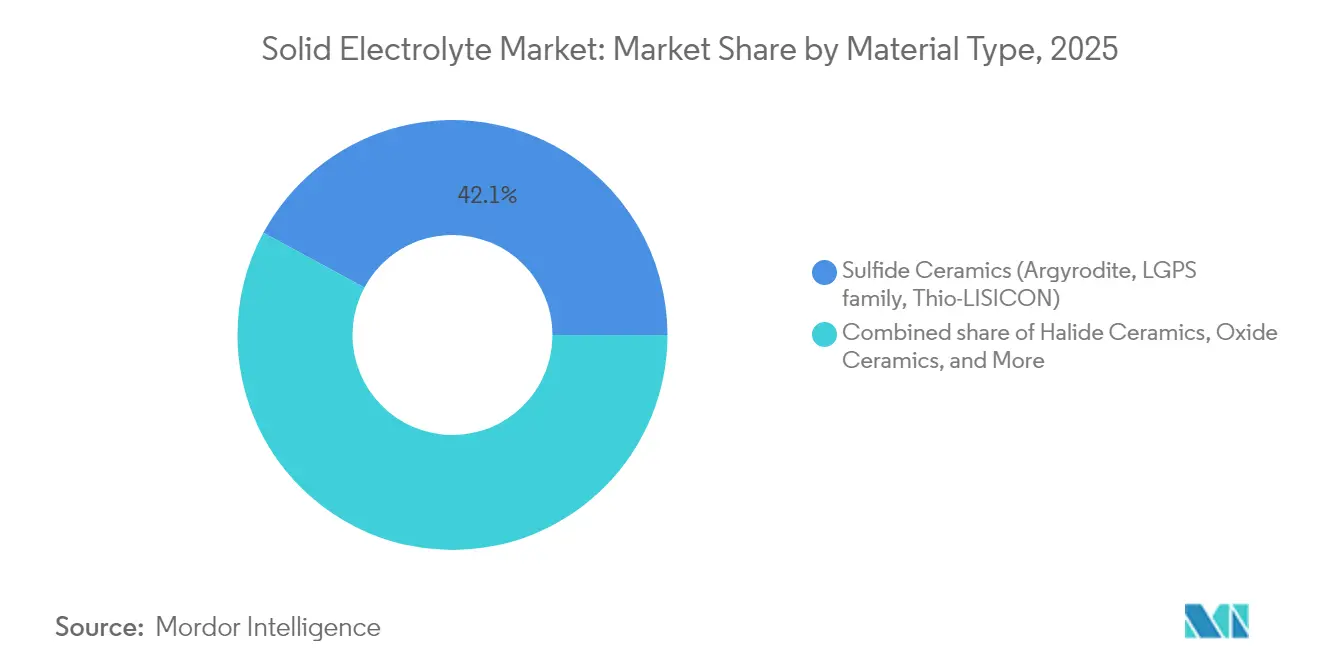
- By material type, sulfide ceramics accounted for 42.12% of the solid electrolyte market share in 2025, while halide ceramics are poised to expand at a 18.74% CAGR to 2031.
- By battery type, EV traction batteries captured 52.40% of the solid electrolyte market size in 2025 and are set to grow at an 18.52% CAGR through 2031.
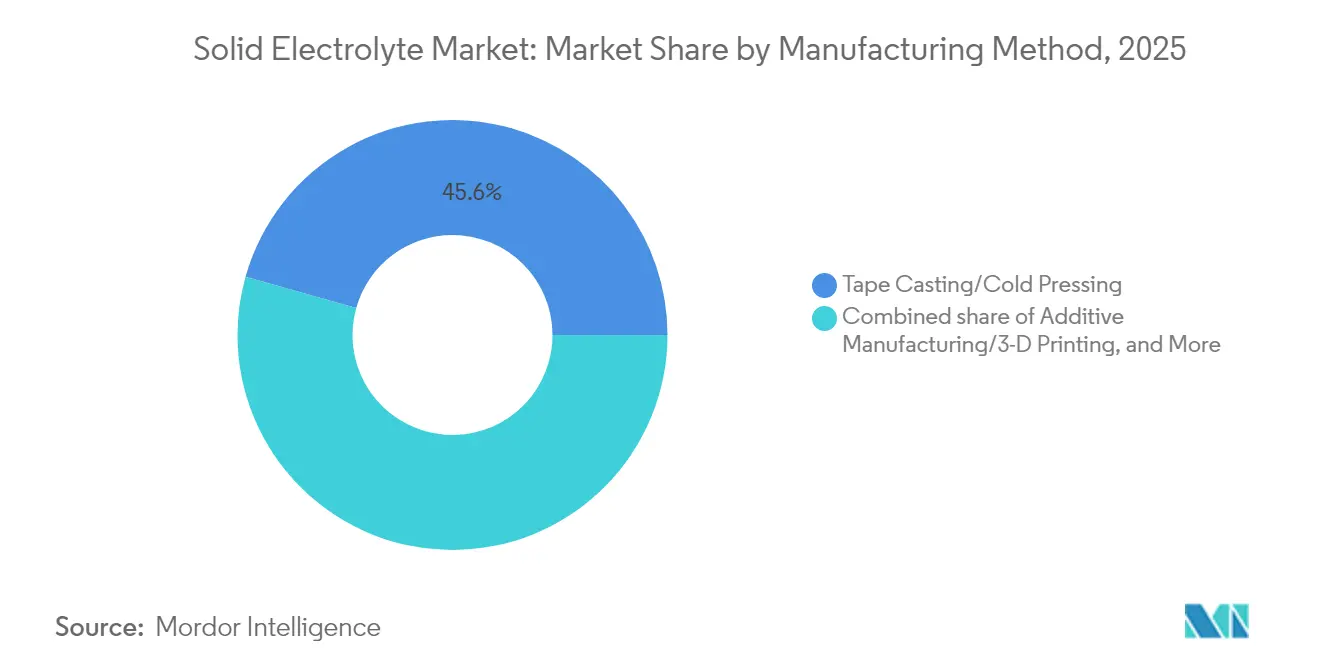
- By manufacturing method, tape casting led with a 45.63% share of the solid electrolyte market size in 2025; additive manufacturing is projected to record the highest CAGR at 19.31% between 2026 and 2031.
- By thickness, the 25 to 100 µm range accounted for 44.25% of the solid electrolyte market size in 2025 and is expected to expand at a 17.19% CAGR.
- By end-use Industry, the automotive segment captured 47.85% of the solid electrolyte market size in 2025 and is projected to grow at a 18.55% CAGR.
- By geography, the Asia-Pacific region held a 57.75% revenue share in 2025, while North America is projected to exhibit the fastest regional CAGR of 18.05% over the forecast period.
Note: Market size and forecast figures in this report are generated using Mordor Intelligence’s proprietary estimation framework, updated with the latest available data and insights as of 2026.
Global Solid Electrolyte Market Trends and Insights
Drivers Impact Analysis*
| Driver | (~) % Impact on CAGR Forecast | Geographic Relevance | Impact Timeline |
|---|---|---|---|
| EV safety regulations shifting toward solid-state chemistry | +3.20% | EU, Japan, global spill-over | Medium term (2-4 years) |
| OEM R&D race for >500 Wh/kg batteries | +4.10% | Asia-Pacific lead, North America follow-on | Medium term (2-4 years) |
| Venture-capital inflows & pilot-line scale-ups | +2.80% | North America, China | Short term (≤ 2 years) |
| Consumer micro-devices needing ultra-thin cells | +1.90% | Asia manufacturing hubs | Long term (≥ 4 years) |
| Sodium solid electrolytes for grid-scale storage | +2.30% | Global renewables markets | Long term (≥ 4 years) |
| Defence requirement for −50 °C to +150 °C packs | +1.50% | North America, Europe | Medium term (2-4 years) |
| Source: Mordor Intelligence | |||
EV Safety Regulations Shifting Toward Solid-State Chemistry
New battery directives in the European Union require stringent thermal runaway prevention, a criterion that is met more readily by solid electrolytes than by liquid-filled lithium-ion cells.(1)European Commission, “Battery Regulation (EU) 2023/1542,” europa.eu Japan issued safety approvals for Toyota’s solid-state EV program in late 2024, signalling regulatory comfort with ceramic separators in high-energy applications. In aviation, the Federal Aviation Administration is evaluating solid electrolytes to meet low-flammability targets for next-gen aircraft power systems.(2)Federal Aviation Administration, “Electrolyte Safety Research Program,” faa.govThese actions align global regulators behind a common safety rationale that elevates solid-state chemistry from optional to essential in upcoming platform designs. Automakers therefore integrate solid electrolytes not only for performance but also to secure future type approval across markets.
OEM R&D Race for >500 Wh/kg Batteries
Breakthrough energy densities around 500 Wh/kg, showcased by CATL’s condensed-state cell prototypes in 2024, validate solid electrolytes as the enabling architecture for ultra-light vehicle packs.(3)Contemporary Amperex Technology Co. Limited, “Condensed State Battery White Paper,” catl.com Subsequent lab demonstrations, climbing toward 711 Wh/kg, underscore a rapidly expanding theoretical ceiling. The pursuit encompasses charge-rate targets of sub-15 minutes, which demand high-temperature tolerance that ceramic or halide electrolytes provide. Competing OEMs now view the chemistry as central to their 2027-2030 product cycles, intensifying procurement of sulfide, halide, and oxide materials and stimulating multibillion-dollar supply contracts.
Venture-Capital Inflows & Pilot-Line Scale-Ups
QuantumScape secured continued funding through its Volkswagen alliance, while Solid Power extended its collaboration with Ford and applied for a USD 50 million Department of Energy grant aimed at scaling up ceramic electrolytes. These investments emphasise a shift from laboratory proof-of-concept toward 100 MWh-level pilot output. Capital flows increasingly prioritise equipment, yield improvement, and process automation over basic research, indicating that financiers now measure success by progress on manufacturing metrics such as square-metre cost and cell throughput.
Consumer Micro-Devices Needing Ultra-Thin Cells
Samsung Electro-Mechanics plans to sample sub-50 µm all-solid-state cells for wearables in 2025, with mass production targeted for 2026. Solid electrolytes remove flammable solvents, permitting thinner packaging and enabling flexible or implantable devices to achieve higher volumetric energy without safety trade-offs. Medical electronics vendors anticipate adoption for pacemakers and neurostimulators, where failure tolerance is minimal. These niche, high-margin segments provide early revenue ahead of high-volume automotive launches.
Restraints Impact Analysis*
| Restraint | (~) % Impact on CAGR Forecast | Geographic Relevance | Impact Timeline |
|---|---|---|---|
| High sintering & deposition CAPEX | −2.8% | Global manufacturing hubs | Short term (≤ 2 years) |
| Ceramic processing yield losses | −2.1% | Asia-Pacific fabs | Medium term (2-4 years) |
| Li-metal dendrite breach in sulfide matrices | −1.9% | Global R&D centers | Medium term (2-4 years) |
| Scarce Li₂S & high-purity P₂S₅ supply | −1.7% | Asia-Pacific sourcing | Long term (≥ 4 years) |
| Source: Mordor Intelligence | |||
High Sintering & Deposition CAPEX
Conventional sulfide and oxide ceramics often require furnace cycles above 900 °C, driving equipment outlays that can exceed USD 50 million for a mid-scale line. Penn State’s cold-sinter method lowers process temperature to 150 °C, cutting both energy demand and kiln investment [PSU.EDU]. Early techno-economic assessments place the thin lithium-metal anode cost at USD 4.3 m² against a USD 2.1 m² target, illustrating the economic gap manufacturers seek to bridge. The adoption of VAT photopolymerisation for LLZO geometries further reduces infrastructure needs by printing parts near-net shape, thereby bypassing multiple grinding and polishing steps.
Ceramic Processing Yield Losses
Cracking, lithium volatilisation, and phase impurities diminish output yields, especially for garnet-type LLZO processed between 700 °C and 950 °C. Rapid ultra-high-temperature sintering can raise density to 97%, yet the slightest deviation triggers lithium vacancies that cripple conductivity. Advanced process control, in-situ spectroscopy, and dopant optimization aim to raise the first-pass yield to the 85% threshold, viewed as necessary for gigawatt-hour economics. Success on this front directly impacts cost curves and product availability.
*Our forecasts treat driver/restraint impacts as directional, not additive. The impact forecasts reflect baseline growth, mix effects, and variable interactions.
Segment Analysis
By Material Type: Sulfides Lead Despite Halide Surge
Sulfide ceramics delivered 42.12% solid electrolyte market share in 2025 on the strength of Li₆PS₅Cl conductivities surpassing 1 mS cm⁻¹ and well-understood tape-casting routes. The segment nevertheless faces cost and moisture sensitivity challenges that encourage the parallel development of halide and oxide options. Halide ceramics, although holding a modest base in 2025, are expected to register the fastest 18.74% CAGR through 2031, as their superior oxidative stability simplifies high-voltage cathode pairing. R&D focuses on Cl-, Br-, and F-rich frameworks that maintain high conductivity without hygroscopic degradation.
Manufacturers weigh oxidative tolerance, raw-material availability, and processing yield when selecting chemistries for specific end uses. Oxide garnets, such as Ta-doped LLZO, retain relevance where the risk of moisture ingress is high, despite their higher sintering temperatures. Polymer and glass-ceramic hybrids serve niche flexible electronics but remain secondary volume drivers. The cumulative effect keeps the overall solid electrolyte market size diversified across at least four main chemistries, ensuring supply resilience while fuelling intellectual-property competition.


By Battery Type: EV Dominance Drives Innovation
EV traction packs captured 52.40% of the solid electrolyte market size in 2025 and are expected to expand at an 18.52% CAGR as global automakers schedule solid-state models for late-decade launch windows. The scale requirements of 60-100 kWh vehicle packs compel suppliers to target gigawatt-hour factories, which in turn subsidise cost learning, benefiting smaller segments. Consumer electronics continue to hold a steady share, with smartphones, laptops, and AR devices leading the way, aided by form-factor advantages and stringent safety standards for passenger-carried batteries.
Stationary energy storage, aerospace, medical implants, and industrial IoT collectively compose the remainder, each valuing specific attributes—cycle life, temperature resilience, biocompatibility, or miniaturisation. Technology spill-over from automotive R&D thus accelerates performance gains in these secondary arenas, reinforcing the dominant role of EV programmes in dictating material supply and equipment standards throughout the broader solid electrolyte market.
By Manufacturing Method: Traditional Dominance Faces Disruption
Tape casting and cold press lines accounted for 45.63% of the 2025 volume, reflecting decades of ceramic-substrate expertise that is transferable to solid electrolytes. Yet additive manufacturing will outpace all rivals at a forecast 19.31% CAGR, leveraging 3D printing to create architected ion pathways and integrated current-collector lattices impossible with planar routes. Early vat-photopolymerized LLZO parts exhibit a conductivity of 3.1 × 10⁻⁵ S cm⁻¹, alongside complex geometries, foreshadowing future stackable micro-reactors suitable for high-performance cells.
Hybrid lines that marry printed green bodies with flash sintering are likely to emerge, maintaining capital lightness while reaching density targets. As cost curves descend, additive approaches will capture bespoke and high-precision niches first before challenging mainstream EV volumes. This evolution forces incumbent equipment vendors to retool offerings, broadening industrial optionality and gradually reshaping the solid electrolyte market’s production topology.
By Thickness: Mid-Range Optimisation Prevails
Electrolyte foils with thicknesses between 25 µm and 100 µm held a 44.25% share and generated the highest 17.19% CAGR, as they balance interfacial resistance with mechanical robustness. Below 25 µm, ultra-thin films unlock wearables and chip-level storage but suffer from handling fragility. Above 100 µm, thick sections have lower energy density yet remain indispensable for stationary or defence packs where puncture resistance outweighs size. Equipment suppliers, therefore, refine calendaring and doctor-blade systems to hit tight tolerances in the mid-band where automotive demand clusters. Advances in sputtering and atomic-layer deposition will gradually push economically viable thicknesses downwards, but mid-range products will continue to dominate at least until 2030.
By End-Use Industry: Automotive Leadership Accelerates
Automotive customers accounted for 47.85% of the 2025 volume and are expected to again post the swiftest 18.55% CAGR, anchoring the overall demand curve. They contract directly for sulfide powders, separator foils, and pre-lithiated anodes, locking in multi-year offtakes that secure supplier cash flow. Consumer electronics deliver stable though slower growth as form-factor differentiation trumps cost per kWh metrics. Stationary storage is poised to gain once sodium-based solid electrolytes achieve field validation, potentially easing the tension on lithium demand. Use in aerospace, defense, medical, and industrial machinery remains incremental but strategically important, pushing suppliers toward wide-temperature performance and extended cycle life, capabilities that, once demonstrated, propagate back into mass-market EV cells.

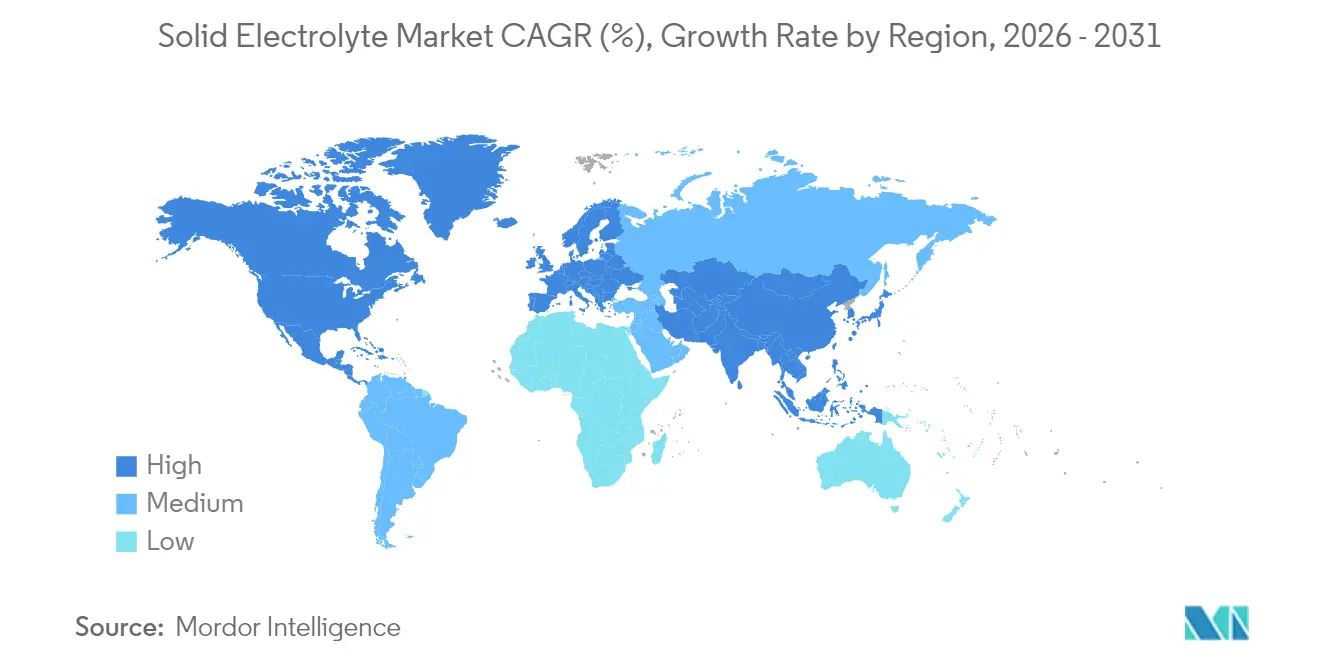
Geography Analysis
The Asia-Pacific region controlled 57.75% of the revenue in 2025 and is forecast to realize an 17.65% CAGR, driven by vertically integrated supply chains, encompassing raw lithium refining, ceramic powder synthesis, cell assembly, and module integration, co-located within China, Japan, and South Korea. CATL, Panasonic, LG Energy Solution, and a suite of material makers coordinate investment pipelines that keep regional cost floors low. Government programmes such as South Korea’s USD 35 billion battery initiative reinforce the region’s trajectory.
North America is accelerating on the back of the U.S. Inflation Reduction Act and Department of Energy grants, promoting the construction of ceramic separator and sulfide powder plants that are eligible for tax credits. Partnerships uniting automakers with university spin-offs focus on closing process-yield gaps and qualifying domestic raw material streams. By 2030, the region could host multiple multi-gigawatt solid electrolyte lines, raising its contribution to global supply from the current single digits toward the low-20% range.
Europe pursues strategic autonomy through the European Battery Regulation and joint-venture factories underwritten by national governments. Volkswagen’s battery arm, PowerCo, licenses solid electrolyte intellectual property to anchor planned German and Swedish plants capable of 40 GWh annual output. The policy emphasis on sustainability, circular economy, and local supply chains makes solid-state chemistry attractive due to its longer service life and improved recyclability. Combined, these moves indicate a rebalancing in which Asia retains primacy but faces credible trans-Atlantic challengers.

Competitive Landscape
The solid electrolyte market remains highly fragmented, with no incumbent exceeding a 15% share of installed capacity. Large cell makers, CATL, Samsung SDI, and LG Energy Solution, utilize capital advantages and automotive ties to scale sulfide and oxide lines in parallel with their liquid-ion businesses. Specialised firms such as QuantumScape, Solid Power, and ProLogium focus on proprietary separators or lamination processes, betting on breakthrough performance to outflank volume players. Start-ups like Ampcera and Pengxu attempt to commercialise halide powders, while equipment suppliers develop flash-sinter kilns and roll-to-roll ALD coaters tailored for solid electrolytes.
A pronounced trend toward vertical integration is evident: Toyota’s alliance with Idemitsu to build a 1,000 t/y lithium sulfide plant exemplifies this drive to internalise critical inputs. At the same time, intellectual property cross-licensing accelerates, as illustrated by Volkswagen’s agreement to deploy QuantumScape’s separator technology, blending start-up innovation with OEM scale. Consolidation is expected once volume ramps begin, with larger firms acquiring pilot-ready ventures to secure engineering teams and patent estates.
Solid Electrolyte Industry Leaders
NEI Corporation
Ohara Inc
Empower Materials
Ampcera Corp
Iconic Material Inc.
- *Disclaimer: Major Players sorted in no particular order

Recent Industry Developments
- July 2025: Solid Power extended its partnership with Ford Motor Company through December 2025 while negotiating a potential USD 50 million Department of Energy grant for solid electrolyte material production
- June 2025: Standard Lithium and Telescope Innovations have developed the DualPure process for lithium sulfide production, operating below 100°C, which significantly reduces manufacturing costs and complexity compared to traditional high-temperature methods.
- May 2025: Gotion High-Tech revealed a 525 Wh/kg solid-state cell entering road-test phase, achieving a 60% gain in ionic conductivity over prior builds.
- March 2025: Toyota and Idemitsu Kosan invested USD 142 million in a 1,000 t y lithium sulfide plant slated for 2027 start-up, strengthening Japan’s domestic supply of key sulfide feedstock.


Global Solid Electrolyte Market Report Scope
A solid-state electrolyte (SSE) is a solid ionic conductor and electron-insulating material, and it is the characteristic component of the solid-state battery. It is useful for applications in electrical energy storage (EES) in substitution of the liquid electrolytes found in particular in a lithium-ion battery. The Solid Electrolyte Market report is segmented by type and application. By type, the market is segmented into ceramic and solid polymer. By application, the market is segmented into thin-film batteries and electric vehicle batteries. The report also covers the market size and forecasts for the solid electrolyte market across major regions or countries. The report offers the market size and forecasts in revenue (USD million) for all the above segments.
| Oxide Ceramics (LLZO, LIPON, Perovskite, LISICON) |
| Sulfide Ceramics (Argyrodite, LGPS family, Thio-LISICON) |
| Phosphate Ceramics (NASICON, LISICON-P) |
| Halide Ceramics |
| Polymer Electrolytes (PEO, PAN, PVDF, PBI, etc.) |
| Composite/Biphasic Electrolytes |
| Glass and Glass-Ceramics (LIPON, LiPON-Si) |
| Others |
| Consumer Electronics Batteries |
| EV Traction Batteries |
| Energy-Storage System Batteries |
| Aerospace and Defence Batteries |
| Medical Implant Batteries |
| Industrial and IoT Sensor Batteries |
| Tape Casting/Cold Pressing |
| Hot Pressing and Sinter-HIP |
| Atomic/Molecular Layer Deposition |
| Solvent/Doctor-Blade Casting |
| Additive Manufacturing/3-D Printing |
| Below 25 µm |
| 25 to 100 µm |
| Above 100 µm |
| Automotive |
| Consumer Electronics |
| Stationary Energy Storage |
| Aerospace and Defence |
| Medical Devices |
| Industrial Equipment |
| North America | United States |
| Canada | |
| Mexico | |
| Europe | Germany |
| United Kingdom | |
| France | |
| Italy | |
| NORDIC Countries | |
| Russia | |
| Rest of Europe | |
| Asia-Pacific | China |
| India | |
| Japan | |
| South Korea | |
| ASEAN Countries | |
| Rest of Asia-Pacific | |
| South America | Brazil |
| Argentina | |
| Rest of South America | |
| Middle East and Africa | Saudi Arabia |
| United Arab Emirates | |
| South Africa | |
| Egypt | |
| Rest of Middle East and Africa |
| By Material Type | Oxide Ceramics (LLZO, LIPON, Perovskite, LISICON) | |
| Sulfide Ceramics (Argyrodite, LGPS family, Thio-LISICON) | ||
| Phosphate Ceramics (NASICON, LISICON-P) | ||
| Halide Ceramics | ||
| Polymer Electrolytes (PEO, PAN, PVDF, PBI, etc.) | ||
| Composite/Biphasic Electrolytes | ||
| Glass and Glass-Ceramics (LIPON, LiPON-Si) | ||
| Others | ||
| By Battery Type | Consumer Electronics Batteries | |
| EV Traction Batteries | ||
| Energy-Storage System Batteries | ||
| Aerospace and Defence Batteries | ||
| Medical Implant Batteries | ||
| Industrial and IoT Sensor Batteries | ||
| By Manufacturing Method | Tape Casting/Cold Pressing | |
| Hot Pressing and Sinter-HIP | ||
| Atomic/Molecular Layer Deposition | ||
| Solvent/Doctor-Blade Casting | ||
| Additive Manufacturing/3-D Printing | ||
| By Thickness | Below 25 µm | |
| 25 to 100 µm | ||
| Above 100 µm | ||
| By End-use Industry | Automotive | |
| Consumer Electronics | ||
| Stationary Energy Storage | ||
| Aerospace and Defence | ||
| Medical Devices | ||
| Industrial Equipment | ||
| By Geography | North America | United States |
| Canada | ||
| Mexico | ||
| Europe | Germany | |
| United Kingdom | ||
| France | ||
| Italy | ||
| NORDIC Countries | ||
| Russia | ||
| Rest of Europe | ||
| Asia-Pacific | China | |
| India | ||
| Japan | ||
| South Korea | ||
| ASEAN Countries | ||
| Rest of Asia-Pacific | ||
| South America | Brazil | |
| Argentina | ||
| Rest of South America | ||
| Middle East and Africa | Saudi Arabia | |
| United Arab Emirates | ||
| South Africa | ||
| Egypt | ||
| Rest of Middle East and Africa | ||


Key Questions Answered in the Report
What is the forecast CAGR for the solid electrolyte market to 2031?
The market is projected to grow at a 15.62% CAGR between 2026 and 2031, increasing from USD 39.18 million in 2026 to USD 80.94 million by 2031.
Which segment dominates solid electrolyte material demand?
Sulfide ceramics led with 42.12% solid electrolyte market share in 2025, though halide ceramics are the fastest-growing material class.
Why are solid electrolytes critical for next-generation EVs?
They enable higher energy densities above 500 Wh/kg, improve thermal safety required by new EU regulations, and support fast-charging without liquid-electrolyte risks.
Which region leads the solid electrolyte market?
Asia-Pacific commanded 57.75% of 2025 revenue owing to integrated supply chains across China, Japan, and South Korea.
How are manufacturers lowering production costs?
Innovations such as cold sintering at 150 °C, vat-photopolymerisation 3D printing, and low-temperature Li₂S synthesis reduce equipment CAPEX and improve yield.
What is the biggest restraint on rapid commercialisation?
High-temperature ceramic processing drives capital costs and yield losses, though emerging low-temperature methods are narrowing the economic gap.
Page last updated on:


