
Electromagnetic Flowmeter Market Size and Share
Market Overview
| Study Period | 2023 - 2031 |
|---|---|
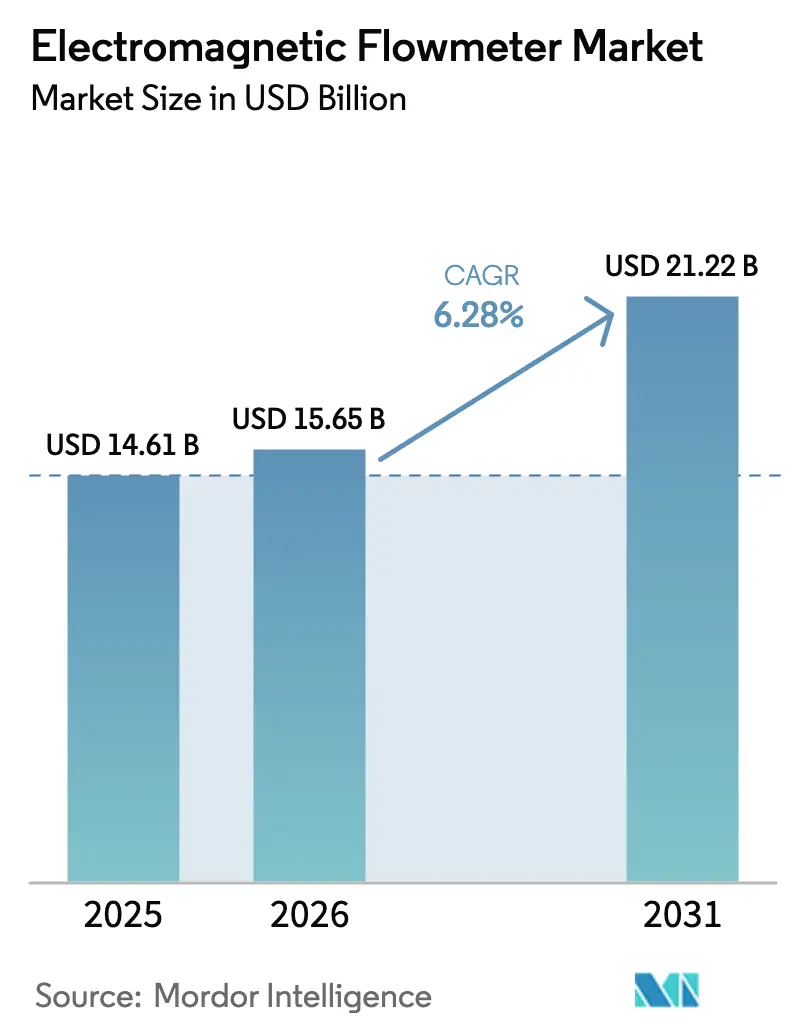
| Market Size (2026) | USD 15.65 Billion |
| Market Size (2031) | USD 21.22 Billion |
| Growth Rate (2026 - 2031) | 6.28 % |
| Fastest Growing Market | Middle East |
| Largest Market | Asia Pacific |
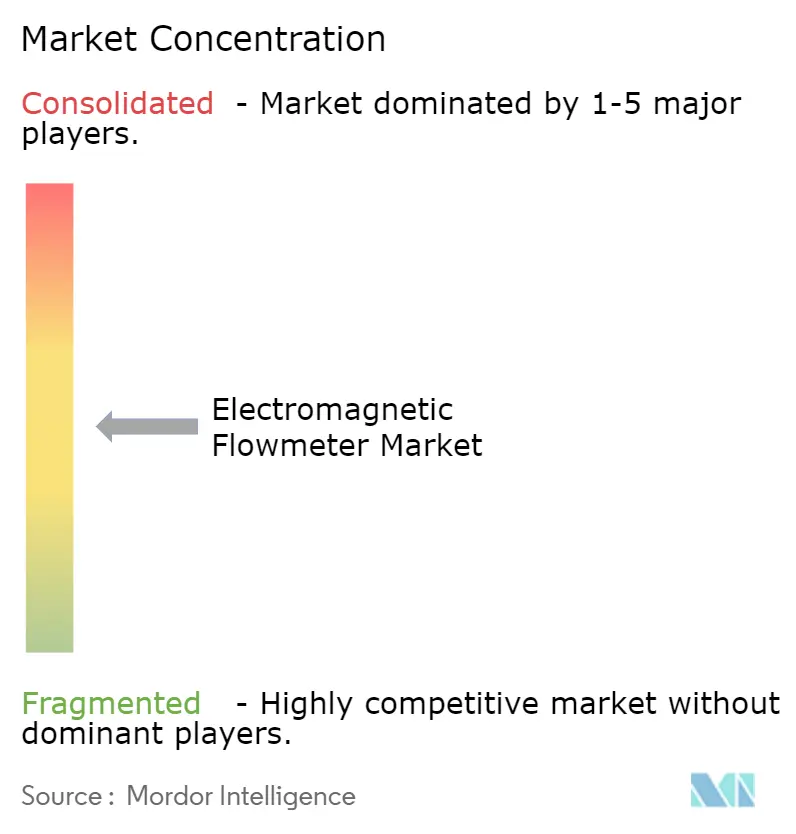
| Market Concentration | Medium |
Major Players *Disclaimer: Major Players sorted in no particular order Image © Mordor Intelligence. Reuse requires attribution under CC BY 4.0. | |
Electromagnetic Flowmeter Market Analysis by Mordor Intelligence
The Electromagnetic Flowmeter Market size was valued at USD 14.61 billion in 2025 and is estimated to grow from USD 15.65 billion in 2026 to reach USD 21.22 billion by 2031, at a CAGR of 6.28% during the forecast period (2026-2031). Growing water-scarcity mitigation projects, the expansion of hydrogen electrolyzers that require sub-1% accuracy, and the shift from reactive to predictive maintenance are reshaping procurement criteria toward data-rich, IIoT-ready instruments. Utilities in North America and Asia-Pacific are accelerating the roll-out of advanced metering infrastructure, while pharmaceutical producers are adopting low-flow devices to comply with FDA Process Analytical Technology requirements. Suppliers that embed on-board diagnostics and protocol interoperability now compete on lifetime value rather than hardware cost. Meanwhile, price volatility in rare-earth magnets and heightened cybersecurity mandates introduce short-term margin and compliance pressures, yet also spur demand for IEC 62443-certified transmitters and Flowmeter-as-a-Service models.
Key Report Takeaways
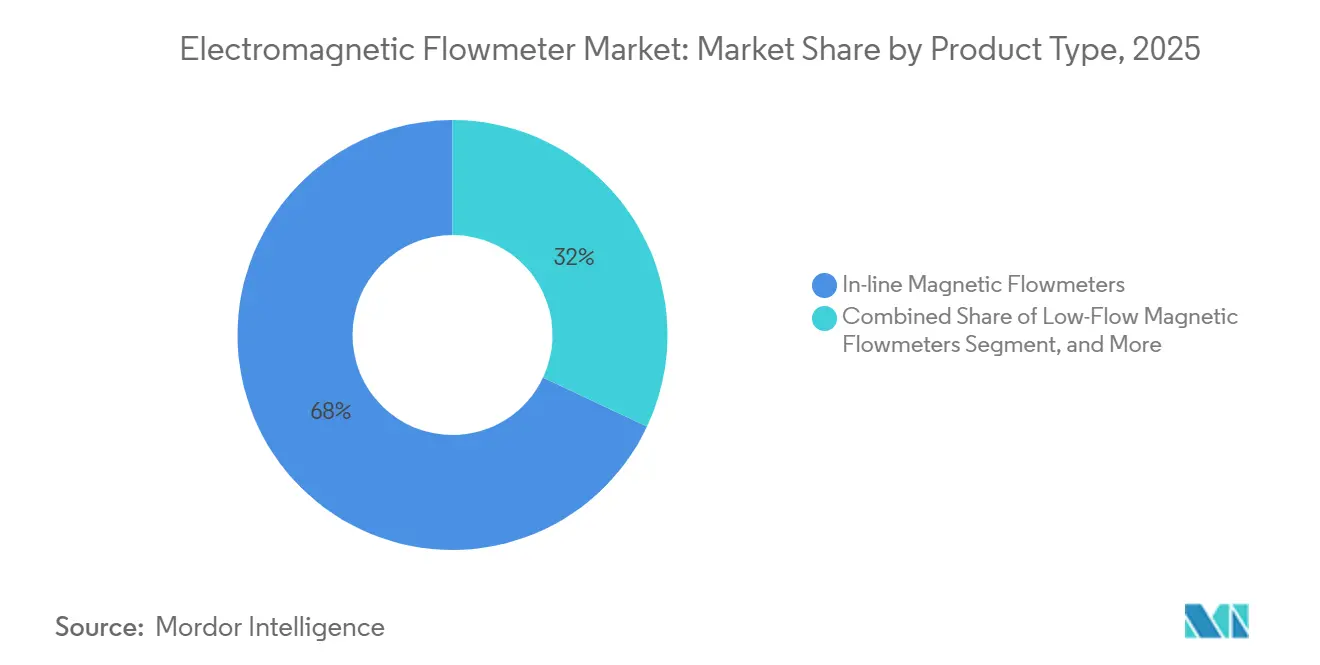
- By product type, in-line devices led with 68% of 2025 revenue, while low-flow variants are forecast to grow at an 8.90% CAGR to 2031.
- By component, flow tubes commanded 46% of the 2025 total, yet sensor and coil assemblies exhibit the fastest growth at 9.30% CAGR through 2031.
- By liner material, PTFE held a 41% share in 2025, whereas ceramic liners are projected to expand at a 9.10% CAGR during the forecast period.
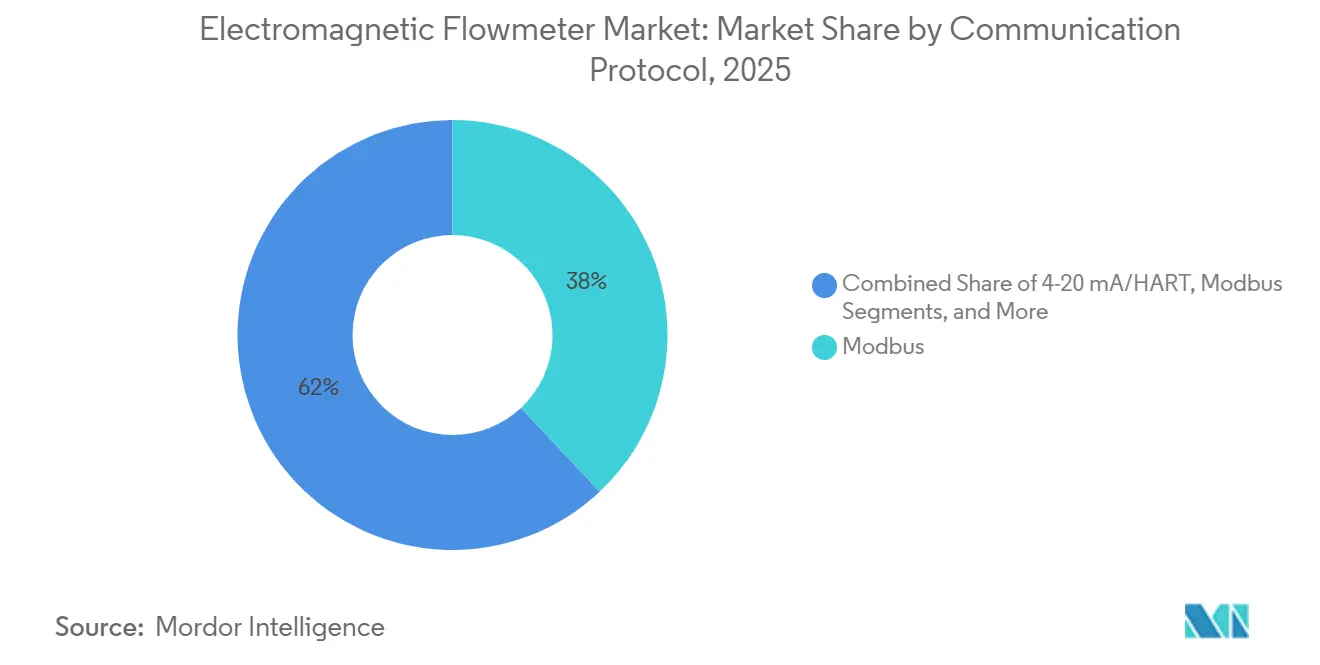
- By communication protocol, the Modbus share stood at 38% in 2025, but Profibus and Profinet are on track for 9.60% CAGR growth to 2031.
- By end-user industry, pharmaceuticals will rise at a 10.20% CAGR to 2031, outpacing the 52% revenue share held by water and wastewater applications in 2025.
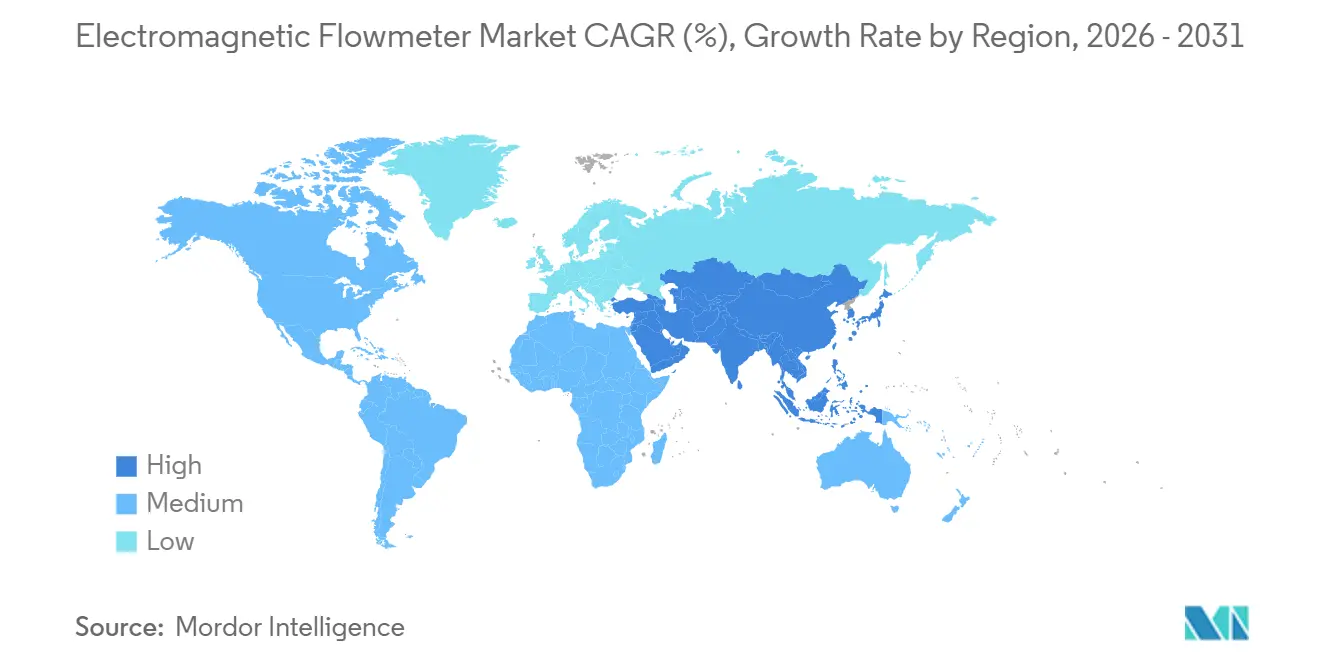
- By geography, Asia-Pacific led with 39% revenue share in 2025, while the Middle East is projected to expand at a 9.50% CAGR through 2031.
Note: Market size and forecast figures in this report are generated using Mordor Intelligence’s proprietary estimation framework, updated with the latest available data and insights as of January 2026.
Market Trends and Insights
Drivers Impact Analysis of Electromagnetic Flowmeter Market*
| Driver | (~) % Impact on CAGR Forecast | Geographic Relevance | Impact Timeline |
|---|---|---|---|
| Rising Water Scarcity Driving Meter Adoption | +1.2% | China, India, Saudi Arabia, UAE | Medium term (2-4 years) |
| Strict Wastewater-Discharge Regulations | +1.0% | United States, European Union | Short term (≤ 2 years) |
| Industrial Digitization and IIoT Integration | +0.9% | North America, Europe, APAC | Medium term (2-4 years) |
| Hydrogen Economy Projects Requiring Precise Electrolyzer Flow Control | +0.7% | Germany, Netherlands, UAE, Saudi Arabia | Long term (≥ 4 years) |
| Adoption in Biopharma Single-Use Systems | +0.4% | United States, Germany, Singapore, India | Medium term (2-4 years) |
| Emergence of Flowmeter-as-a-Service Business Models | +0.3% | United States, Brazil, Southeast Asia | Long term (≥ 4 years) |
| Source: Mordor Intelligence | |||
Rising Water Scarcity Driving Meter Adoption
Municipal utilities are replacing mechanical meters with electromagnetic units to curb non-revenue water losses that average 30% in emerging economies, draining an estimated USD 39 billion in annual revenue. China’s South-to-North Water Diversion transfers demand continuous monitoring at 1,432 points, while India has installed about 2,000 ABB AquaMaster meters across 15 states, cutting leak rates in Bengaluru from 35% to 22% within 18 months. The U.S. EPA WaterSense program now subsidizes instruments that transmit 15-minute data, accelerating a 1.2 million-unit yearly replacement cycle.[1]United States Environmental Protection Agency, “WaterSense Program Updates,” epa.gov Regional funding asymmetry, however, means African utilities allocate less than 4% of capital budgets to metering, compelling vendors to field tiered portfolios that span high-volume, low-cost devices and premium, diagnostics-rich models.
Strict Wastewater-Discharge Regulations
The EU Urban Wastewater Treatment Directive 2024/3019 mandates energy-neutral plants by 2045 and quarterly flow reporting, forcing 18,000 facilities to adopt data-logging electromagnetic meters.[2]European Union, “Directive (EU) 2024/3019 on Urban Wastewater Treatment,” eur-lex.europa.eu U.S. operators face daily fines up to USD 37,500 for breaches under the National Pollutant Discharge Elimination System, while California’s Recycled Water Policy requires custody-transfer-grade flow verification at 412 plants by 2030. China tightened chemical oxygen demand limits to 50 mg/L for textile zones, sparking retrofits across 8,200 sites. These policies together underpin a multiyear replacement cycle from legacy ultrasonic and differential-pressure devices toward high-accuracy magnetic technology compliant with nutrient-removal automation.
Industrial Digitization and IIoT Integration
Manufacturers embed HART 7, Profibus, and Profinet in new meters so platforms such as Emerson AMS and Rockwell FactoryTalk can predict coil-resistance drift, reducing unplanned downtime by 18% in pilot chemical plants. Endress+Hauser’s Heartbeat Technology conducts in-situ verification without process interruption, cutting calibration costs 40% for food processors. Siemens reports that 35% of its 2025 shipments carry edge modules executing local anomaly algorithms, trimming cloud charges 60% and meeting data-sovereignty rules. Deterministic cycle times below 10 ms in discrete factories make real-time Ethernet a procurement prerequisite, reshaping vendor shortlists toward IEC 61158-compliant models.[3]Siemens AG, “Edge-Enabled Process Instrumentation Report 2025,” siemens.com
Hydrogen Economy Projects Requiring Precise Electrolyzer Flow Control
Electrolyzers demand ±0.5% accuracy to sustain 70% stack efficiency and prevent membrane wear. The UAE targets 1.4 million tpa by 2031, with ADNOC specifying Endress+Hauser Proline Promag meters at its 2 GW complex. Saudi Arabia’s NEOM green hydrogen project ordered 650 Siemens units for electrolyte circulation, and Germany budgeted EUR 9 billion for certified DIN EN 17124 instrumentation through 2030. Emerson captured 28% of European projects thanks to 0.055 µS/cm conductivity capability in the Rosemount 8700M, edging out Coriolis alternatives by trimming parasitic power 1.2% in independent trials.
Restraints Impact Analysis of Electromagnetic Flowmeter Market*
| Restraint | (~) % Impact on CAGR Forecast | Geographic Relevance | Impact Timeline |
|---|---|---|---|
| Limited Ability to Measure Non-Conductive Fluids | -0.6% | Global hydrocarbon sectors | Long term (≥ 4 years) |
| High Initial Installation Costs in Brownfield Plants | -0.5% | United States, Europe | Short term (≤ 2 years) |
| Rare-Earth Magnet Supply-Chain Price Volatility | -0.3% | Global | Medium term (2-4 years) |
| Cybersecurity Concerns in Connected Devices | -0.1% | North America, Europe, APAC | Medium term (2-4 years) |
| Source: Mordor Intelligence | |||
Limited Ability to Measure Non-Conductive Fluids
Field tests show accuracy drifts beyond ±2% when levels fall below 0.1 µS/cm for 72 hours, prompting biopharma producers to switch to optical sensors in single-use assemblies .
High Initial Installation Costs in Brownfield Plants
A 2025 survey found 58% of U.S. chemical sites cite capital cost as the main barrier even though lifecycle analyses show 25% savings over differential-pressure transmitters .
*Our forecasts treat driver/restraint impacts as directional, not additive. The impact forecasts reflect baseline growth, mix effects, and variable interactions.
Electromagnetic Flowmeter Market Segment Analysis
By Product Type:
Low-Flow Devices Gain on Biopharma GrowthThe in-line segment commanded 68% of 2025 revenue, anchored by municipal water works, chemical processing lines, and food applications that need full-bore accuracy within ±0.5%, a capability vital to safeguarding billing integrity under ISO 4064. Yet the low-flow class is forecast to grow at 8.90% CAGR to 2031, energized by single-use bioreactors and small-scale electrolyzer skids. Leading pharmaceutical sites report validation cost savings of 40% after adopting Endress+Hauser Promag W 800, which runs in-situ diagnostics without halting production.
Insertion meters address large-diameter pipelines above 24 inches where full-bore models become uneconomical. Utilities in Arizona and São Paulo prefer the probes to stretch capital budgets, accepting ±2% uncertainty on non-revenue flows. Meanwhile, ultrasonic clamp-on devices vie for the same space but lose ground when aeration or solids load rise, preserving insertion share in slurry services. ABB’s modular ProcessMaster FEP620 underpins this convergence: interchangeable liners and electrodes cut spare-parts inventory 35% for turnkey contractors managing multi-site roll-outs.



By Component:
Sensor and Coil Assemblies Steer InnovationFlow tubes retained 46% of 2025 component revenue; however, commoditization from low-cost Asian vendors is eroding OEM margins, prompting value migration to sensor and coil electronics that will post a 9.30% CAGR through 2031. Emerson’s AMS device manager now tracks 1.2 million coils worldwide, flagging resistance drift before failures and trimming unscheduled outages 18%.
Transmitters claimed 28% of the 2025 tally and enjoy firmware life extensions beyond a decade. Edge-computing modules introduced by Siemens in 2024 execute anomaly analytics locally, easing data-sovereignty compliance while slicing cloud charges 60%. Hybrid PTFE-ceramic liners pioneered by Endress+Hauser extend slurry service to five years without the full cost of all-ceramic tubes, evidencing component evolution toward modular, condition-aware subsystems.
By Liner Material:
Ceramic Advances in Abrasive DutyPTFE accounted for 41% of 2025 sales due to chemical inertness and FDA compliance in food and pharma lines. Ceramic, though priced 50% higher, will grow 9.10% CAGR as mining and minerals firms demand Mohs-9 hardness to combat particle erosion. Rubber liners stay popular in cost-sensitive water jobs but cap out at 70 °C, excluding them from hot-water recirculation and steam condensate circuits.
PFA, with superior flex-crack resistance, retains a niche below 8% share owing to long lead times. Hybrid solutions now emerge: PTFE bases reinforced by ceramic rings at high-wear zones lower total ownership 30%, a benefit valuable to copper-concentrate pipelines facing dwindling ore grades and escalating energy bills.
By Communication Protocol:
Ethernet Fieldbus Gains TractionModbus occupied 38% of installed nodes in 2025 for its backward compatibility, yet Profibus and Profinet are on track for 9.60% CAGR, propelled by automotive paint shops and semiconductor fabs that stipulate sub-10 ms determinism. 4-20 mA with HART overlay still serves basic water jobs, but its single-variable bandwidth impedes FDA electronic-record mandates in pharma batches, accelerating Ethernet adoption.
Wireless penetration remains thin: only 8% of 2025 shipments included WirelessHART or ISA100.11a radios, presenting white space in offshore rigs where conduit installation costs exceed USD 120 per foot.
By End-User Industry:
Pharmaceuticals Outpace Municipal DominancePharmaceutical installations will expand at a market-leading 10.20% CAGR through 2031 as single-use, continuous lines spread under FDA FSMA Rule 204 traceability. Water and wastewater held 52% of 2025 revenue but now temper to 5.8% growth because easy leakage wins are fading. Oil and gas stays limited to produced water and amine circulation because hydrocarbons lack conductivity, while chemicals capture 12% share through sulfuric and caustic duty.
Power generation clocks in at 9% share yet slows to 4.2% CAGR amid coal retirements. Mining secures 7% thanks to ceramic-lined solutions in copper and coal slurries. The relative margin landscape is stark: pharmaceutical projects yield roughly 40% gross margin compared with 18% for municipal bids, explaining strategic shifts by multinational suppliers toward higher-value verticals.
Geography Analysis
APAC Electromagnetic Flowmeter Market
Asia-Pacific contributed 39% of 2025 revenues, driven by China’s diversion canals and India’s district-meter projects that collectively lifted annual unit shipments to 58,000. Yet the region’s price pressure compresses gross margins to 18%, compelling global brands to differentiate on calibration services and cybersecurity credentials. Japan and South Korea showcase advanced deployments: K-Water’s 42,000 smart meters cut non-revenue water to 7%, the world’s lowest.
Europe, Middle East and North America Electromagnetic Flowmeter Market
The Middle East records the fastest regional growth, catalyzed by the UAE and Saudi hydrogen roadmaps and desalination capacity scaling to 11.5 million m³/day. High ambient temperatures demand IP68, NEMA 4X enclosures, increasing material cost but raising technical barriers against low-spec imports. Europe's market share is buoyed by a EUR 9 billion hydrogen budget and wastewater directives mandating real-time flow logging at 18,000 sites. North America followed, anchored by EPA WaterSense rebates.
South America and Africa Electromagnetic Flowmeter Market
South America and Africa jointly face fiscal constraints that elongate replacement cycles to 15 years, yet Brazil’s Sabesp and South Africa’s Rand Water still deploy electromagnetic units to combat leakage topping 40%. Suppliers target hybrid financing and subscription models to penetrate these budget-limited geographies.

Regulatory Landscape
Regulation for electromagnetic flowmeters is shaped by legal metrology and process-reporting mandates that govern accuracy, verification, and data integrity in billing, environmental reporting, and regulated industrial measurement. For water applications, OIML R 49-1:2024 provides updated metrological and technical requirements for water meters that affect type-approval and verification regimes, while ISO 20456:2017 provides international guidance for electromagnetic flowmeters measuring conductive liquids in closed conduits. In the United Kingdom, the Measuring Instruments Regulations 2016 set requirements around durability and electromagnetic immunity for regulated instruments, reinforcing demand for documented performance in compliant designs.
Policy and regulator actions are increasingly linking metering to traceable reporting and auditable electronic records. In June 2024, the US EPA authorized Endress+Hauser Proline Promass Coriolis flow meters as an alternative measurement protocol for specified flow meter requirements under fuel-related regulations, reflecting a formal pathway for instrument acceptance when documentation and performance criteria are met. In March 2026, Directive (EU) 2026/706 updated the EU Measuring Instruments Directive (2014/32/EU), adding momentum to smart metering integration requirements that can affect transmitter functionality, communications, and verification workflows across utility and industrial deployments.
Value Chain Analysis
The electromagnetic flowmeter value chain starts with raw materials and precision components, including stainless steel or alloy meter bodies, copper coils, permanent magnets, liners (PTFE, PFA, rubber, ceramic), and electrodes (such as 316L stainless steel, tantalum, and platinum-iridium) selected for corrosion and wear resistance. These inputs feed specialized manufacturing steps such as coil winding, liner application and bonding, electrode assembly, and calibration against flow standards, followed by transmitter firmware loading and communications validation (HART, Modbus, Profibus/Profinet, and emerging Ethernet-APL options). Quality assurance and traceability remain central in regulated end uses, so calibration capabilities and test infrastructure tend to matter in global OEM selection.
Downstream, OEMs sell through direct accounts, system integrators and EPCs, instrument distributors, and utility-focused channels, often bundled with installation, commissioning, verification, and lifecycle services. Supply chain strategies are increasingly localized to reduce lead times and support regional projects, while modular platforms can reduce spare-parts complexity for multi-site rollouts. The July 2026 ABB delivery contract for ProcessMaster FEP600 electromagnetic flowmeters with Ethernet-APL connectivity for the Zhoushan Green Petrochemical Base upgrade in China highlights how digital-protocol readiness is pulled through the chain, from end-user modernization programs to OEM manufacturing, integration, and service capabilities.
Competitive Landscape
The electromagnetic flowmeter market is moderately consolidated: ABB, Emerson, Endress+Hauser, Siemens, and Yokogawa together hold about 45% share. Interoperability trumps hardware specs; Rockwell’s tie-in with Endress+Hauser embeds real-time diagnostics inside FactoryTalk, a differentiator valued by contract pharma producers. Niche players such as KROHNE and McCrometer capture custody-transfer and insertion-probe niches that majors overlook.
Technology roadmaps converge on predictive maintenance. Emerson’s AMS ecosystem watches 1.2 million coils, while Siemens packs edge analytics that cut cloud data fees 60%. Patent filings focus on dual-frequency excitation to overcome VFD noise. Cost headwinds persist: neodymium volatility, stainless surcharges, and the USD 800 incremental cost of IEC 62443 compliance. Flowmeter-as-a-Service propositions and single-use biopharma sensors represent frontier opportunities that could alter share rankings over the next five years.
Electromagnetic Flowmeter Industry Leaders
ABB Ltd
Azbil Corporation
Endress+Hausar AG
Emerson Electric Corporation
Toshiba Corporation
- *Disclaimer: Major Players sorted in no particular order
Electromagnetic Flowmeter Market Companies Covered in this Report
- ABB Ltd.
- Azbil Corporation
- Badger Meter, Inc.
- Bürkert Fluid Control Systems
- Danaher Corporation (Hach)
- Emerson Electric Co.
- Endress+Hauser Group Services AG
- Fuji Electric Co., Ltd.
- GEA Group Aktiengesellschaft
- Honeywell International Inc.
- KROHNE Messtechnik GmbH
- McCrometer, Inc.
- Omega Engineering Inc. (Spectris plc)
- Schneider Electric SE
- Siemens Aktiengesellschaft
- SICK AG
- Spirax-Sarco Engineering plc (M&M International)
- Toshiba Corporation
- Yokogawa Electric Corporation

Market Opportunities and Future Outlook
The opportunity is shifting from basic measurement toward data-rich, interoperability-first flow instrumentation in water, wastewater, and process industries, where buyers are specifying diagnostics, verification tools, and real-time communications to support predictive maintenance and auditable reporting. Product moves in 2026 illustrate this direction: KROHNE released the IFC 400 signal converter with MPO technology to stabilize measurements under gas entrainment or solids, and added automated partial proof testing features aligned with SIL2/3 safety workflows. This supports upgrades in plants where electromagnetic meters for conductive fluids are kept, but performance is challenged by aeration, solids loading, or high uptime requirements.
Materials and manufacturing localization also create near-term whitespace for suppliers that can de-risk compliance and delivery. Emerson launched PEX-lined magnetic flow meters in June 2026, offering a PFAS-free alternative to fluoropolymer liners for customers looking for material changes without giving up magnetic measurement in abrasive or wastewater duties. On the supply side, Endress+Hauser expanded US manufacturing and supply chain capabilities to a 650,000 square-foot facility footprint (February 2026) and began construction on a campus expansion in Pearland, Texas (July 2026), which supports shorter delivery timelines for regional energy and industrial demand. In parallel, Yokogawa's February 2024 agreement to acquire Adept Fluidyne in India points to continued investment in local manufacturing bases, strengthening competitive positioning in high-volume APAC procurement where lead time, service coverage, and total installed-cost control shape vendor selection.
Recent Industry Developments in Electromagnetic Flowmeter Market
- July 2026: ABB announced the delivery of ProcessMaster FEP600 electromagnetic flowmeters with Ethernet-APL connectivity for Zhejiang Petroleum & Chemical at the Zhoushan Green Petrochemical Base in China. The project links electromagnetic flow measurement to high-speed, two-wire Ethernet architectures used for digitalization programs in large process complexes, strengthening the role of protocol-ready magmeters in brownfield upgrades.
- June 2026: ABB upgraded the ProcessMaster FER620 electromagnetic flowmeter sensor with a fully welded, hermetically sealed design targeted at buriable and low-flow water applications. The design direction supports utility deployments that prioritize ingress protection, long service life, and reduced maintenance interventions in distribution networks where access is constrained.
- October 2024: The European Union adopted the Urban Wastewater Treatment Directive 2024/3019, adding requirements such as quarterly flow reporting and a long-term push toward energy-neutral plants by 2045. This policy raises demand for data-logging electromagnetic flowmeters and accelerates replacement cycles at municipal and industrial wastewater facilities that need to document flows for compliance.


Electromagnetic Flowmeter Market Report Scope and Research Methodology
Market Definition and Coverage
This market tracks revenues earned from electromagnetic flowmeters and their core system components that measure flow of conductive liquids in industrial and municipal settings. It covers both new installations and replacements, counted at the point of sale to end users or via distribution channels.
Scope exclusions: We exclude non-magnetic flow technologies and related services such as installation labor, calibration contracts, and broader automation software bundles.
Segments Covered in This Report
- By Product Type
- In-line Magnetic Flowmeters
- Low-Flow Magnetic Flowmeters
- Insertion Magnetic Flowmeters
- By Component
- Flow Tube
- Transmitter
- Sensor and Coil Assembly
- Liner
- By Liner Material
- PTFE
- PFA
- Rubber
- Ceramic
- By Communication Protocol
- 4-20 mA / HART
- Modbus
- Profibus / Profinet
- Foundation Fieldbus
- By End-User Industry
- Water and Wastewater
- Oil and Gas
- Chemicals and Petrochemicals
- Power Generation
- Metals and Mining
- Food and Beverages
- Pulp and Paper
- Pharmaceuticals
- By Geography
- North America
- United States
- Canada
- Mexico
- South America
- Brazil
- Argentina
- Rest of South America
- Europe
- Germany
- United Kingdom
- France
- Italy
- Rest of Europe
- Asia-Pacific
- China
- Japan
- India
- South Korea
- Rest of Asia-Pacific
- Middle East
- Saudi Arabia
- United Arab Emirates
- Rest of Middle East
- Africa
- South Africa
- Egypt
- Rest of Africa
- North America
Data Sources, Market Sizing, and Validation
Desk Research
Desk research was used to set the base structure for the market model and to sanity-check assumptions before interviewing industry participants. We mainly looked for signals on where electromagnetic flowmeters are specified and purchased, and how demand shifts across water projects and process industries.
Public and official sources reviewed included materials such as United States EPA water and wastewater guidance, United States Geological Survey water-use statistics, Eurostat industrial production indicators, United Nations Comtrade trade flows for instruments and parts, and standards and technical notes from bodies such as IEC and ISO. We also checked annual reports, investor presentations, product catalogs, and trusted press coverage to understand pricing bands, replacement cycles, and where the meters fit best in end-use applications. Where paid subscriptions were available, they were used only to speed up company financial capture and patent lookups, followed by manual checks. The sources listed here are illustrative and not exhaustive, and many other references were used for data collection, validation, and clarification.
Primary Interviews and Surveys
Primary work focused on validating the demand drivers and the pricing and mix assumptions that typically move the model. This included how often flowmeters are replaced in water plants versus process sites, and what share of demand comes from retrofit projects. We spoke with a balanced set of stakeholders, including manufacturers, channel partners, EPC and system integrators, and end-user maintenance and instrumentation teams across APAC, EMEA, and the Americas. The conversations helped narrow ranges and also confirmed what was excluded from scope.
Distribution of primary research fieldwork respondents
| Company type | Respondent position | Region |
|---|---|---|
| Top tier: 28% | CXOs: 12% | APAC: 43% |
| Mid tier: 57% | Functional/Unit leaders: 29% | EMEA: 30% |
| Smaller Players: 15% | Managers: 59% | Americas: 27% |
Market-Sizing & Forecasting
Sizing starts from a top-down build that reconstructs the addressable demand pool from end-use activity signals, and then converts that demand into value using realistic adoption and price logic. For electromagnetic flowmeters, we anchored demand to indicators such as municipal water and wastewater capital spending, industrial output in chemical and metals processing, announced plant additions and refurbishments, and the installed base replacement rhythm in utilities and continuous-process plants.
Once these demand pools were formed, the value was derived using a weighted average selling price range by meter type and typical diameter bands (kept at a practical level). We then adjusted for the expected share of smart communication protocols and component mix that influence pricing. To corroborate totals, we also ran selective bottom-up approximations using a roll-up of sampled supplier revenues and channel checks. Where public financials were not separable, we applied allocation using product mix cues from catalogs and inputs gathered during interviews.
For forecasting, we used scenario analysis so the model can reflect different project timing and replacement-rate outcomes. The scenarios were linked to variables such as inflation-adjusted capex expectations, lead-time trends, and procurement intensity signaled by tenders. We then rechecked the scenario outputs with interview feedback before finalizing the outlook.
Data Validation & Update Cycle
Validation is done by comparing the model outputs with independent market signals, then running variance checks at region, end-user, and product-type levels. When an outlier shows up, we revisit the input trail, recheck currency timing and price bands, and then reconnect with selected respondents if the mismatch cannot be explained by documented drivers.
Before sign-off, the work goes through multiple analyst reviews to ensure assumptions are consistent across sections and that the math is traceable. The report is refreshed annually, and interim updates are triggered when major policy, trade, or project developments materially change demand expectations. Right before delivery, a final pass is completed so clients receive the most up-to-date view that can be replicated from the stated steps.
Mordor Intelligence's Electromagnetic Flowmeter Market Estimate Compared With Other Published Estimates
Published market values for electromagnetic flowmeters often vary because each publisher draws the boundary in a slightly different way, then uses different demand signals and pricing logic to convert units into dollars. Differences also come from the year chosen as the base, the treatment of components versus complete meters, and how often assumptions are refreshed.
Installed base replacement cues in water and wastewater facilities, together with end-user capex checks and protocol-driven ASP banding, are the evidence points that keep Mordor Intelligence's estimate tied to the equipment-only revenue pool rather than broader measurement and automation spending. When other figures are smaller, it is commonly linked to counting only the meter body and excluding transmitters and liners, or restricting the scope to a narrower set of applications. When other figures are larger, it is often because adjacent flow technologies or service revenues get blended into the total, or currency conversion timing is not aligned to the pricing year.
Benchmark comparison
| Source | Market Size | Gaps in Research Methodology |
|---|---|---|
| Mordor Intelligence | USD 15.65 B (2026) | |
| Global Consultancy A | USD 2.44 B (2025) | The estimate appears to stay closer to a meter-only definition and may exclude key system components, and it also uses an earlier base year that can understate recent ASP uplift from digital protocol adoption. |
| Industry Publisher B | USD 2.30 B (2024) | This figure is likely based on a narrower pricing scope and earlier-year conversion, and it may not fully reflect replacement-driven demand in utilities and heavy process industries in its value build. |
The spread across the three numbers is mainly explained by what is counted inside the product boundary and how pricing is updated across the base year. By keeping the demand build traceable to utility capex and industrial activity, and then cross-checking with supplier and channel feedback, the resulting value is easier to reproduce and pressure-test when assumptions change.


Key Questions Answered in the Report
How large is the electromagnetic flowmeter market in 2026?
The electromagnetic flowmeter market size reached USD 15.65 billion in 2026.
What CAGR is expected for electromagnetic flowmeters through 2031?
A 6.28% CAGR is projected between 2026 and 2031.
Which region is growing fastest for electromagnetic flowmeters?
The Middle East is forecast to grow at 9.50% CAGR due to hydrogen and desalination investments.
Why are low-flow magnetic meters gaining traction?
Biopharma single-use systems and hydrogen electrolyzers need high-accuracy, small-diameter measurements.
What is the main restraint on wider magnetic flowmeter adoption?
Inability to measure non-conductive fluids limits use in hydrocarbon custody transfer tasks.
How are suppliers addressing cybersecurity?
Leading vendors now ship IEC 62443-compliant transmitters with encrypted firmware and role-based access.
Page last updated on:





