Electrochromic Materials Market Size and Share
Market Overview
| Study Period | 2021 - 2031 |
|---|---|
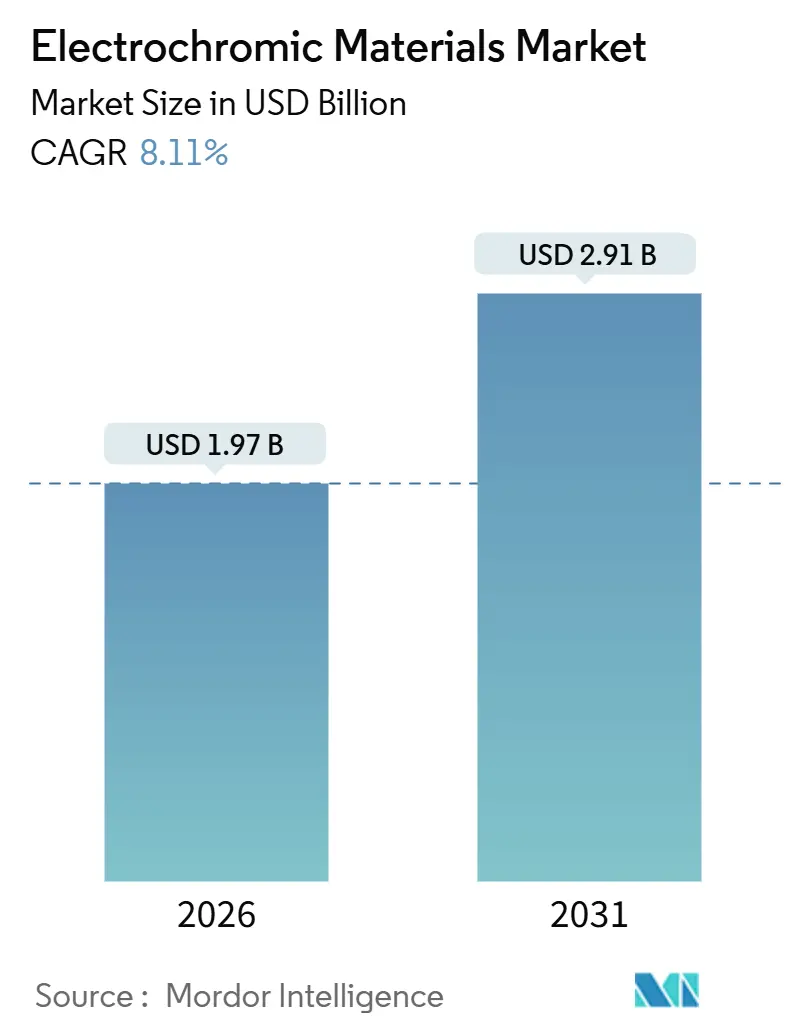
| Market Size (2026) | USD 1.97 Billion |
| Market Size (2031) | USD 2.91 Billion |
| Growth Rate (2026 - 2031) | 8.11% CAGR |
| Fastest Growing Market | Asia Pacific |
| Largest Market | Europe |
| Market Concentration | Medium |
Major Players *Disclaimer: Major Players sorted in no particular order Image © Mordor Intelligence. Reuse requires attribution under CC BY 4.0. | |
Electrochromic Materials Market Analysis by Mordor Intelligence
The Electrochromic Materials Market size is estimated at USD 1.97 billion in 2026, and is expected to reach USD 2.91 billion by 2031, at a CAGR of 8.11% during the forecast period (2026-2031). Stricter building-energy codes in Europe and the United States, expanding tariff barriers that favor local production, and fast-switching automotive and retail-display use cases are refocusing procurement from optional sustainability upgrades to mandated performance components. Buildings now specify dynamic glazing to meet carbon-reduction targets at lower lifetime cost than mechanical shading, while automakers integrate electrochromic sunroofs and instrument clusters to offset battery-induced weight and heat loads. Supply-chain reshoring continues as Section 301 duties on Chinese glass and the EU Critical Raw Materials Act drive additional North American and European capacity. Despite high upfront prices, payback periods keep shortening as electricity tariffs rise and financing programs reward near-zero-energy envelopes. Competitive intensity stays moderate, with the top five suppliers controlling roughly 60% of revenue but facing new polymer-film challengers that promise roll-to-roll cost parity.
Key Report Takeaways
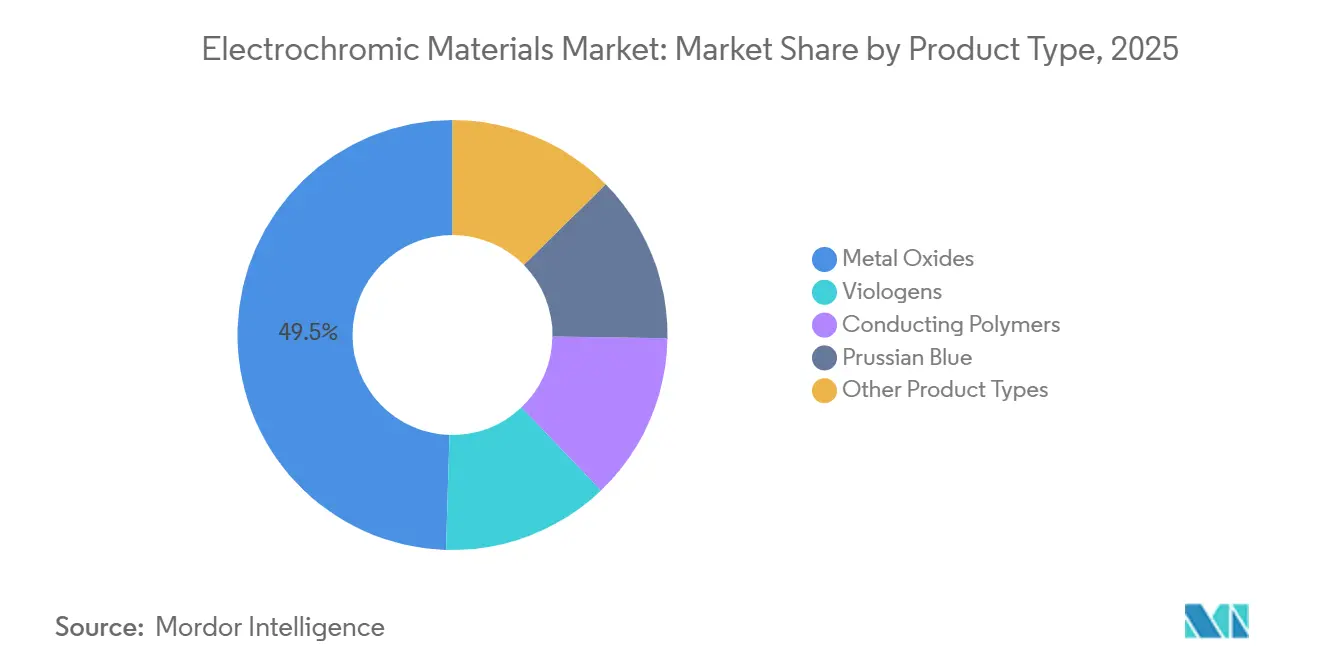
- By product type, metal oxides led with a 49.51% electrochromic materials market share in 2025; conducting polymers are advancing at a 10.71% CAGR to 2031.
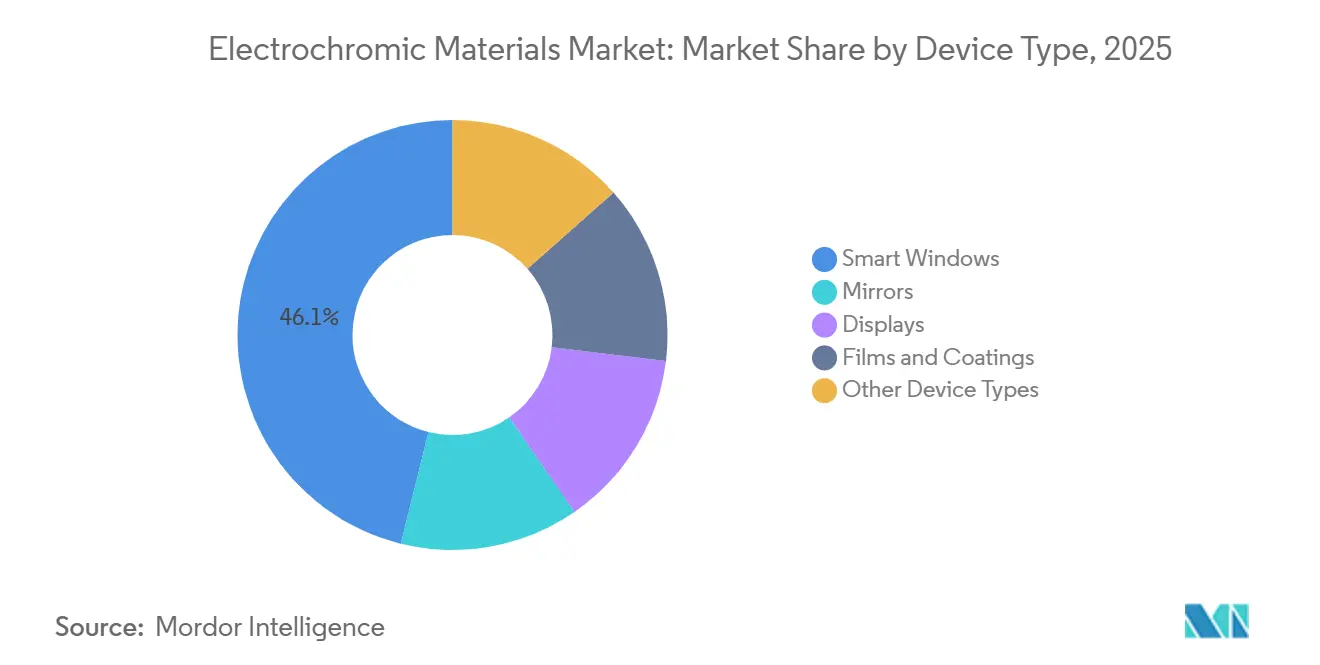
- By device type, smart windows captured 46.13% of revenue in 2025, while displays are set to grow at an 11.12% CAGR through 2031.
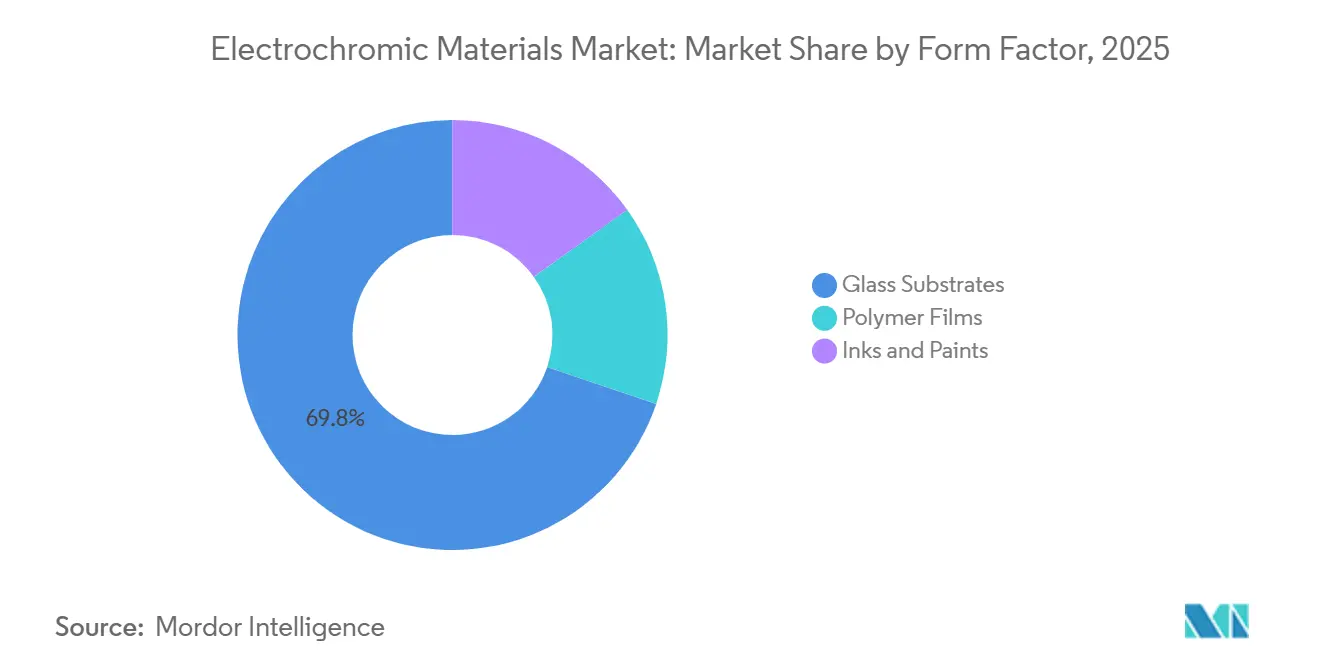
- By form factor, glass substrates accounted for 69.80% of the electrochromic materials market size in 2025; polymer films will expand at a 10.98% CAGR between 2026-2031.
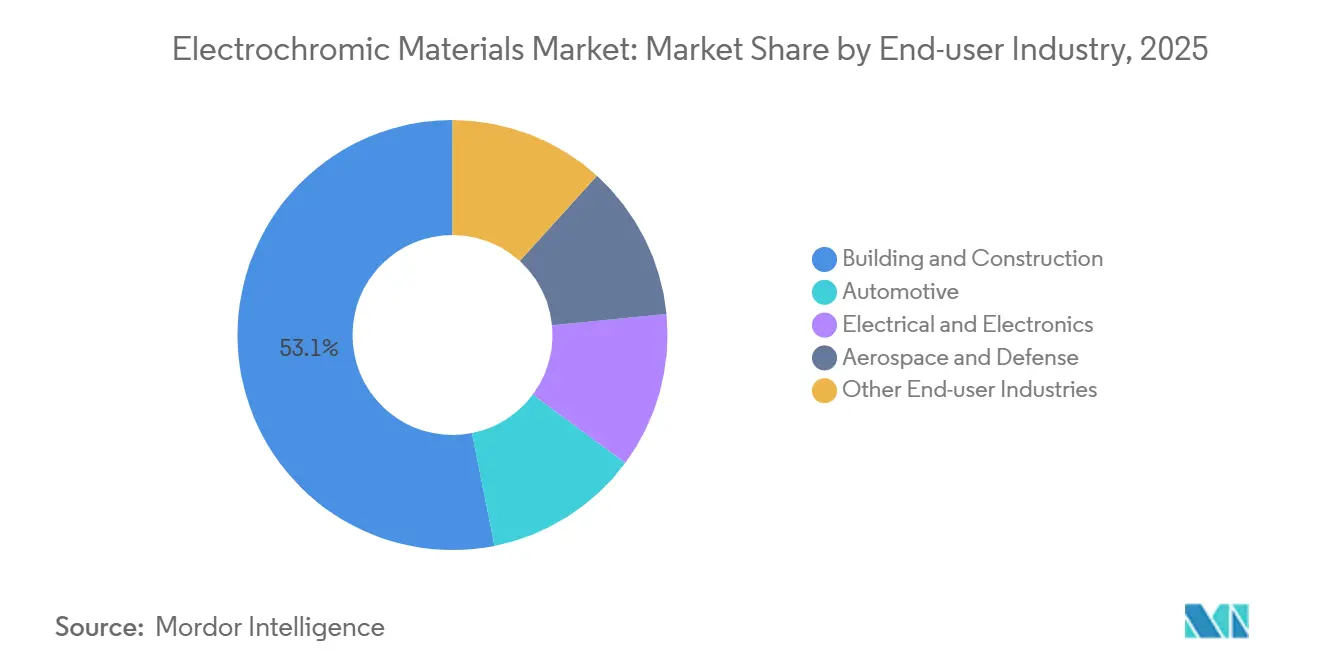
- By end-user industry, building and construction held 53.12% revenue in 2025 and is forecast to post a 10.88% CAGR, outpacing automotive.
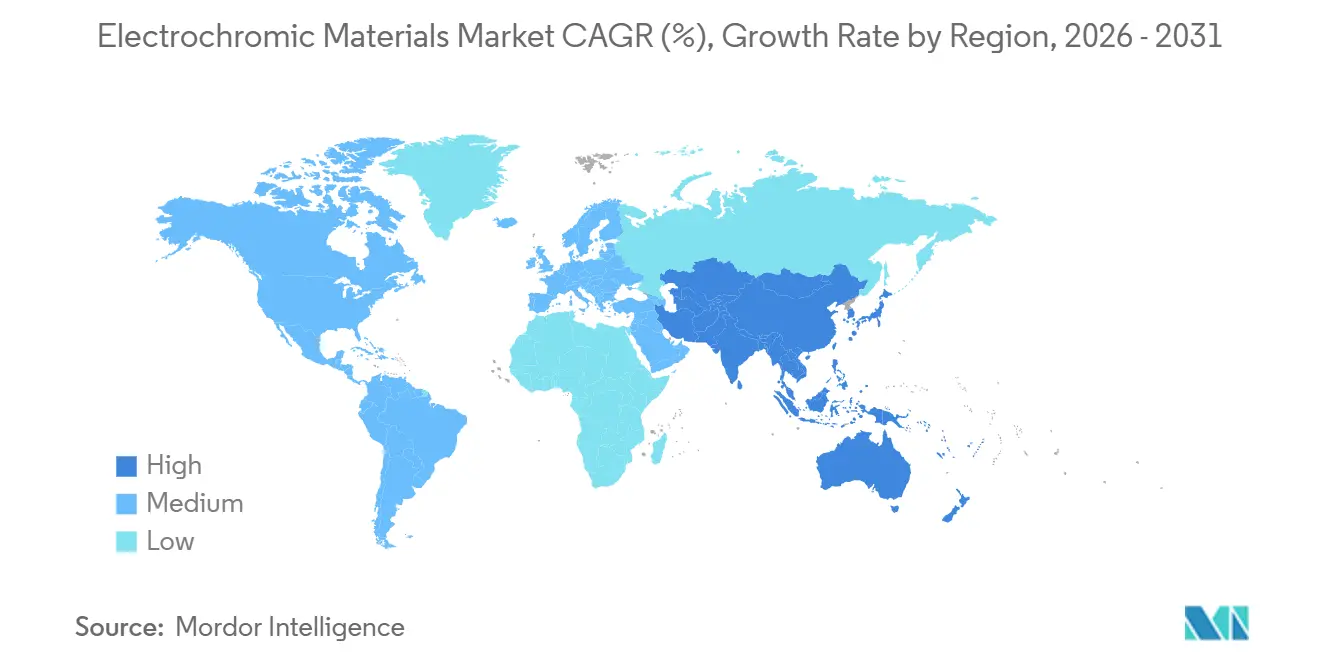
- By geography, Europe retained 33.45% regional revenue in 2025; Asia-Pacific is projected to register the fastest 11.12% CAGR through 2031.
Note: Market size and forecast figures in this report are generated using Mordor Intelligence’s proprietary estimation framework, updated with the latest available data and insights as of January 2026.
Global Electrochromic Materials Market Trends and Insights
Drivers Impact Analysis*
| Driver | (~) % Impact on CAGR Forecast | Geographic Relevance | Impact Timeline |
|---|---|---|---|
| Energy-Efficiency Regulations Accelerating Smart-Window Adoption | +2.1% | Europe, North America, APAC (China, Japan, South Korea) | Medium term (2-4 years) |
| Automotive Demand for Auto-Dimming Mirrors and Panoramic Sunroofs | +1.8% | Global, with concentration in North America, Europe, China | Short term (≤ 2 years) |
| Aerospace Window Upgrades for Weight and Glare Reduction | +0.9% | Global, led by North America (Boeing, Airbus supply chains) | Long term (≥ 4 years) |
| Self-Powered Electrochromic Smart Windows Integrating Solar Harvesters | +1.4% | APAC core, spill-over to Europe and North America | Long term (≥ 4 years) |
| Tariff-Driven Reshoring of Electrochromic Material Supply Chains | +1.2% | North America, Europe | Medium term (2-4 years) |
| Source: Mordor Intelligence | |||
Energy-Efficiency Regulations Accelerating Smart-Window Adoption
European, U.S. and U.K. building codes now recognize dynamic glazing as a primary compliance route rather than a discretionary feature, compressing payback periods and triggering large scale retrofits[1]U.S. Environmental Protection Agency, “ENERGY STAR Version 7.0 Final Criteria,” energystar.gov . France’s RE2020 grants a 15% carbon-offset credit for façades that reduce HVAC runtime by 20%, a threshold met by electrochromic glass. ENERGY STAR Version 7.0 created a “dynamic performance” tier that only electrochromic or suspended-particle devices satisfy. NREL field work in 2024 showed that Phoenix office retrofits cut simple payback to 7.2 years as peak-demand charges escalated. The UK Future Homes Standard mandates 75% lower operational carbon from 2025, indirectly boosting electrochromics as insulation-only packages become insufficient.
Automotive Demand for Auto-Dimming Mirrors and Panoramic Sunroofs
Premium electric vehicles now rely on film-based electrochromic roofs that switch in under 90 seconds, addressing legacy glare complaints. GM’s 2024 patent for zone-specific windshields illustrates the shift toward segmented dimming that preserves driver sightlines while shading passengers. Large-format prototypes exceeding 1.5 m × 1.6 m confirm manufacturing scale-up, yet penetration in mass-market trims remains below 5% because the USD 800-1,200 adder competes with battery-range upgrades.
Aerospace Window Upgrades for Weight and Glare Reduction
Boeing 787 operational data indicate a 15 kg per aircraft weight drop versus mechanical shades, trimming annual fuel cost by USD 3,000 at 2024 prices. Airlines credit electrochromic dimming for fewer premium-cabin glare complaints on trans-Pacific sectors. FAA endurance certification of 50,000 switching cycles narrows the supplier field, reinforcing high-margin contracts for qualified vendors.
Self-Powered Electrochromic Smart Windows Integrating Solar Harvesters
Perovskite-assisted stacks demonstrated 12.3% conversion efficiency while preserving 45% visible-light transmission, eliminating external wiring for retrofit sites. NREL’s luminescent concentrator prototype generated 18 mW/m², delivering two switch cycles per hour without grid power. Thermoelectric layers scavenging temperature gradients broaden applicability for off-grid cabins and heritage buildings.
Restraints Impact Analysis*
| Restraint | (~) % Impact on CAGR Forecast | Geographic Relevance | Impact Timeline |
|---|---|---|---|
| High Unit Cost Versus Conventional Coated Glass | -1.5% | Global | Short term (≤ 2 years) |
| Cycling-Stability and Durability Challenges | -0.8% | Global, particularly harsh-climate regions (Middle East, Nordic countries) | Medium term (2-4 years) |
| Digital Rear-View Mirrors Eroding Automotive EC Mirror Demand | -0.6% | North America, Europe, China | Short term (≤ 2 years) |
| Source: Mordor Intelligence | |||
High Unit Cost Versus Conventional Coated Glass
Installed prices averaging USD 85 per ft² dwarf the USD 22 per ft² baseline for low-e double glazing, limiting adoption to Class-A and high-end residential projects[2]Lawrence Berkeley National Laboratory, “Window Technology Cost Benchmark,” windows.lbl.gov . Only 12% of U.S. developers specify electrochromics for speculative offices, though build-to-suit projects accept higher capex when operational savings accrue to tenants. Bankruptcy of View Inc. in 2024 highlights the cash-burn risk of volume-driven cost reduction without scale.
Cycling-Stability and Durability Challenges
W₃O₈ systems typically retain 80% modulation after 50,000-100,000 cycles, equating to 7-14 years of daily switching, below envelope life expectations. Conducting-polymer films degrade faster under 85 °C/85% RH stress, losing 40% contrast after 10,000 cycles. Hermetic edge-seals and dual-cathode stacks push lab performance beyond 200,000 cycles, yet absence of an IEC durability standard complicates warranty underwriting.
*Our forecasts treat driver/restraint impacts as directional, not additive. The impact forecasts reflect baseline growth, mix effects, and variable interactions.
Segment Analysis
By Product Type: Metal Oxides Hold Scale, Polymers Rewrite Flexibility Rules
Metal oxides maintained 49.51% revenue in 2025, anchored by tungsten-trioxide’s 60-70% light-modulation range and more than 50,000 cycle life. Hierarchically porous W₃O₈ films achieved sub-5 s switching, opening dashboard opportunities previously reserved for faster chemistries. Conducting polymers grow at 10.71% as OEMs and retrofitters adopt roll-to-roll PEDOT and PANI layers that cut manufacturing costs 40% and bend onto curved pillars. However, additional ultraviolet-barrier coatings add USD 8-12 per m², tempering the near-term price narrative. Viologen and Prussian blue niches persist where less than 1 s response or anti-glare performance outweighs lifetime concerns.
The electrochromic materials market now evaluates substrate flexibility as rigorously as contrast ratio. Ricoh’s curved A-pillar film shows how PEDOT overcomes brittle-oxide cracking, whereas tungsten systems excel in 30-year façade warranties. Hybrid composites under investigation promise oxide-level durability with polymer-style processability, yet synthesis complexity and licensing hurdles stall large-scale launch.


By Device Type: Smart Windows Dominate, Displays Accelerate
Smart windows captured 46.13% revenue in 2025 on the back of multi-thousand-square-meter building orders, but displays will post an 11.12% CAGR thanks to sunlight-readable automotive clusters and outdoor retail signage. Electrochromic displays maintain 10:1 contrast under 100,000 lux, outperforming transflective LCDs, and crown-labeled prototypes transition fully in less than 2s. Mirrors lose share as camera-based rear vision scales, yet after-market commercial vehicles still specify auto-dimming glass. Retrofit films and coatings furnish a new volume tier as Polytronix cuts install costs to USD 40 ft². Multi-function panels that fuse dimming with edge LEDs blur device boundaries and raise content per square meter.
By Form Factor: Glass Remains Anchor, Polymer Films Unlock Retrofit
Glass substrates held 69.80% in 2025, backed by proven 92% performance retention after 10 years in Arizona field tests. They dominate new-build façades where 25-year warranties outweigh weight penalties. Polymer films, expanding at 10.98% CAGR, slash unit mass to 1.2 kg/m² and enable self-adhesive retrofits. Municipal pilots such as New York City’s 50,000 m² curtain-wall trial registered a 22% peak-cooling cut without façade disruption. Ink-based coatings service low-cycle military and anti-counterfeiting uses where USD 5 per m² material costs trump longevity.
Glass and film paths will coexist: rigid units for premium curtain walls, lightweight laminates for automotive roofs, and peel-and-stick sheets for existing towers constrained by tenant occupancy or historical façades.
By End-user Industry: Buildings Drive Volume, Automotive Re-balances Priorities
Building and construction commanded 53.12% revenue in 2025 and will pace ahead at a 10.88% CAGR as Germany’s KfW subsidy, France’s embodied-carbon cap and EU public-building renovation mandates converge. A Frankfurt office retrofit cut cooling energy 28% and secured a 12% rent premium. The electrochromic materials market size in commercial real estate is consequently projected to maintain moderate growth through 2031. Automotive’s share slips as EV makers allocate budget to battery range and camera mirrors encroach on legacy dimming units. Aerospace and defense demand is also growing due to FAA certification barriers and USD 1,200 per-window pricing. Electronics and wearables stay experimental but receive persistent R&D as foldable devices require bend-tolerant displays.
Geography Analysis
Europe delivered 33.45% revenue in 2025, propelled by the EPBD recast that obliges 3% annual public building retrofits and Germany’s KfW Efficiency House 40 incentives. France’s RE2020 and the U.K.’s Future Homes Standard push electrochromic uptake by setting carbon ceilings that static glazing cannot breach. Nordic passive-house adopters exploit EC glass for winter gain and summer shading, while Italy and Spain lag as lower electricity tariffs prolong payback.
Asia-Pacific, advancing at an 11.12% CAGR, benefits from China’s import-substitution push under Made in China 2025, Japanese OEM integration of electrochromic roofs, and South Korean display giants turning to sunlight-readable e-paper. India’s 2024 Energy Conservation Building Code offers a voluntary dynamic-glazing credit, setting the groundwork for future demand. Singapore’s Green Mark Platinum pathway rewards 20% HVAC energy cuts, fostering early municipal adoption.
In North America, California’s Title 24 updates and New York’s Local Law 97 impose carbon penalties that favor dynamic glazing, while federal net-zero mandates create a captive demand pipeline through 2030. Section 301 tariffs increase landed costs for Chinese imports by 25%, spurring Saint-Gobain’s USD 45 million Minnesota expansion. Canada’s Pan-Canadian Framework backs provincial code harmonization, with British Columbia and Ontario specifying EC glass in public infrastructure. Latin American and Middle-East uptake remains project-driven in prestige office towers and megacity developments like Saudi Arabia’s NEOM.

Competitive Landscape
The top five players - Gentex, Saint-Gobain, ChromoGenics, View and Guardian - control roughly 60-65% of revenue, placing the electrochromic materials market at a moderate-concentration midpoint. Gentex holds more than 90% of auto-dimming mirrors due to vertically integrated gel-electrolyte lines that compress cost curves unreachable for newcomers. Saint-Gobain leverages a 3,000-fabricator network to integrate EC units into curtain walls, yet faces retrofit-film competition from Crown Electrokinetics, whose DynamicTint targets the existing stock underserved by panel suppliers. Cost-leadership strategies emerge in Asia as KIBING’s 1.2 million m² Shandong line undercuts import pricing.
Innovation emphasis shifts from 70% contrast plateaus to form-factor versatility and self-powered stacks. Halio (Saint-Gobain-backed) patents dual-ion layers to drive sub-3-minute switching, while EControl-Glas integrates edge LEDs for dual-use façades. Supply-security moves accelerate: AGC’s 2024 tungsten contract with a Portuguese mine hedges against China’s 85% refining dominance. Industry consolidation is likely as polymer-film capex and warranty-backed durability trials exceed the financial reach of niche entrants unless they partner with automotive or building-materials majors.
Electrochromic Materials Industry Leaders
GENTEX CORPORATION
Saint-Gobain
View, Inc.
ChromoGenics
Guardian Glass
- *Disclaimer: Major Players sorted in no particular order


Recent Industry Developments
- March 2025: Miru Smart Technologies introduced a large electrochromic sunroof window device for the automotive industry. The company's dynamic electrochromic technology, known as "eWindows," was integrated with Argotec optically clear polymer film to create a compound-curved electrochromic window prototype measuring 1.5 m x 1.6 m.
- January 2025: GENTEX CORPORATION introduced its next-generation film-based electrochromic sunroofs and sun visors at CES 2025. With annual shipments exceeding 50 million dimmable devices, the company aimed to enhance manufacturing efficiency for automotive applications.


Research Methodology Framework and Report Scope
Market Definitions and Key Coverage
Our study defines the electrochromic materials market as commercial volumes of inorganic oxides, conducting polymers, and hybrid multilayer stacks that reversibly shift visible or infrared transmittance under a low voltage. These chemistries reach end users mainly as coated or laminated glazing, films, or cell assemblies fitted in smart windows, auto-dimming mirrors, sunroofs, information displays, and wearable screens.
Scope exclusion: Suspended-particle, PDLC, photo- or thermo-chromic devices are outside this value assessment.
Segmentation Overview
- By Product Type
- Metal Oxides
- Viologens
- Conducting Polymers
- Prussian Blue
- Other Product Types
- By Device Type
- Smart Windows
- Mirrors
- Displays
- Films and Coatings
- Other Device Types
- By Form Factor
- Glass Substrates
- Polymer Films
- Inks and Paints
- By End-user Industry
- Building and Construction
- Automotive
- Electrical and Electronics
- Aerospace and Defense
- Other End-user Industries
- By Geography
- Asia-Pacific
- China
- India
- Japan
- South Korea
- ASEAN Countries
- Rest of Asia-Pacific
- North America
- United States
- Canada
- Mexico
- Europe
- Germany
- United Kingdom
- Italy
- France
- NORDIC Countries
- Rest of Europe
- South America
- Brazil
- Argentina
- Rest of South America
- Middle-East and Africa
- Saudi Arabia
- South Africa
- Rest of Middle-East and Africa
- Asia-Pacific
Detailed Research Methodology and Data Validation
Primary Research
Mordor analysts interviewed smart-glass producers, Tier-1 automotive glazing suppliers, façade consultants, and materials scientists across North America, Europe, and Asia. These dialogues refined penetration rates, ASP dilution curves, and regulation timing that plain desk work cannot uncover.
Desk Research
We pulled baseline trade and production quantities from Eurostat PRODCOM, USITC HS-3824 export lines, China Customs, and OICA vehicle builds, then paired them with IEA building-floor additions for application pools. Patent families from Questel, peer-reviewed journals on switching efficiency, and price clues buried in corporate 10-Ks fed core variables. D&B Hoovers and Dow Jones Factiva helped us align company revenue splits. The list is illustrative; many other references supported data collection.
A second sweep verified policy catalysts, such as EU Energy Performance of Buildings Directive revisions, and checked historical average-selling-price (ASP) patterns across key regions to lock our starting year.
Market-Sizing & Forecasting
We rebuilt a top-down demand pool by multiplying installed building glazing area and yearly vehicle production by expert-validated electrochromic penetration, then converted volumes into value through shipment-weighted ASPs. Supplier roll-ups and channel checks served as a bottom-up flank before results were aligned in one 'top-down and bottom-up' loop. Key model drivers include green-building completions, luxury-vehicle output, glazing surface per car, ASP erosion, and incentive strength. A multivariate regression on these drivers underpins the 2025-2030 outlook, with scenario cushions where regulation remains fluid.
Data Validation & Update Cycle
Our team runs variance checks against trade flows and independent price benchmarks, followed by two-layer peer review. Reports refresh every twelve months, and interim updates trigger when policy, capacity, or M&A shifts move the baseline.
Why Mordor's Electrochromic Materials Baseline Commands Reliable Decisions
Published estimates diverge because firms mix technology baskets, apply steep price-drop assumptions, or skip primary verification.
For example, other publishers place the 2025 market between USD 2.30 billion and USD 1.71 billion. Mordor's disciplined scope control and renewable data loops narrow that spread.
Benchmark comparison
| Market Size | Anonymized source | Primary gap driver |
|---|---|---|
| USD 1.98 B (2025) | Mordor Intelligence | |
| USD 2.30 B (2025) | Global Consultancy A | Bundles SPD and other chromic glass; aggressive ASP decline |
| USD 1.71 B (2024) | Industry Journal B | Limited geography and minimal primary validation |
These contrasts show that our measured variable treatment and transparent assumption book give decision-makers a balanced, traceable baseline.


Key Questions Answered in the Report
How large is the electrochromic materials market?
It reached USD 1.97 billion in 2026 and is forecast to attain USD 2.91 billion by 2031.
What is the expected CAGR for electrochromic materials through 2031?
The market is projected to grow at an 8.11% CAGR between 2026 and 2031.
Which end-user segment drives most revenue?
Building and construction leads with 53.12% revenue in 2025 and the fastest 10.88% CAGR outlook.
Why are polymer-film electrochromics gaining ground?
Roll-to-roll processing cuts manufacturing cost and weight, enabling retrofit films and curved automotive applications.
Page last updated on:


