
Electric Vehicle Battery Market Size and Share
Market Overview
| Study Period | 2021 - 2031 |
|---|---|
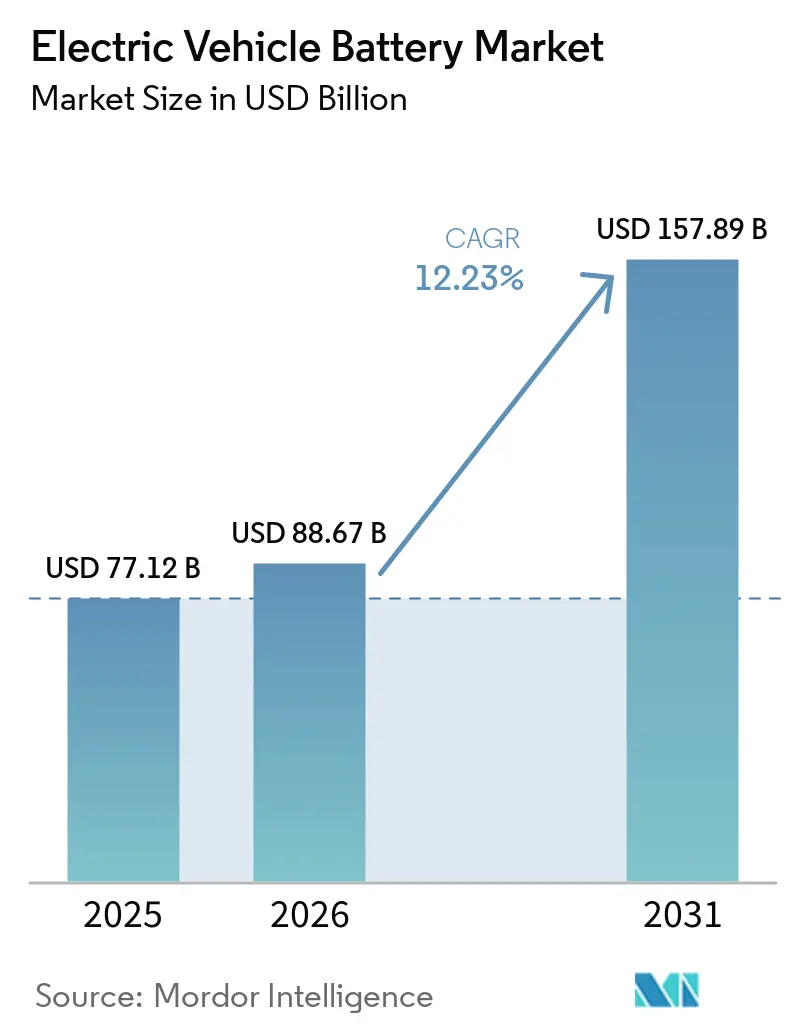
| Market Size (2026) | USD 88.67 Billion |
| Market Size (2031) | USD 157.89 Billion |
| Growth Rate (2026 - 2031) | 12.23 % |
| Fastest Growing Market | Asia-Pacific |
| Largest Market | Asia-Pacific |
| Market Concentration | Medium |
Major Players *Disclaimer: Major Players sorted in no particular order Image © Mordor Intelligence. Reuse requires attribution under CC BY 4.0. | |
Electric Vehicle Battery Market Analysis by Mordor Intelligence
The Electric Vehicle Battery Market size was valued at USD 77.12 billion in 2025 and is estimated to grow from USD 88.67 billion in 2026 to reach USD 157.89 billion by 2031, at a CAGR of 12.23% during the forecast period (2026-2031). The electric vehicle battery market is supported by lower lithium-ion pack costs, policy-led vehicle demand, and investment in cell manufacturing. Binding zero-emission requirements give vehicle makers clearer procurement schedules and give cell producers more visibility on future demand. Stationary energy storage also absorbs some cell output, which can support utilization when automotive demand is uneven. China remains central to the electric vehicle battery market because it combines high vehicle demand, material processing, cell manufacturing, and established supply chains. Mineral processing concentration, trade restrictions, and unused capacity in Western factories remain important constraints on pricing and investment decisions[1]International Energy Agency, “Global EV Outlook 2026,” International Energy Agency, iea.org.
Key Report Takeaways
- By battery type, lithium-ion batteries held 93.8% of the electric vehicle battery market share in 2025, while solid-state batteries are forecast to grow at a 37.9% CAGR through 2031.
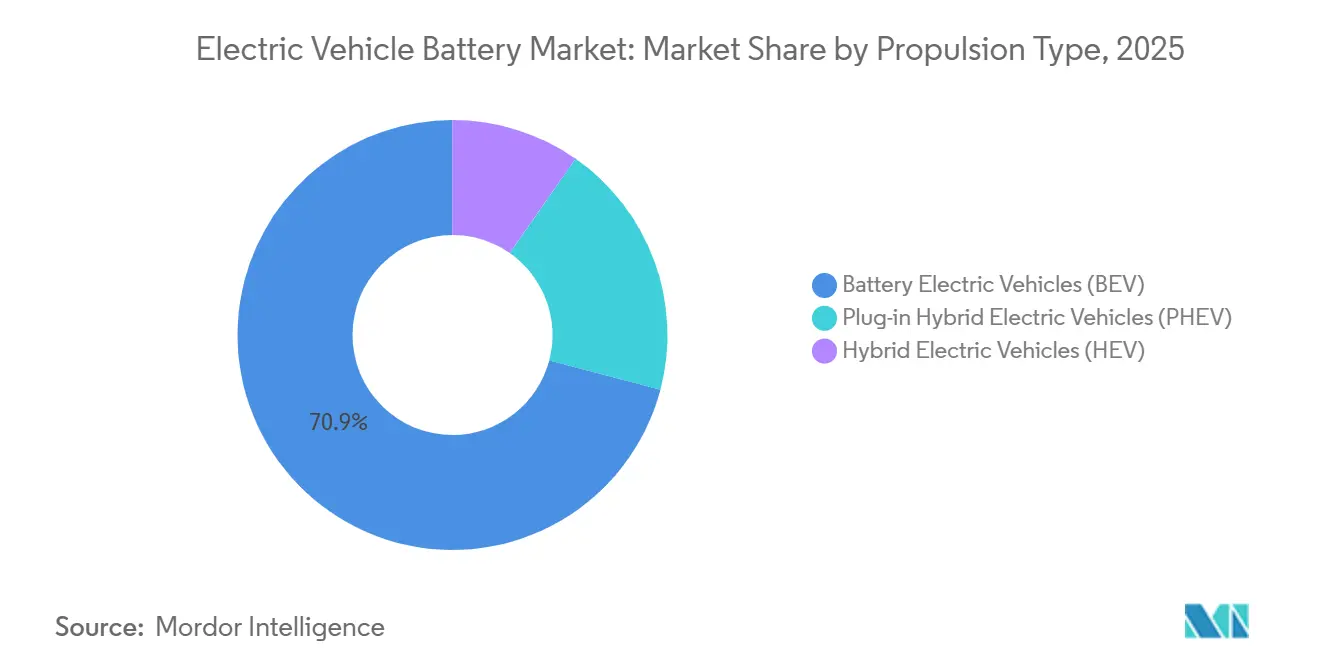
- By propulsion type, battery electric vehicles held 70.9% of electric vehicle battery demand in 2025, while plug-in hybrid electric vehicles are forecast to grow at a 13.7% CAGR through 2031.
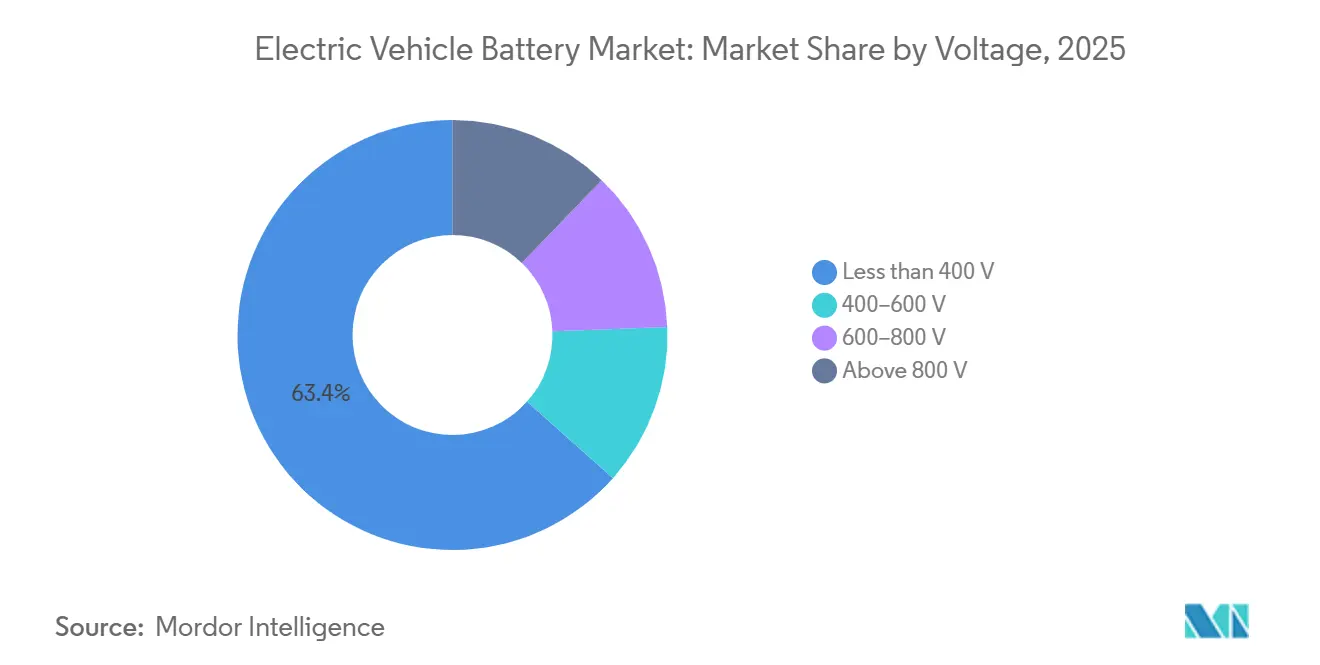
- By voltage, the less-than-400V category held 63.4% of electric vehicle battery demand in 2025, while the 600-800V category is forecast to grow at a 12.8% CAGR through 2031.
- By geography, Asia-Pacific held 63.7% of electric vehicle battery demand in 2025 and is forecast to grow at a 15.2% CAGR through 2031.
Note: Market size and forecast figures in this report are generated using Mordor Intelligence’s proprietary estimation framework, updated with the latest available data and insights as of January 2026.
Global Electric Vehicle Battery Market Trends and Insights
Drivers Impact Analysis*
| Driver | (~) % Impact on CAGR Forecast | Geographic Relevance | Impact Timeline |
|---|---|---|---|
| Falling Battery-Pack Costs and EV Price Parity | +3.00% | Global, strongest in China, spill-over to Europe and Southeast Asia | Short term (≤ 2 years) |
| Supportive Zero-Emission Mandates and Industrial Policy | +2.50% | EU, China, select US states; early gains in India and ASEAN | Medium term (2–4 years) |
| 800-Volt Platforms and High-Rate Charging | +1.40% | Global; concentrated in Germany, South Korea, China, and the US | Medium term (2–4 years) |
| Commercial-Fleet Electrification | +1.80% | China dominant; strong secondary pull from EU, North America, and India | Medium term (2–4 years) |
| OEM Vertical Integration and Localized Gigafactories | +1.00% | Germany, South Korea, China; early gains in North America | Long term (≥ 4 years) |
| Battery-Storage Pull on Cell Manufacturing Capacity | +1.20% | Global; concentrated in China; growing in the US, EU, and Australia | Short to medium term |
| Source: Mordor Intelligence | |||
Falling Battery Pack Costs and EV Price Parity
Lithium-ion pack prices fell 8% to USD 108/kWh in 2025, supported by manufacturing overcapacity, competition, and greater use of lithium iron phosphate chemistry. Battery electric vehicle packs averaged USD 99/kWh in 2025, which narrowed the vehicle purchase-cost gap with internal combustion models. The electric vehicle battery market benefits when lower pack prices allow manufacturers to offer more competitively priced vehicles. Lithium carbonate prices increased from their mid-2025 low, but lower-cost production and chemistry choices continued to shape pack economics. Automakers with fixed-price cell contracts signed in 2022 can face higher input costs than competitors buying cells under more flexible arrangements. The U.S. Department of Energy has set a USD 75/kWh pack-level target for 2030, which would further improve purchase-price competitiveness if achieved[2]U.S. Department of Energy, “Electric Vehicle Batteries,” Vehicle Technologies Office, energy.gov.
Supportive Zero-Emission Mandates and Industrial Policy
Zero-emission rules create a clearer demand base for the electric vehicle battery market in major vehicle-producing regions. The European Union requires zero-emission new car and van sales from 2035 under its Fit for 55 framework. China uses vehicle quota requirements within original equipment manufacturer compliance systems, which supports continued electrification activity. The U.S. Inflation Reduction Act provides eligible producers with USD 35/kWh for cells and USD 10/kWh for modules through its Section 45X credit. The European Union Battery Regulation adds requirements covering carbon footprint declarations, recycled content, and supply-chain due diligence. These obligations favor producers that can document material origins and manage compliance across integrated operations[3]International Energy Agency, “Global EV Outlook 2026,” International Energy Agency, iea.org.
800V Platforms and High-Rate Charging
The move from 400V to 800V systems is changing battery pack design, thermal controls, and semiconductor sourcing. The 600-800V category is the fastest-growing voltage range in the electric vehicle battery market, with a projected 12.8% CAGR through 2031. BMW's Gen6 system and Renault's RGEV medium 2.0 platform illustrate the shift toward higher-voltage vehicle platforms. Higher-voltage designs require closer control of cell impedance and production consistency. This requirement can favor larger producers that have established process controls and can meet tighter manufacturing tolerances.
Commercial Fleet Electrification
Commercial trucks and buses require battery packs with three to five times the energy content of many passenger-car packs. This creates a material demand pull on cell capacity even when fleet vehicle volumes are lower in the electric vehicle battery market. China's new-energy commercial vehicle penetration reached 25% in October 2025, leaving room for further fleet electrification. Depot charging gives bus and delivery fleet operators more predictable charging and battery-use patterns. These patterns can favor lithium iron phosphate chemistry because of its safety characteristics and cycle life. Growing fleet demand may redirect cell procurement from high-nickel chemistries toward lithium iron phosphate cells, affecting cobalt and nickel demand through 2031.
Restraints Impact Analysis*
| Restraint | (~) % Impact on CAGR Forecast | Geographic Relevance | Impact Timeline |
|---|---|---|---|
| Critical-Mineral Concentration and Trade Friction | -1.80% | Global; most acute in EU and North America with limited domestic refining | Medium term (2–4 years) |
| Gigafactory Underutilization and Margin Compression | -1.50% | North America and Europe most exposed; China secondary effect via price wars | Short to medium term |
| Safety, Recall, and Thermal-Management Exposure | -0.70% | Global; concentrated recall exposure in US (NHTSA-regulated markets) and China (SAMR) | Short term (≤ 2 years) |
| Solid-State Scale-Up and Sodium-Ion Transition Uncertainty | -0.80% | Global; Japan and South Korea most directly exposed via OEM investment timelines | Long term (≥ 4 years) |
| Source: Mordor Intelligence | |||
Critical Mineral Concentration and Trade Friction
China controls 60-90% of refining capacity across lithium, cobalt, and rare earth elements, creating a concentrated processing base. Graphite and rare earth refining each exceed 90% concentration, which makes alternative supply development difficult in the near term. The leading refiner's processing share rose from 70% in 2023 to 72% in 2025 despite diversification efforts. The Democratic Republic of Congo suspended cobalt exports in February 2025 and later set a 96,000-ton annual quota for 2026. The reported price increase encouraged interest in lithium iron phosphate chemistry, which does not require cobalt. However, lower energy density limits lithium iron phosphate use in some premium, long-range, and commercial applications[4]International Energy Agency, “Global Critical Minerals Outlook 2026,” International Energy Agency, iea.org.
Gigafactory Underutilization and Margin Compression
North American battery capacity represented 1.9 times demand in 2025, while European capacity represented 2.2 times demand. Underused factories in the electric vehicle battery market carry their fixed costs even when production volumes are lower than planned. Korean producers LG Energy Solution, SK On, and Samsung SDI operated close to 50% utilization during the first half of 2025. Lower utilization encourages producers to direct cells toward stationary storage applications when automotive orders are insufficient. This response can support factory activity, though automotive battery margins can remain more attractive than storage margins. Fraunhofer ISI expects 54-75% of announced European battery capacity to be realized by 2030, indicating that project cancellations may partly correct the imbalance.
*Our forecasts treat driver/restraint impacts as directional, not additive. The impact forecasts reflect baseline growth, mix effects, and variable interactions.
Segment Analysis
By Battery Type: Lithium-Ion Maintains Its Lead While Solid-State Cells Remain in Pilot Production
Lithium-ion batteries accounted for 93.8% of the electric vehicle battery market size in 2025. Their position reflects improvements in lithium iron phosphate cells, which have improved energy density while retaining cost and safety benefits. These cells also fit vehicle programs that place greater weight on affordability, predictable operating performance, and a supply base that can support large production runs. Manufacturers can use them across passenger vehicles, fleet vehicles, and stationary applications, although their lower energy density still matters for some long-range designs. In China, lithium iron phosphate installations reached 625.3GWh in 2025 and represented 81.2% of power battery deployments. The installed volume increased 52.9% from 2024, strengthening the cost advantages created by production scale. Lithium iron phosphate has gained ground over nickel manganese cobalt cells in the mass vehicle segment. Lead-acid and nickel-metal hydride batteries remain concentrated in mild hybrids and low-speed electric vehicles. Sodium-ion batteries are progressing from initial commercial activity toward wider original equipment manufacturer use. Their installed capacity in China remained below 0.3GWh, limiting their current contribution to battery demand.
Solid-state batteries are projected to grow at a 37.9% CAGR through 2031, the highest rate among battery types. The rate reflects the small starting base and active development programs rather than a near-term displacement of established lithium-ion production. Producers and vehicle makers continue to assess electrolyte materials, manufacturing yields, operating safety, charging behavior, and long-term durability before committing to larger volumes. Their absolute volume remains limited because most activity still involves pilot lines or semi-solid designs. Toyota targets a 2027-2028 introduction with Idemitsu Kosan, while Samsung SDI targets small-scale production in the second half of 2027. ProLogium began work on its Dunkirk facility in February 2026 and targets 0.8GWh of output in 2028. Initial solid-state cells are expected to serve premium and halo vehicles before broader deployment. Early production costs remain above lithium iron phosphate costs despite potential energy-density benefits. Large-scale adoption depends on improving manufacturing efficiency and raising production readiness. Lithium-sulfur and silicon-anode variants remain pre-commercial during the forecast period.
By Propulsion Type: Battery Electric Vehicles Lead Demand While Plug-In Hybrids Grow Faster
Battery electric vehicles held 70.9% of the electric vehicle battery demand in 2025. Full battery-electric models require larger and more complex packs than hybrid vehicles, increasing their value contribution. Their larger packs create demand for cells, modules, cooling systems, battery management systems, and high-voltage components. This makes battery-electric programs important to suppliers even when plug-in hybrid models show faster percentage growth from a smaller base. China remained the main volume center, where combined battery electric and plug-in hybrid sales exceeded 16 million units in 2025. The electric vehicle battery market size associated with battery electric vehicles, therefore, exceeds their share of vehicle registrations. Hybrid electric vehicles retain demand, particularly among Japanese original equipment manufacturers using multi-pathway electrification plans. Their smaller battery packs limit their contribution to total battery value. Legacy hybrid programs continue to support nickel-metal hydride and smaller lithium-ion applications. Battery electric vehicles remain the main anchor for cell volume, pack development, and charging-system investment.
Plug-in hybrid electric vehicles are forecast to grow at a 13.7% CAGR through 2031. Buyers and fleet operators use them where public fast-charging networks have not developed at the same pace as vehicle availability. The internal combustion engine can address longer trips and less predictable charging access, while the battery supports lower-emission local driving. This flexibility can make plug-in hybrids more practical for organizations that are adding electric vehicles before depot and public charging networks are fully established. This pattern is notable in Southeast Asia, South America, and parts of the Middle East. Plug-in hybrids use smaller batteries than full battery-electric vehicles, which has moderated road-transport battery demand growth. They still create additional procurement opportunities for battery makers using cells designed for frequent cycling and strong power output. Extended-range electric vehicles developed by Chinese original equipment manufacturers carry larger packs than conventional plug-in hybrids. These models blur the boundary between battery-electric and plug-in hybrid architecture. Their adoption can raise battery content per vehicle within the plug-in hybrid category.


By Voltage: 400V Platforms Retain Volume While Higher-Voltage Systems Gain Ground
The less-than-400V category held 63.4% of electric vehicle battery demand in 2025. This lead reflects the large installed base of first- and second-generation vehicle platforms built around 400V systems. These architectures are well understood by vehicle makers and suppliers, and they remain relevant for models where charging speed is not the main purchase consideration. Their continued use also allows manufacturers to update existing product lines without redesigning every high-voltage component at once. Tesla Model 3 and Model Y platforms and many converted internal combustion designs contributed to this installed base. These platforms retain substantial unit volumes even as their proportional share declines. The 400-600V range in the electric vehicle battery market serves mid-range electric vehicles and some plug-in hybrid designs. It has relevance for fleet vehicles that prioritize total ownership cost over premium charging hardware. Manufacturers can use this range without adopting the higher-cost inverter and charging systems associated with 800V vehicles. The range, therefore, remains an important transition category for product planning.
The 600-800V category is projected to grow at a 12.8% CAGR through 2031. Hyundai E-GMP, Porsche J1 and PPE, and General Motors Ultium platforms helped establish higher-voltage vehicle designs. Higher voltage reduces current for the same power transfer and can reduce cable size and resistive heating. Vehicle makers must balance these benefits against higher costs for inverters, charging equipment, insulation, and safety systems. The design decision therefore depends on the vehicle segment, intended charging performance, production scale, and the availability of compatible charging infrastructure. This can lower thermal-management costs and partly offset the added cost of high-voltage power electronics. Above-800V systems are growing from a small base in premium Chinese vehicles. Higher-voltage designs are being tested in premium vehicle applications. Commercial volume above 800V is expected to remain limited through 2028. Wider adoption depends on lower costs for wide-bandgap power electronics.
Geography Analysis
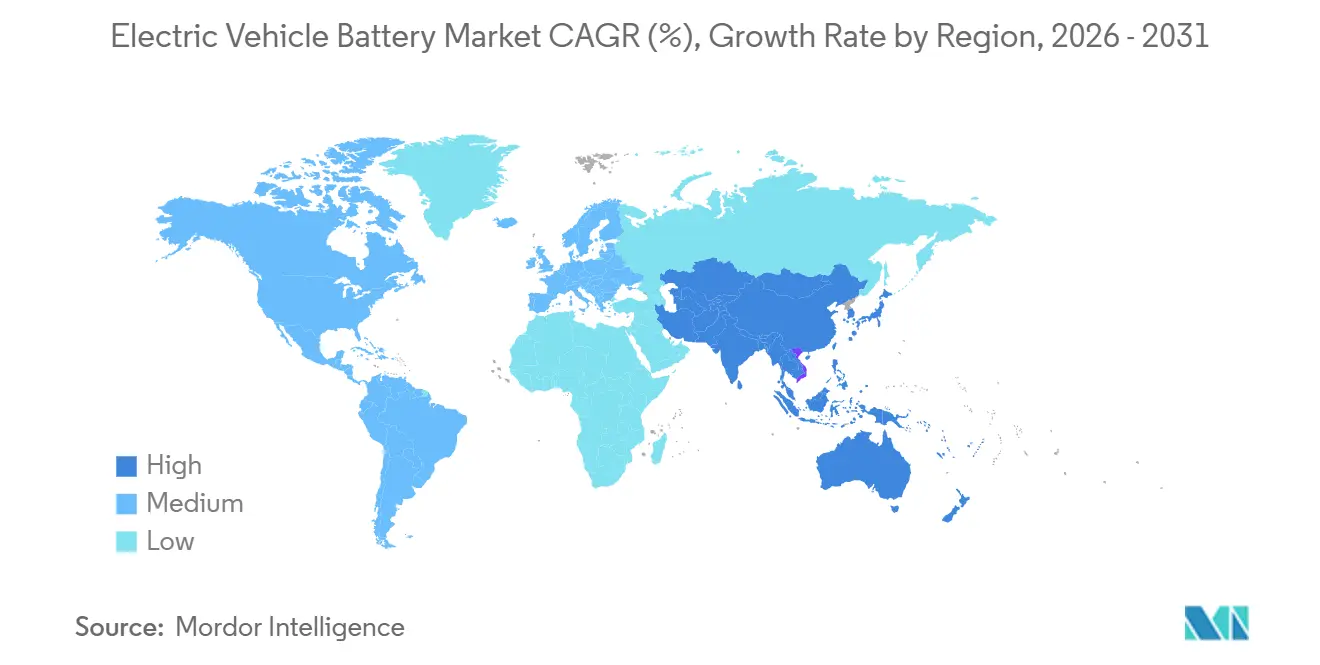
Asia-Pacific held 63.7% of the electric vehicle battery market share in 2025 and is forecast to grow at a 15.2% CAGR through 2031. China installed 769.7GWh of domestic power batteries in 2025, an increase of 40.4% from 2024. This volume represented more than half of the global deployment by capacity. China combines vehicle demand, material processing, cell manufacturing, and pack assembly within a large domestic ecosystem. This proximity can shorten the path between vehicle demand signals and battery production planning. It can also help producers coordinate material supply, cell chemistry choices, pack design, and vehicle launch schedules across related parts of the value chain. Japan and South Korea remain established technology developers, but Chinese producers have expanded partnerships with global vehicle makers. Indian, Vietnamese, Indonesian, and Thai markets are becoming a secondary source of demand. India recorded 2.3 million electric vehicle deployments in 2025, which drew on both domestic and imported battery supply. Grid-scale renewable integration in Australia also increases regional cell demand through stationary storage.
Europe and North America represented 35% of global electric vehicle battery demand in 2026. European new vehicle battery deployment was estimated at 350-400GWh in 2026. Battery electric vehicle penetration in new registrations reached 35-40% across the region. Germany remained Europe's largest demand center, with 37.1GWh installed in new electric vehicle registrations during the first 10 months of 2025. The European Union Battery Regulation increases the importance of carbon disclosures, recycled-content targets, and supply-chain due diligence. Producers supplying the region need systems that can track material sources and document battery characteristics across their operations. These requirements can add work for smaller firms, while integrated producers may use existing supplier relationships and data systems to respond more efficiently. Volkswagen's PowerCo began series production at Salzgitter in December 2025, supporting regional cell manufacturing. North American demand stalled in 2025 after consumer incentives began to phase out. This slowdown left factory capacity above immediate vehicle demand and encouraged some storage-focused production.
South America remains smaller, although Brazil recorded electric vehicle sales growth of 75% in 2025. Urban commercial fleets are leading much of the region's early electric vehicle battery market demand. Chile and Argentina matter to the wider supply chain because of their lithium resources. The Gulf Cooperation Council is driving much of the Middle East and Africa expansion through policy targets and new manufacturing projects. Current demand is smaller than in Asia-Pacific, Europe, and North America, so announced targets and manufacturing investments have an outsized role in the region's forecast growth rate. The region's direction depends on charging buildout, vehicle availability, policy delivery, and the ability of projects to establish reliable supply links. The United Arab Emirates has more than 740 public chargers and targets a 20% electric vehicle share in Dubai. Saudi Arabia has set a 30% electric vehicle penetration target for Riyadh by 2030. Morocco committed USD 346 million to Gotion's Kenitra gigafactory, supporting export-oriented manufacturing for European supply chains.

Competitive Landscape
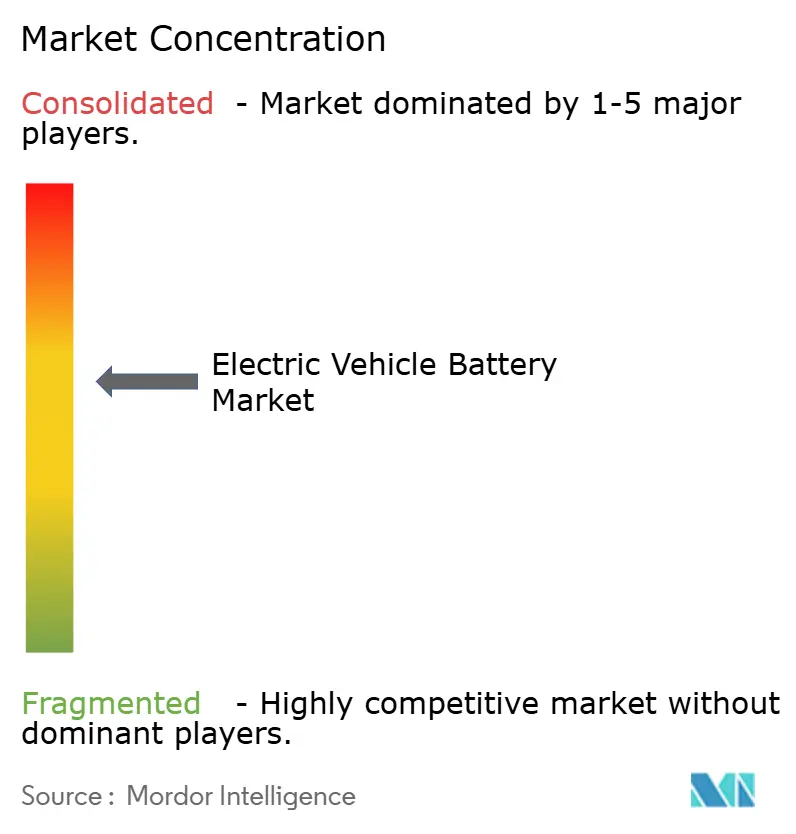
The electric vehicle battery market is moderately concentrated by installation volume and highly competitive on price. CATL and BYD held a combined 44.3% share of non-China deployments during the first 5 months of 2026. Their scale is reinforced by operations covering cathode materials, cell production, and pack assembly. This integration allows cost structures that procurement-dependent producers can find difficult to match. It also gives leading producers more direct control over material availability, production planning, and changes in cell chemistry. Companies without comparable integration may need to rely more heavily on supply contracts and joint development arrangements to improve security and manage costs. CATL, CALB, Gotion High-Tech, and SVOLT have expanded lithium iron phosphate output at lower costs than nickel manganese cobalt-focused competitors. Korean and Japanese producers face pressure as Chinese companies increase overseas original equipment manufacturer partnerships. The electric vehicle battery market, therefore, rewards reliable supply, chemistry flexibility, and production scale.
CATL used product development as well as scale to compete in 2026. It's April 2026 Super Technology Day introduced the third-generation Shenxing battery, the third-generation Qilin battery, Naxtra sodium-ion cells, and a charge-swap solution. The company also announced plans for 4,000 integrated charge-swap stations across 190 cities by the end of 2026. Samsung SDI is pursuing solid-state cells and targets commercial output from its Suwon line in the second half of 2027. ProLogium is developing a European solid-state supply option through its planned Dunkirk facility. These approaches reflect different views on the timing and scale of solid-state commercialization. A faster transition could reward companies that have already developed production processes and supplier networks for solid electrolytes. A slower transition would preserve the importance of improvements in existing lithium-ion chemistries, particularly lithium iron phosphate cells that have gained scale and cost advantages. Battery-as-a-service and second-life battery aggregation remain less established areas for major cell producers.
Volkswagen's PowerCo commissioned its Salzgitter gigafactory in December 2025 and started unified-cell production. The facility is the lead site for later PowerCo plants in Valencia and St. Thomas. This strategy gives Volkswagen more direct involvement in cell technology and regional supply. Agratas Energy Storage Solutions and Amara Raja Energy and Mobility are developing capabilities for India's growing domestic electric vehicle base. Original equipment manufacturers are also moving toward longer supply contracts and equity co-investment with battery partners. Such agreements can secure battery road maps several years ahead. They can align cell design, factory capacity, quality standards, and model-launch schedules before vehicle production begins. For battery manufacturers, these arrangements can improve demand visibility, while vehicle makers can reduce exposure to short-term supply disruptions and unplanned technology changes. They can also narrow opportunities for mid-tier producers without established vehicle-maker development relationships.
Electric Vehicle Battery Industry Leaders
Contemporary Amperex Technology Co. Limited (CATL)
BYD Co. Ltd.
LG Energy Solution Ltd.
CALB Group Co. Ltd.
Gotion High-Tech Co. Ltd.
- *Disclaimer: Major Players sorted in no particular order

Recent Industry Developments
- September 2026: Hungary announced plans to establish a new environmental watchdog with expanded authority over EV battery manufacturing, recycling, and decommissioning. The government also proposed higher environmental penalties for battery manufacturers, including fines of up to 5 billion forints (approximately USD 16 million) for serious violations.
- August 2026: General Motors and LG Energy Solution announced that battery-cell production at their Ultium Cells Ohio plant was set to resume following a seven-month production suspension caused by weaker EV demand. Approximately 1,400 employees were expected to return as the facility restarted production for GM's EV programs.
- August 2026: Samsung SDI and General Motors announced an agreement to jointly develop next-generation prismatic battery cells for potential future EV applications. The batteries are being designed for high energy density and fast-charging capabilities, extending the company's existing strategic relationship into next-generation EV battery technology.
- August 2026: LG Energy Solution announced the start of production at its new Lansing, Michigan battery plant, which will manufacture large-format batteries for both EVs and energy storage systems. The facility is designed to exceed 35 GWh of annual capacity at full scale and is expected to employ approximately 1,700 people.


Global Electric Vehicle Battery Market Report Scope
An electric vehicle (EV) battery is a rechargeable energy storage system that powers the electric motor and other electrical components of an electric vehicle. It stores electrical energy in chemical form and releases it as electricity when the vehicle is in operation.
The Electric Vehicle Battery Market is segmented by battery type, propulsion type, voltage, and geography. By battery type, the market is segmented into lithium-ion, lead-acid, nickel-metal hydride (NiMH), sodium-ion, solid-state, and other battery types. By propulsion type, the market is segmented into battery electric vehicles (BEV), plug-in hybrid electric vehicles (PHEV), and hybrid electric vehicles (HEV). By voltage, the market is segmented into less than 400V, 400–600V, 600–800V, and above 800V. The report also covers the market size and forecasts for the global electric vehicle battery market across 26 countries in key regions. For each segment, the market sizing and forecasts have been provided on the basis of value (USD).
| Lithium-Ion Batteries |
| Lead-Acid Batteries |
| Nickel-Metal Hydride (NiMH) |
| Sodium-Ion Batteries |
| Solid-State Batteries |
| Other Advanced Chemistries |
| Battery Electric Vehicles (BEV) |
| Plug-in Hybrid Electric Vehicles (PHEV) |
| Hybrid Electric Vehicles (HEV) |
| Less than 400 V |
| 400–600 V |
| 600–800 V |
| Above 800 V |
| North America | United States |
| Canada | |
| Mexico | |
| Europe | Germany |
| France | |
| Italy | |
| Spain | |
| United Kingdom | |
| Poland | |
| Russia | |
| Rest of Europe | |
| Asia-Pacific | China |
| India | |
| Japan | |
| South Korea | |
| Australia | |
| Indonesia | |
| Vietnam | |
| Thailand | |
| Rest of Asia-Pacific | |
| South America | Brazil |
| Argentina | |
| Chile | |
| Rest of South America | |
| Middle East and Africa | Saudi Arabia |
| United Arab Emirates | |
| Egypt | |
| South Africa | |
| Morocco | |
| Rest of Middle East and Africa |
| By Battery Type | Lithium-Ion Batteries | |
| Lead-Acid Batteries | ||
| Nickel-Metal Hydride (NiMH) | ||
| Sodium-Ion Batteries | ||
| Solid-State Batteries | ||
| Other Advanced Chemistries | ||
| By Propulsion Type | Battery Electric Vehicles (BEV) | |
| Plug-in Hybrid Electric Vehicles (PHEV) | ||
| Hybrid Electric Vehicles (HEV) | ||
| By Voltage | Less than 400 V | |
| 400–600 V | ||
| 600–800 V | ||
| Above 800 V | ||
| By Geography | North America | United States |
| Canada | ||
| Mexico | ||
| Europe | Germany | |
| France | ||
| Italy | ||
| Spain | ||
| United Kingdom | ||
| Poland | ||
| Russia | ||
| Rest of Europe | ||
| Asia-Pacific | China | |
| India | ||
| Japan | ||
| South Korea | ||
| Australia | ||
| Indonesia | ||
| Vietnam | ||
| Thailand | ||
| Rest of Asia-Pacific | ||
| South America | Brazil | |
| Argentina | ||
| Chile | ||
| Rest of South America | ||
| Middle East and Africa | Saudi Arabia | |
| United Arab Emirates | ||
| Egypt | ||
| South Africa | ||
| Morocco | ||
| Rest of Middle East and Africa | ||


Key Questions Answered in the Report
What is the projected value of electric vehicle batteries by 2031?
The electric vehicle battery market is forecast to reach USD 157.89 billion by 2031, growing at a 12.23% CAGR from 2026. The forecast follows an estimated value of USD 88.67 billion in 2026.
Which battery chemistry leads electric vehicle demand?
Lithium-ion batteries held 93.8% of demand in 2025, supported by the cost and safety profile of lithium iron phosphate cells. Solid-state batteries have the fastest forecast growth rate, but begin from a limited base.
Why are 800V electric vehicle systems becoming more common?
Higher-voltage systems can support faster charging, lower current flow, smaller cables, and reduced resistive heating. Manufacturers must also manage higher costs for power electronics, insulation, charging equipment, and safety systems.
Which propulsion type is growing fastest for battery suppliers?
Plug-in hybrid electric vehicles are forecast to grow at a 13.7% CAGR through 2031, especially where fast charging remains limited. Extended-range models can carry larger packs than conventional plug-in hybrid vehicles.
Which region has the strongest electric vehicle battery demand?
Asia-Pacific led with 63.7% share in 2025, supported by China's vehicle demand and integrated supply base. Japan, South Korea, India, Southeast Asia, and Australia also support the region's demand profile.
What supply risk affects battery cell production most?
Mineral refining is concentrated in China, which controls 60-90% of capacity across lithium, cobalt, and rare earth elements. This concentration makes supply diversification difficult within short investment timelines.
Page last updated on:





